-
February 2026
 Brought to you by Direct Selling Capital Advisors
Direct Selling Index Mirrors the DJIA for the Month of February 2026
The Direct Selling Capital Advisors Direct Selling Index (DSCI) increased by 0.2% in February 2026 compared to January, closely tracking the performance of the Dow Jones Industrial Average (DJIA), which rose 0.4% over the same period.
Over the first two months of 2026, the DSCI has recorded a modest gain of 1.9%, reflecting generally stable performance among publicly traded direct selling companies despite ongoing macroeconomic uncertainty.
Since its inception, the DSCI has generated a cumulative return of 92.8%, underscoring the long-term resilience and growth potential of the direct selling sector relative to broader equity markets.

Market and Economic Environment
US equity markets experienced increased volatility during February 2026 as investors navigated a complex macroeconomic environment shaped by geopolitical tensions, persistent inflation concerns and mixed economic data. While major indices fluctuated throughout the month, markets broadly reflected cautious sentiment as investors reassessed expectations for monetary policy and global economic stability. Rising energy prices and geopolitical developments in the Middle East contributed to heightened market uncertainty and increased volatility across equity and commodity markets.
Economic data released during February suggested a gradually softening labor market alongside ongoing inflation pressures. The US economy unexpectedly lost approximately 92,000 jobs during the month, pushing the unemployment rate higher and raising concerns about slowing economic momentum. At the same time, elevated oil prices and supply disruptions increased inflation risks, complicating the Federal Reserve’s policy outlook and potentially delaying anticipated interest rate cuts.
Fixed income markets reflected this uncertainty as Treasury yields and mortgage rates fluctuated in response to shifting expectations regarding inflation and monetary policy. Although borrowing costs remain below the highs seen in 2023, interest rates continued to reflect caution among policymakers as they balance inflation control with signs of weakening employment growth.
Investor sentiment remained selective throughout February, with market participants favoring companies demonstrating resilient earnings, disciplined cost structures and strong balance sheets. At the same time, geopolitical risks and energy price volatility contributed to concerns about potential stagflation scenarios, reinforcing a more defensive investment posture across global markets.
Direct Selling Industry Developments
The direct selling industry continued to demonstrate structural resilience during February 2026 despite broader macroeconomic uncertainty. Consumer demand within core categories—including wellness, nutrition and personal care—remained relatively stable as companies continued to adapt their business models to evolving market conditions.
Industry research and commentary during the month highlighted a growing divergence in performance among direct selling companies. According to industry surveys and analysis, approximately half of mid- to large-sized direct selling companies reported year-over-year growth, while the remaining companies experienced declining revenues, illustrating an increasingly competitive and fragmented operating environment.
Companies achieving the strongest performance were typically those investing in digital infrastructure, modern compensation structures and enhanced distributor engagement strategies. The continued integration of mobile commerce tools, social commerce platforms and data-driven field support solutions has emerged as a critical factor supporting distributor productivity and customer retention.
Technology-enabled transformation therefore remained a defining theme across the sector. Companies increasingly focused on blending traditional direct selling models with digital commerce capabilities, enabling more flexible customer acquisition and strengthening omnichannel engagement strategies.
Direct Selling Capital Advisors Index (DSCI)
The Direct Selling Capital Advisors Index (DSCI) recorded modest gains during February, broadly mirroring the performance of major US equity benchmarks. While volatility increased across global markets, several large-cap direct selling companies demonstrated relatively stable trading patterns, supported by ongoing operational improvements and improving investor sentiment toward companies showing progress in earnings visibility and balance sheet management.
Compared with broader equity indices, the DSCI continued to display relatively moderate volatility during periods of market stress. This stability reflects the defensive characteristics often associated with the sector, particularly among companies operating in consumer wellness and personal care categories.
Since its inception, the DSCI continues to demonstrate strong cumulative performance relative to traditional benchmarks, underscoring the long-term growth potential of publicly traded direct selling companies despite cyclical market pressures.
Looking Forward—Strategic Outlook
As the first quarter of 2026 progresses, the direct selling sector continues to face a dynamic combination of macroeconomic challenges and strategic opportunities. Several key themes are likely to influence industry performance in the months ahead:
Macroeconomic sensitivity: Consumer spending trends may face pressure from higher energy costs, labor market softness and continued inflation uncertainty.
Digital and omnichannel transformation: Companies investing in social commerce, mobile ordering platforms and digital distributor tools are likely to maintain a competitive advantage.
Operational efficiency and cost discipline: Continued focus on margin management and supply chain optimization will remain critical as companies navigate economic volatility.
Strategic differentiation: Firms successfully balancing traditional distributor networks with modern ecommerce and digital engagement strategies are expected to outperform peers.
Overall, February 2026 highlighted a more uncertain macroeconomic environment compared with the start of the year. Nevertheless, the direct selling sector continues to demonstrate resilience through adaptable business models, expanding digital capabilities and consistent demand across core consumer product categories.
Large Cap
Note: For the purposes of this report, Direct Selling Capital considers companies with a market capitalization more than $1 billion “Large Cap.”
Betterware de Mexico (NASDAQ: BWMX), founded in 1995, is the leading direct-to-consumer company in Mexico focused on innovative products related to household organization, practicality, space-saving and hygiene. Through the acquisition of JAFRA on April 7, 2022, the company expanded into the beauty market in Mexico and the US, offering fragrances, color cosmetics, skincare and toiletries. The combined business operates an asset-light model with low capital expenditure, consistent profitability, double-digit revenue growth and strong free cash flow generation. Today, Betterware distributes its products in both Mexico and the United States.
In February 2026, Betterware’s stock declined by 7.7% compared to January, bringing its year-to-date performance to 16.6%. Since the inception of the DSCI, the stock remains up 75.9%. At month-end, BWMX had a market capitalization of approximately $652 million and traded in a 52-week range of $7.00 to $19.79.
February activity was driven by the company’s fourth-quarter 2025 results and subsequent dividend announcement. BeFra reported steady operating progress, ongoing debt reduction and continued strategic expansion efforts, while also announcing that shareholders approved an aggregate dividend payment of MXN 200 million at the February 20, 2026 meeting. While the share price softened during the month, the company’s continued focus on free cash flow, shareholder returns and regional growth remains constructive for the medium-term outlook.
The February decline appears more consistent with profit-taking after the strong January rally than with any major deterioration in fundamentals. Investors will likely remain focused on execution in Mexico, JAFRA integration benefits and the pace of geographic expansion across Latin America.
Nu Skin Enterprises, Inc. (NYSE: NUS), together with its subsidiaries, engages in the development and distribution of various beauty and wellness products worldwide. It offers skincare devices, cosmetics and other personal care products, including ageLOC LumiSpa and ageLOC LumiSpa iO; and nutrition skincare products. The company also provides wellness products, such as LifePak nutritional supplements, ageLOC TR90 weight management system and Beauty Focus Collagen+. In addition, it is involved in the research and product development of skincare products and nutritional supplements. The company sells its products under the Nu Skin, Pharmanex and ageLOC brands through retail stores, website, digital platforms and independent direct sellers and marketers, as well as a service center. Nu Skin Enterprises, Inc. was founded in 1984 and is headquartered in Provo, Utah.
In February 2026, Nu Skin’s stock declined by 20.1% compared to January, reducing year-to-date performance to -11.9%. Since the DSCI’s inception, the shares remain down 64.1%. At the end of February, the stock traded in a 52-week range of $5.32 to $14.62, with a market capitalization of approximately $373 million.
February sentiment was pressured despite continued shareholder returns. Nu Skin announced that its board declared a quarterly cash dividend of $0.06 per share, payable in March. At the same time, investor focus remained on earnings quality, currency headwinds and the company’s need to translate product innovation and market expansion into more consistent revenue stabilization. Yahoo Finance coverage of the company’s fourth-quarter earnings highlighted 51% EPS growth and management’s plans for global expansion, but those positives were not enough to offset the market’s cautious stance during the month.
While Nu Skin continues to promote long-term catalysts such as new device rollouts and geographic expansion, February’s share-price weakness indicates that investors still want clearer evidence of sustainable top-line recovery. The balance between innovation, field productivity, and margin preservation will remain central to the stock’s trajectory in coming quarters.
Herbalife Nutrition, Inc. (NYSE: HLF) provides health and wellness products across North America, Latin America, EMEA, China and Asia Pacific. The company offers products in the areas of weight management; targeted nutrition; energy, sports and fitness; outer nutrition; and literature, promotional and other items. It also provides weight management products, including meal replacement products, protein shakes, drink mixes, weight loss supplements, healthy snacks and metabolism boosting teas; targeted nutrition products, which comprise functional beverages and dietary and nutritional supplements that contain herbs, vitamins, minerals and other natural ingredients; outer nutrition products, such as facial skin, body and hair care products; and energy, sports and fitness products, including N-R-G tea and energy drink products. In addition, it offers literature, promotional and other materials that comprise start-up kits, sales tools and educational materials. The company sells its products through sales representatives, independent service providers and company-operated retail stores and platforms. The company was formerly known as Herbalife Nutrition Ltd. and changed its name to Herbalife Ltd. in April 2023. Herbalife Ltd. was founded in 1980 and is headquartered in Los Angeles, California.
In February 2026, Herbalife’s stock increased by 13.2% compared to January, extending its year-to-date gain to 51.4%. Despite this strong recovery, the shares remain down 39.7% since the establishment of the DSCI in February 2020. As of month-end, Herbalife had a market capitalization of approximately $1.71 billion and traded within a 52-week range of $6.20 to $20.40.
The February rally was supported by stronger fourth-quarter and full-year 2025 results. Herbalife reported fourth-quarter net sales growth of 6.3% to approximately $1.3 billion, adjusted EBITDA of $156.1 million, and diluted EPS of $0.81. Management noted continued debt reduction, improving sales trends and strategic emphasis on product innovation and a more digitally enabled distributor experience. The company also disclosed that Cristiano Ronaldo invested $7.5 million in Herbalife’s Pro2col technology platform, highlighting continued commitment to digital engagement tools that could improve distributor productivity and customer retention.
Herbalife’s strong February performance suggests investors are increasingly rewarding operational stabilization, improving financial discipline, and digital transformation initiatives. Although volatility is likely to remain elevated, the company entered March with improving momentum and a meaningfully better sentiment profile than a year ago.
Medifast, Inc. (NYSE: MED), through its subsidiaries, operates as a health and wellness company offering habit-based, coach-guided lifestyle solutions focused on weight management and obesity support in the United States. The company’s flagship brand, OPTAVIA, delivers clinically-supported weight loss programs, GLP-1 support plans and a wide variety of food products—such as bars, shakes, soups, cereals and snacks—complemented by one-on-one coaching, digital tools and community support. Medifast was founded in 1980 and is headquartered in Baltimore, Maryland. Its products are sold via point-of-sale transactions and ecommerce.
In February 2026, Medifast shares declined by 8.0% compared to January, bringing year-to-date performance to -1.4%. Since the inception of the DSCI, the stock has fallen 86.8%, making it one of the weakest long-term performers in the index. At month-end, MED had a market capitalization of approximately $117 million and traded within a 52-week range of $10.10 to $15.46.
February developments were dominated by the company’s fourth-quarter and full-year 2025 results. Direct Selling News reported fourth-quarter revenue of $75.1 million and full-year revenue of $385.8 million, while the company ended the year with $167.3 million in cash, cash equivalents and investment securities and no interest-bearing debt. Management guided first-quarter 2026 revenue to a range of $65 million to $80 million, reflecting continued top-line pressure. Investors responded somewhat positively to revenue coming in ahead of expectations, but concerns remain around coach productivity, profitability and the pace of the company’s transformation.
Overall, Medifast remains a higher-risk turnaround story. The balance sheet is still a key strength, but sustained revenue declines and structural pressure from the evolving weight-management market continue to weigh on sentiment. Investors will likely need clearer evidence of stabilization before assigning a more constructive valuation.
USANA Health Sciences, Inc. (NYSE: USNA) develops, manufactures and sells science-based nutritional, personal care and skincare products across Asia Pacific, the Americas and Europe. The company operates through two segments: Direct Selling and Hiya Direct-To-Consumer. Its product lineup includes USANA Nutritional Optimizers for cardiovascular, skeletal and digestive health; Essentials/CellSentials—vitamin and mineral supplements for all ages beginning at 13 months; and food products such as meal replacement shakes and snack bars for healthy weight management, digestive health and hydration. USANA also offers the Celavive skincare line tailored for various skin types and ethnicities, as well as online tools and business materials for associates. Products are sold through retail, subscription-based models and direct selling. The company holds research collaboration agreements with the Beijing University of Chinese Medicine and the National Sports Training Bureau. USANA was founded in 1992 and is headquartered in Salt Lake City, Utah.
In February 2026, USANA’s stock declined by 0.8% compared to January, though year-to-date performance remained positive at 9.6%. Since the inception of the DSCI, the shares are down 67.4%. At month-end, USANA had a market capitalization of approximately $347 million and traded in a 52-week range of $18.48 to $38.32.
February trading was shaped by the company’s fourth-quarter and full-year 2025 financial results. According to Direct Selling News, fiscal 2025 net sales reached $925 million, up 8% year-over-year, while net earnings totaled $10.8 million with diluted EPS of $0.58 and adjusted EBITDA of $101.3 million. USANA’s fourth-quarter results came in roughly in line with revenue, while full-year guidance slightly exceeded analyst expectations. Management continues to position product innovation, global brand development and omnichannel diversification as key priorities entering 2026.
Although the stock was relatively stable in February, investor sentiment remains measured. The company’s debt-free balance sheet and improving revenue base are positives, but execution risk remains around distributor engagement, inventory management and the pace at which direct-to-consumer initiatives can supplement the core business.
eXp World Holdings, Inc. (NASDAQ: EXPI) together with its subsidiaries, provides cloud-based real estate brokerage services for residential homeowners and homebuyers. The company operates through three segments: North American Realty, International Realty and Other Affiliated Services. It acts as a licensed broker for processing residential and commercial real estate transactions and provides other real estate support services. In addition, the company offers FrameVR.io, a web-accessible proprietary technology providing immersive 3D platforms; SUCCESS magazine and its related media properties, which offer training, classes, resources and tools under the SUCCESS brand; and SUCCESS Space, a coworking solution that provides rental workspaces, professional development coaching, media production services, virtual-world communications technology and full-service cafes.
The company operates primarily in North America, Canada, the United Kingdom, Australia, South Africa, India, Mexico, Portugal, France, Brazil, Italy, Hong Kong, Colombia, Spain, Israel, Panama, Germany, the Dominican Republic, Greece, New Zealand, Chile, Poland, Dubai and has expanded into Japan, Romania and The Netherlands, with additional international markets across Europe and Asia. eXp World Holdings, Inc. was formerly known as eXp Realty International Corporation and changed its name in May 2016. The company was incorporated in 2008 and is headquartered in Bellingham, Washington.
In February 2026, eXp’s stock price declined by 22.9% compared to January, bringing year-to-date performance to -23.0%. Despite the sharp monthly decline, the stock remains up 45.8% since the inception of the DSCI. At the end of February, eXp had a market capitalization of approximately $1.10 billion and traded in a 52-week range of $6.68 to $12.23.
Investor sentiment in February was influenced by the company’s fourth-quarter and full-year 2025 earnings release. eXp reported quarterly revenue of approximately $1.19 billion, while full-year revenue reached $4.77 billion. However, the company also reported a full-year net loss of $22.7 million, or $0.14 per share, which likely contributed to the sharp reset in the share price during the month. Management’s first-quarter 2026 revenue outlook of $960 million to $980 million and full-year revenue guidance of $4.85 billion to $5.15 billion suggest continued scale, but investors appear to remain cautious on profitability and execution.
While eXp’s long-term digital brokerage model remains differentiated, February’s decline indicates the market is taking a more selective view of growth companies that have yet to demonstrate consistent earnings leverage. Near-term performance will likely depend on management’s ability to improve margins while sustaining agent productivity and international expansion.
Primerica, Inc. (NYSE: PRI), together with its subsidiaries, provides financial products and services to middle-income households in the United States and Canada. The company operates in three segments: Term Life Insurance; Investment and Savings Products; Senior Health; and Corporate and Other Distributed Products. The Term Life Insurance segment underwrites individual term life insurance products. The Investment and Savings Products segment provides mutual funds and various retirement plans, managed investments, variable and fixed annuities and fixed indexed annuities; and offers segregated funds. The Corporate and Other Distributed Products segment provides mortgage loans; prepaid legal services that assist subscribers with legal matters, such as drafting wills, living wills and powers of attorney, trial defense and motor vehicle-related matters; ID theft defense services; auto and homeowners’ insurance; home automation solutions; and insurance products, including supplemental and accidental death and disability insurance. It distributes and sells its products through licensed sales representatives. Primerica, Inc. is headquartered in Duluth, Georgia.
In February 2026, Primerica’s share price declined by 3.6% compared to January, bringing its year-to-date performance to -1.8%. Despite the modest monthly pullback, the stock remains up 131.5% since the establishment of the DSCI in February 2020. As of month-end, Primerica had a market capitalization of approximately $8.35 billion and traded in a 52-week range of $230.09 to $296.00.
February trading was shaped primarily by the company’s fourth-quarter 2025 results. Primerica reported total revenues of $853.7 million, up 15% year-over-year, with diluted adjusted operating EPS of $6.13 versus $5.03 in the prior-year period. The company also highlighted record investment and savings product sales, client asset values of $129 billion and a new $475 million share repurchase authorization through the end of 2026. These results reinforced the company’s strong operating momentum, even as the stock gave back a portion of its January gains following earnings.
Overall, Primerica remains one of the strongest long-term performers in the index. Its combination of high profitability, recurring cash generation and shareholder returns continues to support a constructive outlook, although the February decline suggests some near-term consolidation after a strong multi-year run.
Oliveda International, Inc. (OTC: OLVI) was founded in 2003 and has more than 20 years of experience in: 1) the management and organic certification of mountain olive trees; 2) the extraction of international award-winning extra virgin olive oils; 3) the extraction of hydroxytyrosol, a compound with antioxidant, anti-inflammatory and skin- and eye-protective effects; and 4) the production and distribution of cosmetic and holistic waterless products derived from the olive tree.
Oliveda International, Inc. and its subsidiaries, including Olive Tree People Inc., Olive Tree People Europe AG, Oliveda Deutschland GmbH, and Olive Tree Farmers SL, were founded by German real estate investor Thomas Lommel. The group has established a unique market position through innovations such as Olive Tree Therapy “10 years in 14 days,” olive matcha (made from ground olive leaves), and a coffee alternative based on olive leaves and hydroxytyrosol. Lommel is also active in the mindfulness sector with his olive tree sound bath meditations and the broadcast of olive tree frequencies globally.
In February 2026, Oliveda’s share price increased by 49.3% compared to January, bringing its year-to-date gain to 36.4%. As of month-end, the stock traded at $0.30, with a market capitalization of approximately $186 million and a 52-week range of $0.16 to $2.57, according to the figures in your table.
While February’s move appears to reflect continued interest in the company’s growth story, Yahoo Finance coverage from 2025 highlighted Oliveda’s very rapid reported expansion. The company announced more than $104.5 million in second-year US sales, growth of nearly 1,700% with plans for further expansion into Canada and Europe. Subsequent Yahoo Finance coverage also noted continued strong momentum in 2025, including first-half growth above 70% and the launch of additional international initiatives.
Overall, Oliveda remains a highly volatile small-cap name, but February’s strong gain suggests investors continue to respond positively to its aggressive growth narrative and international expansion plans. At the same time, the gap between the current share price and its 52-week high indicates that sentiment remains uneven and that the stock is still likely to trade with elevated volatility.
The Beachbody Company, Inc. (NYSE: BODI) operates as a fitness and nutrition company in the United States and internationally. The company offers Beachbody on Demand, a subscription streaming service providing fitness programs such as P90X, Insanity and 21 Day Fix; nutrition programs including Portion Fix and 2B Mindset; and nutritional products like Shakeology shakes and Beachbody Performance supplements. The company has also faced regulatory scrutiny in California related to the classification of independent contractors, an issue that could potentially impact aspects of its historical direct selling model.
Company developments during the month continued to center on Beachbody’s broader turnaround strategy and its efforts to stabilize revenue while strengthening its digital subscription platform. Management remains focused on expanding its BODi streaming ecosystem, improving user engagement across its digital content library, and maintaining cost discipline following the company’s transition away from its former multi-level marketing structure. While the company remains in the early stages of rebuilding consistent growth, February developments suggest that investors continue to monitor subscriber trends, operating efficiency and the company’s ability to generate sustainable revenue growth as key indicators of the long-term success of its transformation strategy.
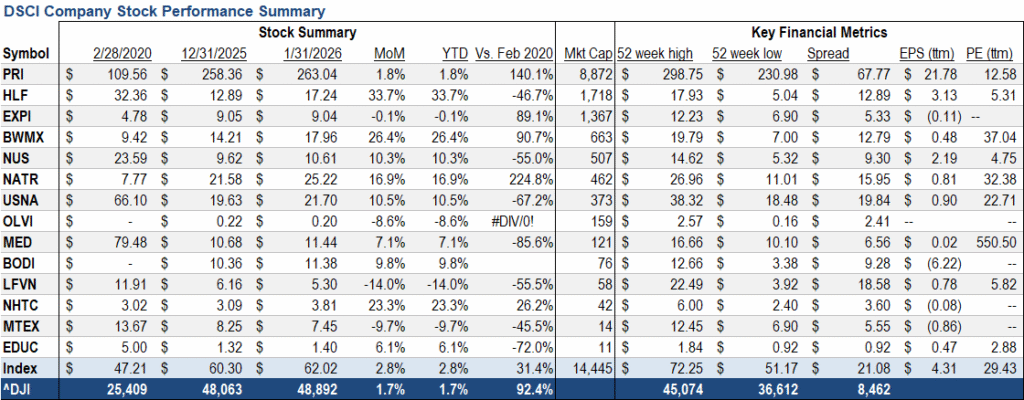
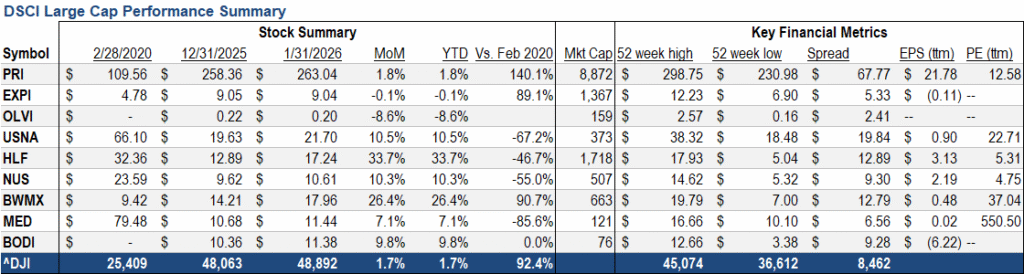
Below are two summary diagrams on the direct selling large cap companies.


The Real Brokerage Inc. (NASDAQ: REAX) is a technology-driven, asset-light real estate brokerage that empowers agents through a cloud-based platform, AI-enabled tools and integrated fintech solutions. Founded in 2014, the company operates across the United States and Canada, utilizing an independent contractor model and performance-based compensation structure that aligns with direct selling adjacent distribution frameworks.
During February 2026, Real’s narrative remained centered on platform expansion, agent-led governance and continued team recruitment rather than on any single headline financial release. On February 11 the company appointed agent leader Ken Pozek to its Board of Directors, a move that reinforced management’s emphasis on agent representation and long-term alignment with the field. Later in the month, Real also announced that Bachman Realty Group joined the platform, adding 65 agents and further strengthening the company’s footprint in the Dallas-Fort Worth and Houston markets.
These developments suggest that February was another month of steady execution against Real’s quality-at-scale strategy. Rather than pursuing growth solely through broad-based recruitment, the company continued to attract established, productive teams that can deepen density in strategic markets while leveraging Real’s technology stack, including its brokerage, mortgage, title and wallet ecosystem. That operating approach remains consistent with the growth profile highlighted previously by Direct Selling News, which has described Real as a rapidly scaling, agent-centric platform that has continued to expand its network despite a still-challenging housing backdrop.
Looking ahead, the February developments positioned Real well heading into its early March earnings release. Strong fourth-quarter and full-year 2025 results, highlighted by fourth-quarter revenue of $505.1 million, representing 44% year-over-year growth, along with gross profit of $39 million and adjusted EBITDA of $14.2 million, underscored the company’s solid operating momentum heading into March. The company’s February developments support a constructive view of Real’s platform expansion, recruiting strength and long-term scalability.
Small Cap
Below is the February information for the two largest small cap companies, Nature’s Sunshine and LifeVantage.
Nature’s Sunshine Products, Inc. (NASDAQ: NATR), a natural health and wellness company, manufactures and sells nutritional and personal care products in Asia, Europe, North America, Latin America and internationally. The company provides general health products related to blood sugar support, bone health, cellular health, cognitive function, joint health, mood, sexual health, sleep, sports and energy and vision; immune products; cardiovascular products; and digestive products. It also offers personal care products, including oils and lotions, aloe vera gel, herbal shampoo, herbal skin treatment, toothpaste and skin cleanser products, as well as weight management products. The company provides its products under the Nature’s Sunshine Products and Synergy WorldWide brands directly to customers and to a sales force of independent consultants. Nature’s Sunshine Products, Inc. was founded in 1972 and is headquartered in Lehi, Utah.
In February 2026, Nature’s Sunshine shares increased 9.8% compared to January, ending the month at $27.68. Year-to-date, the stock is up 28.3%, and since February 2020 it has gained 256.4%. Market capitalization stands at approximately $466 million. The stock traded near its 52-week high of $28.14, with a 52-week low of $11.01, while trailing EPS stands at $0.81 and the stock trades at approximately 32.6x trailing earnings.
Investor sentiment remained constructive during February as the company approaches the release of its fourth-quarter and full-year 2025 financial results. Recent operating updates highlighted continued momentum in revenue growth, improving margins, and a solid balance sheet position with no outstanding debt. These factors have supported positive sentiment toward the company’s operational trajectory heading into the new fiscal year.
LifeVantage Corporation (NASDAQ: LFVN) engages in the identification, research, development, formulation and sale of advanced nutrigenomic activators, dietary supplements, nootropics, pre- and probiotics, weight management, and skin and hair care products. It offers Protandim, a dietary supplement; LifeVantage Omega+, a dietary supplement that combines DHA and EPA Omega-3 fatty acids, Omega-7 fatty acids, and vitamin D3; LifeVantage ProBio, a dietary supplement to support gut health; LifeVantage IC Bright, a supplement to support eye and brain health, reduce eye fatigue and strain, supports cognitive functions, and support normal sleep patterns; LifeVantage Daily Wellness, a dietary supplement designed to strengthen immune health; LifeVantage Rise AM & Reset PM System that provides the body with the right nutrients; LifeVantage D3+, a dietary supplement that provides vitamin D3, vitamin K2, magnesium, calcium and other trace minerals to support a balanced immune system, strong bones and cardiovascular health; PhysIQ Fat Burn to support weight management; PhysIQ Prebiotic is a dietary supplement designed to support the good bacteria in the gut and a healthy microbiome; Petandim for Dogs, a supplement to combat oxidative stress in dogs; and Axio, a nootropic energy drink mix. The company also provides anti-aging skincare products, including liquid collagen, facial cleansers, eye cream, moisturizing cream, sunscreen, perfecting lotions, hand creams as well as hair care products such as invigorating shampoos, nourishing conditioners and scalp serums under the TrueScience brand name. It sells its products through its website and network of independent consultants in the United States, Mexico, Japan, Australia, Hong Kong, Canada, Thailand, the United Kingdom, The Netherlands, Germany, Taiwan, Austria, Spain, Ireland, Belgium, New Zealand, Singapore and The Philippines. The company also launched Evolve Compensation Plan and other LV360 initiatives into the Philippines, Taiwan, Hong Kong, and Singapore. The company is based in Lehi, Utah.
In February 2026, LifeVantage shares declined 13.1% compared to January, closing the month at $4.61. The stock is down 25.2% year-to-date and 61.3% since February 2020. Market capitalization is approximately $60 million. The stock’s 52-week range is $3.90 to $17.64, with trailing EPS of $0.60 and a trailing P/E of approximately 7.9x.
The decline followed weaker fiscal Q2 2026 results reported earlier in February. Revenue for the quarter ended December 31, 2025 totaled $48.9 million, representing a 27.8% year-over-year decline, although sales improved modestly on a sequential basis. Management attributed the decline primarily to lower sales of the MindBody GLP-1 System, partially offset by growth in other product categories following the LoveBiome acquisition. Despite the softer revenue environment, the company announced a $60 million share repurchase authorization, signaling management’s confidence in the long-term outlook.
Below are two summary diagrams on the direct selling small cap companies.


Short Interest Data & Analysis
The following chart is an aggregate index of “days to cover” among the entire tracking set. Days to cover (DTC) is a measurement determined by dividing the total outstanding short interest by average daily trading volume.
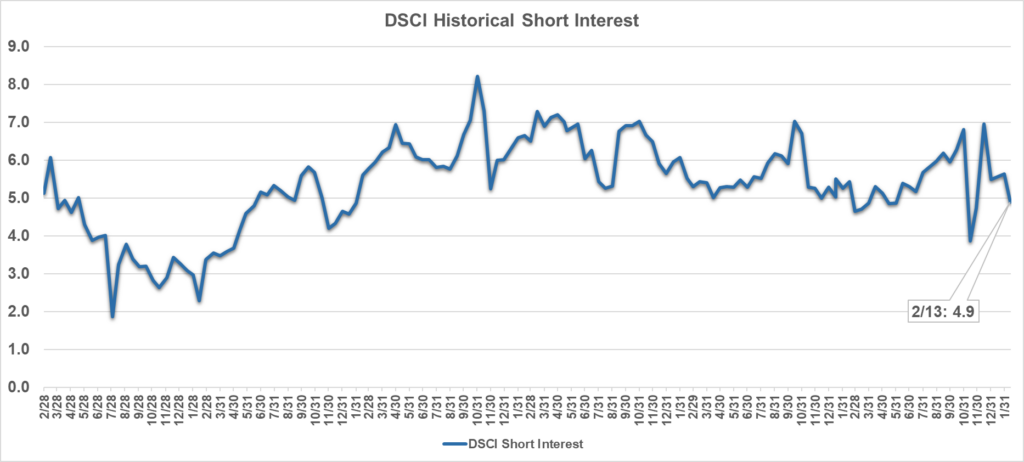
As indicated in the chart, short interest in DSCI stocks was 4.9 days as of February 13, 2026. Short interest can be a difficult indicator to analyze. On the one hand, an increase in short interest can be a bearish sign in that it indicates an increased view among investors that a stock is likely to decline based on any number of factors, such as a belief that the company’s fundamentals are deteriorating or that it has run too far, too fast. On the other hand, as a stock moves higher, a significant short interest can serve as extra fuel on the fire as investors scramble to “buy to cover” their short positions and mitigate losses.

Analyst Sentiment Index
The DSCA Analyst Sentiment Index is a consensus tracking tool that aggregates and averages the recommendations of all covering analysts across all public direct selling companies.

-
January 2026
Brought to you by Direct Selling Capital Advisors
Direct Selling Index Mirrors the DJIA for the Month of January 2026
The Direct Selling Capital Advisors Direct Selling Index (DSCI) increased by 1.7% in January compared to December 2025. The DJIA increased by 1.63% over the same period. Over the first month of 2026, the DSCI recorded a modest increase of 1.7%. When comparing the DSCI to the DJIA since the inception of the DSCI, the DSCI’s cumulative return is 92.4%.

Market and Economic Environment
US equity markets opened 2026 with cautious optimism, delivering modest gains amid continued macroeconomic uncertainty. January trading was characterized by intermittent volatility as investors balanced expectations of potential Federal Reserve rate cuts later in the year against persistent inflation concerns and geopolitical developments. Despite several risk-off episodes during the month, major indices largely ended January slightly higher, supported by selective earnings strength and improving market breadth.
Economic data released during January painted a mixed picture. Inflation showed further signs of moderation, though price pressures remained above the Federal Reserve’s long-term target. Labor market indicators suggested gradual cooling with payroll growth slowing and job openings trending lower, reinforcing expectations that monetary policy easing could begin in the first half of 2026. Fixed income markets reflected this outlook, as longer term Treasury yields remained range bound and credit spreads stayed relatively tight, signaling continued confidence in corporate balance sheets.
Equity leadership rotated during the month with value-oriented and cyclical sectors outperforming high-growth technology names, which faced profit-taking and valuation sensitivity following strong prior-year performance. Investor sentiment remained constructive but selective, favoring companies demonstrating earnings visibility, cost discipline and balance sheet strength.
Direct Selling Industry Developments
The direct selling industry entered 2026 exhibiting continued structural resilience despite broader economic uncertainty. Industry data and company disclosures reinforced the durability of core product categories, particularly wellness, nutrition and personal care, which continued to demonstrate stable consumer demand amid cautious discretionary spending.
Publicly traded direct selling companies experienced varied performance during January, reflecting company-specific fundamentals rather than broad sector weakness. Investor attention increasingly focused on operational execution, margin management and geographic diversification. Companies that communicated clear progress on cost controls, supply chain efficiency and digital engagement strategies generally experienced more favorable sentiment.
Technology-enabled transformation remained a defining theme across the sector. Companies continued to expand mobile commerce capabilities, enhance distributor-facing digital tools and integrate social commerce features, supporting productivity and engagement while reducing reliance on traditional in-person sales models. This evolution further underscored the industry’s gradual shift toward omnichannel strategies that blend direct selling with broader ecommerce and retail approaches.
Direct Selling Capital Advisors Index (DSCI)
The Direct Selling Capital Advisors Index (DSCI) posted a positive return in January, broadly mirroring the performance of the broader equity markets. The index benefited from relative stability among large-cap direct selling constituents and selective gains among companies demonstrating improving earnings visibility and operational momentum.
Compared with broader benchmarks, the DSCI exhibited lower volatility during periods of market stress, reinforcing the perception of direct selling equities as relatively defensive within the small- and mid-cap universe. Trading activity was measured, as investors continued to evaluate sector positioning following year-end rebalancing and ahead of upcoming earnings releases.
Since its inception, the DSCI has continued to deliver strong cumulative performance relative to traditional market indices, reflecting the long-term growth potential and resilience of publicly traded direct selling companies.
Looking Forward—Strategic Outlook
As 2026 begins, the direct selling sector faces a combination of macroeconomic uncertainty and company-specific opportunity. Key themes expected to influence near-term performance include:
- Macroeconomic sensitivity: Consumer confidence, labor market trends and interest rate policy will remain important drivers of demand, particularly for discretionary product categories.
- Digital and omnichannel execution: Companies that successfully integrate mobile ordering, social commerce, loyalty programs and data-driven distributor tools are likely to enhance productivity and retention.
- Earnings discipline and investor confidence: Continued focus on margin management, balance sheet improvement and execution against strategic initiatives will be critical in sustaining positive investor sentiment.
- Regulatory awareness: While no material regulatory changes emerged in January, evolving compliance standards across global markets remain an ongoing consideration.
Overall, January 2026 reinforced the view that while near-term volatility may persist, the direct selling sector remains structurally resilient, supported by adaptable business models, loyal customer bases and ongoing innovation.
Large Cap
Note: For the purposes of this report, Direct Selling Capital considers companies with a market capitalization in excess of $1 billion “Large Cap.”
Betterware de Mexico (NASDAQ: BWMX), founded in 1995, Betterware de Mexico is the leading direct-to-consumer company in Mexico focused on innovative products related to household organization, practicality, space-saving and hygiene. Through the acquisition of JAFRA on April 7, 2022, the company expanded into the beauty market in Mexico and the US, offering fragrances, color cosmetics, skincare and toiletries. The combined business operates an asset-light model with low capital expenditure, consistent profitability, double-digit revenue growth and strong free cash flow generation. Today, Betterware distributes its products in both Mexico and the United States.
In January 2026, Betterware’s share price increased approximately 26.4% month-over-month, marking a strong rebound from year-end trading and reflecting renewed investor confidence. Year-to-date, the stock is up 26.4%, positioning BWMX as one of the stronger performers within the direct selling sector early in the year. Since the inception of the Direct Selling Capital Advisors Direct Selling Index (DSCI) on February 1, 2020, BWMX has generated a total return of 90.7%, highlighting substantial long-term shareholder value creation.
Operational momentum entering 2026 remained solid. Recent results continued to reflect disciplined cost management, favorable product mix and ongoing synergies from the JAFRA integration. The company’s asset-light operating model and focus on margin preservation supported consistent EBITDA generation and healthy free cash flow, reinforcing its ability to fund growth initiatives while maintaining shareholder return programs.
While macroeconomic pressures and consumer demand variability in Mexico persist, Betterware’s diversified portfolio across home organization and beauty has helped stabilize revenue trends. Management’s continued emphasis on geographic expansion across Latin America—including preparation for entry into Colombia—along with investments in distributor productivity and digital tools, underscores the company’s focus on sustainable long-term growth.
Nu Skin Enterprises, Inc. (NYSE: NUS), together with its subsidiaries, engages in the development and distribution of various beauty and wellness products worldwide. It offers skincare devices, cosmetics and other personal care products, including ageLOC LumiSpa and ageLOC LumiSpa iO; and nutrition skincare products. The company also provides wellness products, such as LifePak nutritional supplements, ageLOC TR90 weight management system and Beauty Focus Collagen+.
In addition, it is involved in the research and product development of skincare products and nutritional supplements. The company sells its products under the Nu Skin, Pharmanex and ageLOC brands through retail stores, website, digital platforms and independent direct sellers and marketers, as well as a service center. Nu Skin Enterprises, Inc. was founded in 1984 and is headquartered in Provo, Utah.
In January 2026, Nu Skin’s stock increased 10.3% month-over-month, building on the recovery seen late last year. For the year-to-date, the stock is up 10.3%. Despite this positive start to 2026, the stock remains approximately 55% below its level at the inception of the Direct Selling Capital Advisors Direct Selling Index (DSCI) in February 2020, reflecting the long-term headwinds the company is working to overcome. The stock traded within a 52-week range of a high of $14.62 and a low of $5.32.
Momentum during January was largely fueled by renewed investor optimism following the company’s strategic presentation at the ICR Conference on January 12. Management utilized this platform to outline its 2026 roadmap, specifically highlighting the upcoming launch of the Prysm iO intelligent wellness device and the pre-market expansion steps into India. These initiatives bolstered confidence in the company’s ability to pivot toward high-growth opportunities despite broader sector challenges. Additionally, the market reacted favorably to the company’s valuation, which many analysts signaled had decoupled from intrinsic value given the company’s solid balance sheet and net cash positive position carried over from 2025.
Operational execution remained focused on preparing for the commercial rollout of new digital-first initiatives. Following the aggressive portfolio rationalization in late 2025, the company continued to refine its inventory and supply chain to support the targeted release of Prysm iO. Regionally, the company maintained aggressive promotional activities in key Asian markets, such as the “Triple Up” welcome privileges launched in Hong Kong, to stimulate distributor engagement. While Latin America continues to show promise, visibility into a consumer spending recovery in Mainland China and North America remains limited entering the first quarter.
Governance and shareholder alignment continue to be critical themes as the company approaches its next earnings cycle. With the Q4 and full-year 2025 financial results scheduled for release in mid-February, investor focus has shifted to whether the “net cash” financial health and reduced debt load ($209 million) can be sustained alongside the capital investments required for the India expansion. While macro-risks persist, Nu Skin’s double-digit gain in January suggests the market is cautiously pricing in a stabilization of the core business and potential upside from its 2026 innovation pipeline.
Herbalife Ltd. (NYSE: HLF) (formerly Herbalife Nutrition, Inc.) provides health and wellness products across North America, Latin America, EMEA, China and Asia Pacific. The company offers products in the areas of weight management; targeted nutrition; energy, sports and fitness; outer nutrition; and literature, promotional and other items.
It also provides weight management products, including meal replacement products, protein shakes, drink mixes, weight loss supplements, healthy snacks and metabolism boosting teas; targeted nutrition products, which comprise functional beverages and dietary and nutritional supplements that contain herbs, vitamins, minerals and other natural ingredients; outer nutrition products, such as facial skin, body and hair care products; and energy, sports and fitness products, including N-R-G tea and energy drink products.
In addition, it offers literature, promotional and other materials that comprise start-up kits, sales tools and educational materials. The company sells its products through sales representatives, independent service providers and company-operated retail stores and platforms. The company was formerly known as Herbalife Nutrition Ltd. and changed its name to Herbalife Ltd. in April 2023. Herbalife Ltd. was founded in 1980 and is headquartered in Los Angeles, California.
In January 2026, Herbalife’s stock rose by 33.7%, continuing its positive momentum from the previous year. Despite this significant recent rally, HLF remains down 46.7% since the establishment of the DSCI on February 1, 2020, reflecting the long-term recovery path the company is navigating. The stock traded within a 52-week range of a high of $17.93 and a low of $5.04.
Momentum during January was driven by an accelerated valuation re-rating as investors grew more confident in the durability of the “Herbalife 2.0” transformation. The market responded enthusiastically to continued signs of distributor stabilization and the company’s disciplined approach to capital allocation, which has kept net leverage ratios within the targeted range of approximately 2.8X. This sharp double-digit gain suggests that the heavy short interest in the stock may be unwinding in response to the improving fundamental backdrop established in late 2025.
Operational execution focused heavily on technology enablement. The company rolled out critical updates to its Pro2col app (v1.0.36), introducing enhanced device syncing for water and step tracking to deepen user engagement and distributor utility. These digital enhancements are central to the company’s strategy to modernize its direct selling model. Regionally, the company amplified its brand visibility in growth markets like India through new media initiatives, such as the “Live Your Best Life” podcast series, aimed at broadening the funnel for new distributor recruitment.
Governance and forward-looking sentiment remain cautiously optimistic. While the rapid stock price appreciation has improved the technical picture, institutional investors are now looking toward the upcoming Q4 and full-year earnings report to validate whether the “beta” success of digital tools like Pro2col is translating into material revenue acceleration. Management continues to balance this aggressive digital investment with the need for strict cost controls to maintain the adjusted EBITDA margins that catalyzed the late-2025 recovery.
Medifast, Inc. (NYSE: MED), through its subsidiaries, operates as a health and wellness company offering habit-based, coach-guided lifestyle solutions focused on weight management and obesity support in the United States. The company’s flagship brand, OPTAVIA, delivers clinically-supported weight loss programs, GLP-1 support plans and a wide variety of food products—such as bars, shakes, soups, cereals and snacks—complemented by one-on-one coaching, digital tools and community support. Medifast was founded in 1980 and is headquartered in Baltimore, Maryland. Its products are sold via point-of-sale transactions and ecommerce.
For the month of January 2026, shares of Medifast increased by 7.1% compared to December. Year-to-date, the stock is up 7.1%. Since the establishment of the DSCI on February 1, 2020, the stock has declined by 85.6%. The stock traded within a 52-week range of a high of $16.66 and a low of $10.10.
Momentum in January was primarily driven by a positive market reaction to the company’s aggressive brand visibility and leadership adjustments. On January 5, Medifast announced a planned leadership transition aimed at accelerating its transformation into a “metabolic health” company.
This governance shift was accompanied by a renewed marketing push, including a feature in People Magazine highlighting a client’s metabolic health journey and the premiere of the second episode of the docuseries Health by Design on January 15. These events helped catalyze a relief rally, lifting shares off their 52-week lows as investors speculated on a potential operational floor.
Operational execution remains centered on the company’s pivot toward the GLP-1 companion market. Management continues to emphasize its “Metabolic Synchronization” strategy—designed to help users preserve lean muscle mass while using weight-loss medications—as a critical differentiator against generic food competitors. However, the operational backdrop remains challenging. Guidance for the upcoming fourth-quarter results implies continued pressure on top-line revenue ($65M–$80M range) and a year-over-year decline in active earning coaches. The company is betting that its new “LifeMD” collaboration and updated coach training will stabilize these metrics in early 2026.
Market sentiment is cautiously awaiting the Q4 and full-year 2025 financial results, scheduled for release on February 17, 2026. While the 7.1% gain in January reflects some optimism, analyst ratings remain mixed, with concerns lingering over the timeline for returning to profitability. Investors are closely monitoring whether the company’s robust cash position can effectively bridge the gap until the new metabolic health initiatives gain traction. Until coach productivity shows definitive signs of reversing its downward trend, the stock is likely to remain volatile and sensitive to news regarding the broader GLP-1 pharmaceutical landscape.
USANA Health Sciences, Inc. (NYSE: USNA) develops, manufactures and sells science-based nutritional, personal care and skincare products across Asia Pacific, the Americas and Europe. The company operates through two segments: Direct Selling and Hiya Direct-To-Consumer. Its product lineup includes USANA Nutritional Optimizers for cardiovascular, skeletal and digestive health; Essentials/CellSentials—vitamin and mineral supplements for all ages beginning at 13 months; and food products such as meal replacement shakes and snack bars for healthy weight management, digestive health and hydration.
USANA also offers the Celavive skincare line tailored for various skin types and ethnicities, as well as online tools and business materials for associates. Products are sold through retail, subscription-based models and direct selling. The company holds research collaboration agreements with the Beijing University of Chinese Medicine and the National Sports Training Bureau. USANA was founded in 1992 and is headquartered in Salt Lake City, Utah.
For the month of January 2026, USANA’s stock rose by 10.5% compared to December. Year-to-date, the stock is up 10.5%, reflecting a sharp rebound from the previous year’s lows, though it still underscores underperformance relative to broader markets and peers over the longer term. Since the establishment of the DSCI on February 1, 2020, USANA shares have lost 67.2%. The stock traded within a 52-week range of a high of $38.32 and a low of $18.48.
Momentum in January was significantly influenced by a major leadership transition and a strategic update delivered ahead of the ICR Conference. On January 8, the company announced the return of Kevin Guest as Chief Executive Officer, a move that investors viewed as a stabilizing force given his deep experience with the company’s sales force and culture. This sentiment was further bolstered on January 12, when USANA released preliminary fiscal year 2025 net sales of approximately $925 million—slightly ahead of prior guidance—and provided an initial 2026 sales outlook of up to $1 billion. These announcements helped catalyze the stock’s double-digit gain, signaling renewed market confidence in the company’s ability to navigate its turnaround.
Operationally, the company’s diversification strategy is becoming a central growth engine. Management highlighted that while the core direct selling business faces continued pressure, its subsidiaries are accelerating. The Hiya direct-to-consumer segment is projected to generate between $140 million and $155 million in 2026, while Rise Wellness (comprising Rise Bar and Protein Pop) is expected to jump to $65–$80 million. To support this growth, USANA is heavily investing in inventory and capital expenditures, accepting near-term breakeven margins in the Rise Wellness segment to capture market share. This shift from a pure-play MLM model to a diversified health and wellness platform is beginning to reshape the company’s revenue mix.
Despite the positive price action, investor sentiment remains watchful. While the leadership change and preliminary numbers were well-received, analysts continue to debate the long-term profitability of the pivot to low-margin consumer goods compared to the traditional high-margin direct selling model. With the full fourth-quarter and fiscal year 2025 results scheduled for February 17, the market is waiting to see if the “leadership renewal” strategy and subsidiary growth can translate into consistent bottom-line improvements.
eXp World Holdings, Inc. (NASDAQ: EXPI), together with its subsidiaries, provides cloud-based real estate brokerage services for residential homeowners and homebuyers. The company operates through three segments: North American Realty, International Realty, and Other Affiliated Services. It acts as a licensed broker for processing residential and commercial real estate transactions and provides other real estate support services.
In addition, the company offers FrameVR.io, a web-accessible proprietary technology providing immersive 3D platforms; SUCCESS magazine and its related media properties, which offer training, classes, resources and tools under the SUCCESS brand; and SUCCESS Space, a coworking solution that provides rental workspaces, professional development coaching, media production services, virtual-world communications technology and full-service cafes.
The company operates primarily in North America, Canada, the United Kingdom, Australia, South Africa, India, Mexico, Portugal, France, Brazil, Italy, Hong Kong, Colombia, Spain, Israel, Panama, Germany, the Dominican Republic, Greece, New Zealand, Chile, Poland, Dubai and has expanded into Japan, Romania and the Netherlands, with additional international markets across Europe and Asia. eXp World Holdings, Inc. was formerly known as eXp Realty International Corporation and changed its name in May 2016. The company was incorporated in 2008 and is headquartered in Bellingham, Washington.
In January 2026, eXp World Holdings’ stock declined 0.1% compared to December 2025. This slight consolidation follows the previous month’s volatility, reflecting a cautious holding pattern among investors ahead of full-year earnings. While the stock faced resistance due to broader sector rotation and continued scrutiny on agent governance, it stabilized relative to the sharper selloffs seen in late 2025. Despite this flat monthly performance, long-term appreciation remains robust, with shares up an aggregate 89.1% over the six years since the launch of the DSCI in February 2020.
Operationally, the company began the year by restructuring its executive compensation to align leadership incentives more closely with shareholder interests, effective January 1. Growth initiatives continued with the onboarding of high-profile agent teams, such as the Nick Shivers Team, reinforcing the appeal of the agent-centric model. Management maintained a strict focus on cost efficiency and capital allocation while preparing for the rollout of enhanced agent productivity tools. The International Realty segment continues to be a focal point, leveraging recent market entries in Europe to drive cross-border transaction volume.
Market sentiment in January was mixed, weighed down by a Delaware Court of Chancery ruling regarding board oversight duties, which added a layer of governance risk to the investment narrative. However, technical indicators such as the RSI moving out of oversold territory suggested potential stabilization. Analyst commentary remains focused on the company’s ability to navigate legal headwinds while maintaining the scalability of its cloud-based platform, with significant attention turning toward the upcoming Q4 and full-year financial results expected in late February.
Primerica, Inc. (NYSE: PRI), together with its subsidiaries, provides financial products and services to middle-income households in the United States and Canada. The company operates in three segments: Term Life Insurance; Investment and Savings Products; Senior Health; and Corporate and Other Distributed Products. The Term Life Insurance segment underwrites individual term life insurance products. The Investment and Savings Products segment provides mutual funds and various retirement plans, managed investments, variable and fixed annuities and fixed indexed annuities; and offers segregated funds.
The Corporate and Other Distributed Products segment provides mortgage loans; prepaid legal services that assist subscribers with legal matters, such as drafting wills, living wills and powers of attorney, trial defense, and motor vehicle-related matters; ID theft defense services; auto and homeowners’ insurance; home automation solutions; and insurance products, including supplemental and accidental death, and disability insurance. It distributes and sells its products through licensed sales representatives. Primerica, Inc. was founded in 1927 and is headquartered in Duluth, Georgia.
In January 2026, Primerica’s stock price increased by 1.8% compared to December 2025. This positive start to the year contrasts with the broader volatility seen in the financial sector, bringing the year-to-date performance to a gain of 1.8%. The stock’s resilience reflects continued investor confidence in the company’s defensive business model and its ability to generate consistent cash flow despite a complex macroeconomic backdrop. Long-term performance remains exceptional; since the launch of the Direct Selling Capital Advisors Direct Selling Index (DSCI) on February 1, 2020, Primerica shares have appreciated 140.1%, solidifying its position as a standout performer among index constituents.
Operationally, Primerica kicked off the year with significant momentum, highlighted by its largest-ever Senior Leadership Meeting held in early January, where management outlined strategic initiatives for sales force expansion and digital tool adoption. The company also began executing on its $475 million share repurchase program for 2026, providing structural support to the stock price. Additionally, the release of its latest Middle-Income Household Budget Index in late January offered critical insights into the “new reality” of cost-of-living pressures facing its core demographic, reinforcing the relevance of its financial education and protection products.
Market sentiment remained cautiously optimistic throughout the month, with investors positioning themselves ahead of the Fourth Quarter 2025 financial results scheduled for mid-February. Analyst commentary continues to favor Primerica’s disciplined expense management and capital return strategy, viewing the company as a stable anchor in the direct selling space. While some concerns persist regarding the impact of sustained high interest rates on investment product sales, the consensus view suggests that the company’s strong balance sheet and recurring insurance revenues provide a substantial buffer against near-term headwinds.
Within the broader industry context, recent reports from Direct Selling News emphasize the growing importance of trust and tangible value in the gig economy. Primerica’s recent national survey data, which highlights the financial resilience of middle-income families, aligns well with this industry-wide shift toward consumer advocacy. As the sector moves away from speculative growth models, Primerica’s focus on fundamental financial needs—protection, savings and debt management—continues to distinguish it as a leader in sustainable direct selling.
Oliveda International, Inc. (OTC: OLVI) was founded in 2003 and has more than 20 years of experience in: 1) the management and organic certification of mountain olive trees; 2) the extraction of international award-winning extra virgin olive oils; 3) the extraction of hydroxytyrosol, a compound with antioxidant, anti-inflammatory, anticancer and skin- and eye-protective effects; and 4) the production and distribution of cosmetic and holistic waterless products derived from the olive tree.
Oliveda International, Inc. and its subsidiaries, including Olive Tree People Inc., Olive Tree People Europe AG, Oliveda Deutschland GmbH, and Olive Tree Farmers SL, were founded by German real estate investor Thomas Lommel. The group has established a unique market position through innovations such as Olive Tree Therapy “10 years in 14 days,” olive matcha (made from ground olive leaves), and a coffee alternative based on olive leaves and hydroxytyrosol. Lommel is also active in the mindfulness sector with his olive tree sound bath meditations and the broadcast of olive tree frequencies globally.
In January 2026, Oliveda’s stock declined 8.6% compared to December 2025. For the first month of 2026, the stock has declined by 8.6%. This continued downward trajectory extends the volatility seen throughout the previous year, with the share price struggling to find a stable floor despite aggressive corporate communications regarding growth and valuation. The decline reflects persistent skepticism in the broader market regarding the disconnect between the company’s self-reported valuation milestones and its actual market capitalization.
Operationally, the company began the year with a major strategic pivot, announcing the full withdrawal of its products from European retail shelves to focus exclusively on a Direct-to-Consumer (DTC) model. Management positioned this shift—affecting markets in Germany, Austria, Switzerland and Spain—as a move to mirror its US strategy and empower its “Waterless Beauty Consultant” network. While the company touted this as a necessary step to scale its “Olive Tree People” ecosystem and convert flagship locations in Berlin and Düsseldorf into experiential hubs, the abrupt transition adds near-term execution risk to its revenue model.
As an OTC-listed issuer, Oliveda operates with significantly reduced disclosure requirements compared to exchange-listed peers. The absence of consistent, detailed financial reporting limits visibility into revenue sustainability, profitability and cash flow generation, materially constraining institutional participation and investor confidence. These factors have positioned the stock as highly speculative within the direct selling universe.
While the company continues to emphasize product innovation and distributor engagement within the broader wellness and sustainable personal care categories, market participants remain cautious. Without demonstrable improvements in financial transparency, operational consistency, and distributor network stability, the company is likely to remain subject to elevated share price volatility and restricted access to capital markets.
Looking ahead, Oliveda’s long-term prospects hinge on its ability to improve disclosure practices, establish predictable operating performance and demonstrate sustained consumer demand for its differentiated offerings. Until such visibility improves, the stock is expected to remain suitable only for investors with a high tolerance for risk.
The Beachbody Company, Inc. (NYSE: BODI) operates as a fitness and nutrition company in the United States and internationally. The company offers Beachbody on Demand, a subscription streaming service providing fitness programs such as P90X, Insanity and 21 Day Fix; nutrition programs including Portion Fix and 2B Mindset; and nutritional products like Shakeology shakes and Beachbody Performance supplements. The company also faces legal challenges in California, where efforts are underway to reclassify independent consultants as employees, which may impact its direct selling model.
In January 2026, Beachbody’s stock price increased by 9.8% compared to December 2025. This solid start to the year brings the year-to-date gain to 9.8%, building on the momentum established in late 2025. The positive performance was primarily driven by significant improvements in the company’s capital structure and renewed investor interest following management’s participation in key investor conferences. The “January Effect,” combined with the traditional seasonal surge in fitness-related spending, further supported the stock’s upward trajectory.
Operationally, the month was defined by a critical financial milestone: on January 8, the company announced a favorable amendment to its credit agreement with Tiger Finance. This restructuring significantly enhanced financial flexibility by modifying liquidity covenants, effectively de-risking the balance sheet and validating the company’s turnaround strategy.
On the product front, excitement built around the announcement of “P90X Generation Next,” a modernized iteration of its flagship program set to launch in early February. This launch represents a strategic pivot toward leveraging legacy brand equity to drive new digital subscriber growth. Additionally, the company launched the “10 Minute BODi Accountability Group” challenge, aiming to boost user retention through micro-habits and community engagement.
Market sentiment remained constructively bullish throughout January. The credit agreement amendment was well-received by analysts, who viewed it as a removal of a significant overhang on the stock. Management’s presentation at the ICR Conference in Orlando earlier in the month further solidified confidence in the company’s profitability-first approach. While caution remains regarding the long-term resolution of independent contractor classification in California, the immediate focus has shifted toward the company’s improved liquidity position and its ability to execute on its 2026 product roadmap.
From an industry perspective, Direct Selling News and broader market analysis highlight a shift in the digital fitness sector toward “hybrid accountability” models—combining digital convenience with the community support typical of direct selling. Beachbody’s January initiatives align closely with this trend. As the company moves into February, investor attention is expected to center on the initial uptake of the new P90X program and upcoming Q4 earnings, which will provide the first concrete data points on the sustainability of this recent growth.
The Real Brokerage Inc. (NASDAQ: REAX) is a technology-driven, asset-light real estate brokerage that empowers agents through a cloud-based platform, AI-enabled tools and integrated fintech solutions. Founded in 2014, the company operates across the United States and Canada, utilizing an independent contractor model and performance-based compensation structure that aligns with direct selling–adjacent distribution frameworks.
Entering January 2026, the stock faced a period of consolidation and mixed sentiment following the broader rotation out of technology and financial sectors. While analysts maintained a “Strong Buy” consensus with an average price target of approximately $6.33, the stock experienced downward pressure, ending the month near $3.54. Despite this volatility, institutional ownership remained stable at approximately 53%, and the company received a notable rating upgrade to “Strong Buy” from Freedom Capital Markets late in the month, signaling continued professional confidence in the platform’s long-term value proposition.
During the month, the company demonstrated exceptional recruitment momentum, officially surpassing the 32,000-agent milestone. This growth was bolstered by the strategic onboarding of high-production teams, including the expansion of its Michigan footprint through the 172-agent “Good Company” brokerage and the addition of the Houston Properties Team. These moves underscore the continued success of Real’s “Private Label” and “Pro Teams” programs, which allow established independent brokerages and teams to leverage Real’s technology while maintaining their local brand identity.
Technology and agent sentiment remained central to the company’s January narrative. Real released its monthly agent survey, which showed agent optimism hitting an 11-month high as the industry anticipates a 2026 housing market recovery. Management also announced plans to host the Fourth Quarter and Full Year 2025 earnings call in early March, while continuing to highlight the operational efficiencies provided by the reZEN platform and the Leo CoPilot AI.
Although the month was marked by some external legal and sector-wide headwinds, The Real Brokerage enters February focused on its quality-at-scale strategy, supported by a debt-free balance sheet and a rapidly expanding North American network.
Below are two summary diagrams on the direct selling large cap companies.

Small Cap
Nature’s Sunshine Products, Inc. (NASDAQ: NATR), a natural health and wellness company, manufactures and sells nutritional and personal care products in Asia, Europe, North America, Latin America,] and internationally. The company provides general health products related to blood sugar support, bone health, cellular health, cognitive function, joint health, mood, sexual health, sleep, sports and energy and vision; immune products; cardiovascular products; and digestive products. It also offers personal care products, including oils and lotions, aloe vera gel, herbal shampoo, herbal skin treatment, toothpaste and skin cleanser products, as well as weight management products.
The company provides its products under the Nature’s Sunshine Products and Synergy WorldWide brands directly to customers and to a sales force of independent consultants. Nature’s Sunshine Products, Inc. was founded in 1972 and is headquartered in Lehi, Utah.
In January 2026, NATR’s share price increased by approximately 16.9% compared to December 2025, marking a strong start to the new year and significantly accelerating the momentum established in late 2025. For the first month of 2026, the stock delivered a total return of 16.9%, outperforming small-cap peers across the health, wellness and direct selling sectors. Since the inception of the DSCI index, Nature’s Sunshine shares have gained 224.8%, representing the largest cumulative return among all small-cap stocks and all companies included in the DSCI. The company does not currently pay a dividend, continuing to prioritize reinvestment in growth initiatives, digital capabilities and long-term operational efficiency.
Operationally, Nature’s Sunshine entered 2026 with continued strength following a robust finish to the prior year. Recent quarterly results reflected sustained double-digit year-over-year revenue growth, driven by resilient international demand and expanding adoption of digital and subscription-based sales tools. Margin performance remained a key highlight, supported by disciplined pricing strategies, favorable product mix, and ongoing supply chain optimization. Adjusted EBITDA growth continued to outpace revenue, underscoring the scalability of the business model. Management commentary has emphasized execution consistency, consultant productivity, and ongoing investments in technology and customer engagement as core drivers for 2026 performance.
Market sentiment toward NATR strengthened further in January. According to Yahoo Finance data, analyst coverage continues to reflect a moderate buy consensus, with increasing attention on the company’s ability to generate durable cash flow, expand margins and compound growth over multiple years rather than short-term volatility. Valuation discussions suggest the stock remains reasonably priced relative to its growth trajectory and balance sheet profile, particularly within the small-cap wellness universe. Institutional ownership trends and limited short interest continue to signal confidence in the company’s long-term strategy.
From an industry perspective, Direct Selling News highlights several structural trends supporting Nature’s Sunshine’s positioning. These include accelerating digital adoption across direct selling models, rising global consumer demand for preventive health and wellness solutions and heightened emphasis on transparency, product quality and regulatory compliance. Companies that successfully blend technology-enabled commerce with relationship-driven selling are gaining competitive advantage, and Nature’s Sunshine’s ongoing digital transformation aligns well with these sector dynamics.
Looking ahead, Nature’s Sunshine enters 2026 with strong momentum, a diversified global footprint, and a clear strategic focus. Growth opportunities include further international expansion, increased penetration of autoship and loyalty programs and continued margin enhancement through operational discipline. Risks remain related to macroeconomic conditions, foreign exchange fluctuations, regulatory developments and competitive intensity within the wellness category. Overall, the company begins the new year with exceptional stock performance, improving financial fundamentals and a favorable position within the global direct selling landscape.
LifeVantage Corporation (NASDAQ: LFVN) engages in the identification, research, development, formulation and sale of advanced nutrigenomic activators, dietary supplements, nootropics, pre- and probiotics, weight management and skin and hair care products. It offers Protandim, a dietary supplement; LifeVantage Omega+, a dietary supplement that combines DHA and EPA Omega-3 fatty acids, Omega-7 fatty acids, and vitamin D3; LifeVantage ProBio, a dietary supplement to support gut health; LifeVantage IC Bright, a supplement to support eye and brain health, reduce eye fatigue and strain, supports cognitive functions, and support normal sleep patterns; LifeVantage Daily Wellness, a dietary supplement designed to strengthen immune health; LifeVantage Rise AM & Reset PM System that provides the body with the right nutrients; LifeVantage D3+, a dietary supplement that provides vitamin D3, vitamin K2, magnesium, calcium, and other trace minerals to support a balanced immune system, strong bones and cardiovascular health; PhysIQ Fat Burn to support weight management; PhysIQ Prebiotic is a dietary supplement designed to support the good bacteria in the gut and a healthy microbiome; Petandim for Dogs, a supplement to combat oxidative stress in dogs; and Axio, a nootropic energy drink mix.
The company also provides anti-aging skincare products, including liquid collagen, facial cleansers, eye cream, moisturizing cream, sunscreen, perfecting lotions, hand creams, as well as hair care products, such as invigorating shampoos, nourishing conditioners, and scalp serums under the TrueScience brand name. It sells its products through its website and network of independent consultants in the United States, Mexico, Japan, Australia, Hong Kong, Canada, Thailand, the United Kingdom, the Netherlands, Germany, Taiwan, Austria, Spain, Ireland, Belgium, New Zealand, Singapore and the Philippines. The company also launched Evolve Compensation Plan and other LV360 initiatives into the Philippines, Taiwan, Hong Kong and Singapore. The company is based in Lehi, Utah.
In January 2026, LifeVantage’s stock price declined by approximately 14% compared to December 2025, extending the weakness observed toward the end of the prior year. For the first month of 2026, the shares recorded a 14% loss, reflecting continued investor caution toward small-cap direct selling and wellness companies. Since the establishment of the Direct Selling Capital Advisors Direct Selling Index (DSCI) on February 1, 2020, LFVN shares have declined by approximately 55.5%, underscoring prolonged underperformance relative to broader equity markets and highlighting the challenges facing the company’s equity story. Despite the recent pressure, LifeVantage continues to pay a dividend, which offers some support to income-focused investors amid ongoing share price volatility.
Operationally, LifeVantage entered 2026 amid a mixed business backdrop. Recent fiscal results indicate relatively stable revenue trends, with modest growth in certain international markets offset by softer performance in more mature regions. Profitability metrics remain under pressure as the company continues to invest in product innovation, digital infrastructure and global expansion initiatives. Management has emphasized its science-based differentiation, particularly in nutrigenomics and microbiome-focused offerings, as well as continued rollout of the Evolve Compensation Plan and broader LV360 initiatives aimed at improving distributor engagement and long-term productivity. Market sentiment toward LFVN remained cautious in January.
According to Yahoo Finance data, analyst coverage is limited, though available commentary generally points to the stock trading at discounted valuation multiples relative to earnings and cash flow. This perceived undervaluation is tempered by concerns surrounding revenue consistency, consultant recruitment and retention trends and execution risk associated with strategic initiatives. The January share price decline reflects ongoing skepticism among investors awaiting clearer evidence of sustained operational improvement and growth acceleration.
From an industry standpoint, Direct Selling News continues to emphasize structural shifts within the direct selling sector, including increased reliance on digital selling tools, enhanced compensation structures and a growing emphasis on clinically supported, science-driven wellness products.
LifeVantage’s focus on nutrigenomics, microbiome health and personalized wellness solutions aligns with these trends, though competitive intensity remains elevated across global markets.
Looking ahead, LifeVantage faces both opportunities and challenges as it moves through 2026. Potential catalysts include improved execution of compensation plan enhancements, deeper penetration in international markets and renewed momentum in high-margin wellness categories.
Key risks remain tied to continued stock price volatility, competitive pressures, distributor engagement dynamics and broader macroeconomic uncertainty affecting discretionary consumer spending. Overall, the company enters the new year in a rebuilding phase with strategic initiatives in place but investor confidence still dependent on tangible financial and operational progress.
Below are two summary diagrams on the direct selling small cap companies.


Short Interest Data & Analysis
The following chart is an aggregate index of “days to cover” among the entire tracking set. Days to cover (DTC) is a measurement determined by dividing the total outstanding short interest by average daily trading volume.

As indicated in the chart, short interest in DSCI stocks was 5.5 days as of January 15, 2026. Short interest can be a difficult indicator to analyze. On the one hand, an increase in short interest can be a bearish sign in that it indicates an increased view among investors that a stock is likely to decline based on any number of factors, such as a belief that the company’s fundamentals are deteriorating or that it has run too far, too fast. On the other hand, as a stock moves higher, a significant short interest can serve as extra fuel on the fire as investors scramble to “buy to cover” their short positions and mitigate losses.
Analyst Sentiment Index
The DSCA Analyst Sentiment Index is a consensus tracking tool that aggregates and averages the recommendations of all covering analysts across all public direct selling companies.

-
December 2025
Brought to you by Direct Selling Capital Advisors
Direct Selling Index mirrors the DJIA for the month of December 2025
The Direct Selling Capital Advisors Direct Selling Index (DSCI) increased by 0.7% in December 2025 compared to November, modestly underperforming the Dow Jones Industrial Average (DJIA), which gained 1.01% over the same period. Despite the slight monthly underperformance, direct selling equities generally moved in line with broader US equity markets during the month.
For the full year 2025, the DSCI delivered a total return of 13.0%, reflecting improved earnings visibility, selective balance sheet repair and recovering investor sentiment across several large-cap constituents. Since its inception on February 1, 2020, the index has generated a cumulative return of 89.2%, underscoring the long-term resilience and adaptability of the global direct selling channel across multiple economic and market cycles.
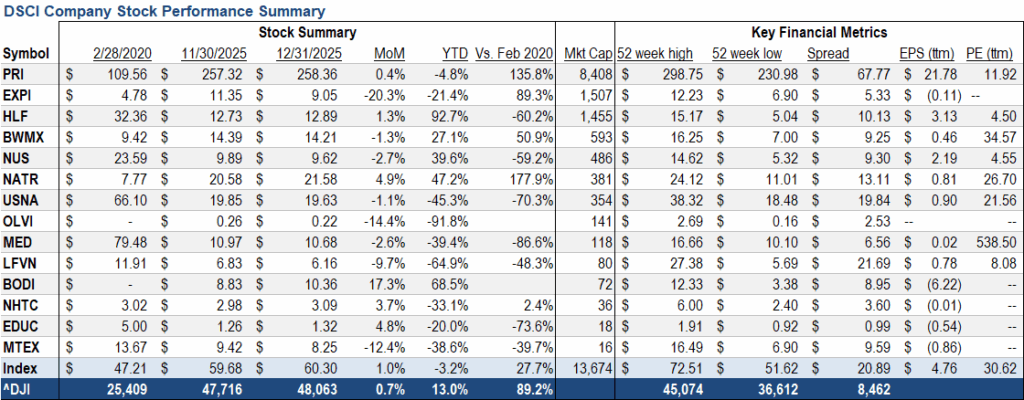
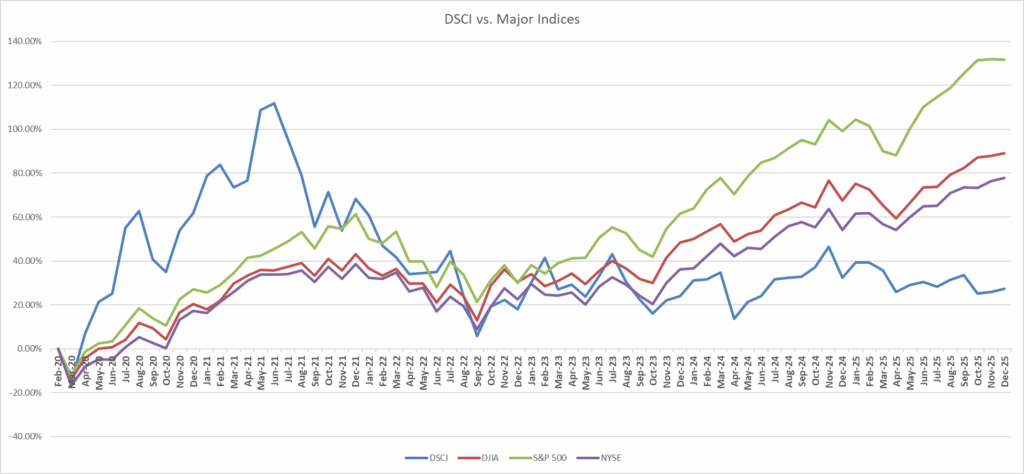
Market and Economic Environment
Global equity markets concluded 2025 amid mixed macroeconomic signals as growth momentum moderated toward year-end. US equity indices posted modest gains in December, supported by optimism surrounding potential Federal Reserve rate cuts in early 2026 and evidence of earnings resilience across select sectors. At the same time, markets continued to weigh persistent inflation risks and renewed tariff-related uncertainty that re-emerged during the second half of the year.
Consumer sentiment remained cautious. Labor market indicators pointed to softening conditions, with job openings and hiring activity plateauing in late 2025, while the unemployment rate remained above long-term averages. Although the Federal Reserve held policy rates steady throughout December, futures markets increasingly priced in rate cuts beginning in early 2026 in response to slowing payroll growth and moderating inflation pressures.
Fixed income markets reflected this cautious optimism, as longer-term Treasury yields declined from mid-year highs and corporate credit spreads remained relatively tight, signaling sustained investor confidence in corporate balance sheets.
Within equities, direct selling exposed stocks demonstrated relative stability compared with broader indices, though trading volumes were uneven due to year-end portfolio rebalancing. Notably, analyst sentiment toward several large-cap direct selling companies improved during the month, with Buy recommendations increasingly outweighing Hold ratings for select names, driven by improved earnings visibility, balance sheet repair and operational execution.
Direct Selling Industry Developments
Industry data continued to underscore the structural resilience of the direct selling model. According to the World Federation of Direct Selling Associations (WFDSA), global direct selling sales reached approximately $164 billion in 2024, reflecting modest growth across major regions and continued expansion of independent seller networks, particularly in emerging markets. Wellness, cosmetics and personal care remained the largest product categories, highlighting sustained consumer demand even amid tightening discretionary spending.
Among publicly traded companies, Herbalife Ltd. attracted renewed investor attention as its shares reached a 52-week high during December, supported by improving financial metrics and favorable analyst revisions. Betterware de Mexico also demonstrated strong operational momentum, reporting substantial EBITDA and adjusted net income growth earlier in the year, driven by cost discipline and geographic expansion initiatives.
Technology-driven partnerships continued to shape industry evolution. Digital enablement platforms, mobile engagement tools and data-driven field support solutions gained broader adoption, reinforcing the ongoing shift toward omnichannel and digitally integrated direct selling models.
Looking Forward — Strategic Outlook
Entering 2026, the direct selling sector faces a combination of structural resilience and elevated competitive and macroeconomic pressures. Key themes expected to shape near-term performance include:
- Digital and omnichannel integration: Companies that effectively integrate mobile ordering, social commerce, loyalty programs and data-driven distributor tools are likely to enhance retention, productivity and customer lifetime value.
- Macroeconomic sensitivity: Ongoing uncertainty around consumer confidence, labor market conditions, currency volatility and logistics costs may pressure discretionary categories, particularly for globally diversified operators.
- Earnings execution and investor sentiment: Improved analyst sentiment toward select direct selling equities reflects rising confidence in earnings catalysts, cost discipline and balance sheet improvements. Sustained execution will be critical to maintaining momentum.
- Regulatory vigilance: While no material regulatory changes emerged in December, evolving consumer protection frameworks and compliance requirements across key markets remain an ongoing consideration.
Large Cap
Note: For the purposes of this report, Direct Selling Capital considers companies with a market capitalization in excess of $1 billion “Large Cap.”
Founded in 1995, Betterware de Mexico (NASDAQ: BWMX) is the leading direct-to-consumer company in Mexico focused on innovative products related to household organization, practicality, space-saving and hygiene. Through the acquisition of JAFRA on April 7, 2022, the company expanded into the beauty market in Mexico and the US, offering fragrances, color cosmetics, skincare and toiletries. The combined business operates an asset-light model with low capital expenditure, consistent profitability, double-digit revenue growth and strong free cash flow generation. Today, Betterware distributes its products in both Mexico and the United States.
In December 2025, Betterware’s share price declined approximately 1.3% month-over-month, reflecting modest year-end volatility. For the full year, shares gained 27.1%, outperforming several broader market benchmarks. Since the inception of the DSCI in February 2020, BWMX has generated a total return of 50.9%, underscoring sustained long-term shareholder value creation.
Operational performance remained resilient during late 2025. Third-quarter results showed a 22% year-over-year increase in EBITDA and a 71% increase in adjusted net income, supported by effective cost management, pricing discipline and product mix optimization. Free cash flow improved by 32.6%, enabling the company to introduce a quarterly dividend and reinforce its shareholder return framework.
Despite softer consumer demand in Mexico, revenue trends remained stable, supported by contributions from both the Betterware and JAFRA segments. Expansion initiatives across Latin America, including progress toward a planned market entry into Colombia in early 2026, reflect management’s focus on geographic diversification and long-term growth.
Nu Skin Enterprises, Inc. (NYSE: NUS), together with its subsidiaries, engages in the development and distribution of various beauty and wellness products worldwide. It offers skin care devices, cosmetics and other personal care products, including ageLOC LumiSpa and ageLOC LumiSpa iO; and nutrition skincare products. The company also provides wellness products such as LifePak nutritional supplements, ageLOC TR90 weight management system and Beauty Focus Collagen+. In addition, it is involved in the research and product development of skincare products and nutritional supplements. The company sells its products under the Nu Skin, Pharmanex and ageLOC brands through retail stores, website, digital platforms and independent direct sellers and marketers as well as a service center. Nu Skin Enterprises, Inc. was founded in 1984 and is headquartered in Provo, Utah.
In December 2025, Nu Skin’s stock declined 2.7% month-over-month. For the full year, however, shares posted a strong rebound, gaining 39.6%. Despite this recovery, the stock remains approximately 59.2% below its level at the inception of the Direct Selling Capital Advisors Direct Selling Index (DSCI) in February 2020, highlighting the depth of the company’s multiyear operational and market challenges.
Momentum during 2025 was driven by a series of strategic and financial actions, including the divestiture of Mavely and continued debt reduction, which lowered total debt to approximately $209 million—the company’s lowest level in more than a decade. Nu Skin exited the year with a net cash positive position for the first time in four years, reflecting disciplined capital allocation and improving operating efficiency.
Operational execution also improved. Management undertook significant portfolio rationalization, reducing global SKU counts by more than 50% to simplify operations, improve inventory efficiency and support margin stability. Gross margin remained solid at 70.5%. Regionally, Latin America delivered strong growth, while North America and Mainland China remained challenged by macroeconomic pressures and shifting consumer behavior. In response, the company continued to emphasize social commerce initiatives and digital engagement tools to stabilize distributor activity and customer retention.
Governance remains an area of investor focus. Proxy advisory firms have identified opportunities to further enhance board structure and shareholder alignment. Management has acknowledged these considerations and continues to position governance improvements as part of its broader turnaround strategy. While risks remain elevated, Nu Skin’s balance sheet repair and operational simplification have improved the company’s strategic flexibility entering 2026.
Herbalife Ltd. (NYSE: HLF) (formerly Herbalife Nutrition, Inc.) provides health and wellness products across North America, Latin America, EMEA, China and the Asia Pacific. The company offers products in the areas of weight management; targeted nutrition; energy, sports and fitness; outer nutrition; and literature, promotional and other items. It also provides weight management products, including meal replacement products, protein shakes, drink mixes, weight loss supplements, healthy snacks and metabolism boosting teas; targeted nutrition products, which comprise functional beverages and dietary and nutritional supplements that contain herbs, vitamins, minerals and other natural ingredients; outer nutrition products, such as facial skin, body and hair care products; and energy, sports and fitness products, including N-R-G tea and energy drink products. In addition, it offers literature, promotional and other materials that comprise start-up kits, sales tools and educational materials. The company sells its products through sales representatives, independent service providers and company-operated retail stores and platforms. The company was formerly known as Herbalife Nutrition Ltd. and changed its name to Herbalife Ltd. in April 2023. Herbalife Ltd. was founded in 1980 and is headquartered in Los Angeles, California.
In December 2025, Herbalife’s stock increased 1.3% compared to November, capping a strong year with a 92.7% gain for 2025. Despite this significant recovery, shares remain approximately 60.2% below levels recorded at the inception of the Direct Selling Capital Advisors Direct Selling Index (DSCI) in February 2020, reflecting the magnitude of the company’s prior multiyear decline.
Investor sentiment during December continued to improve following third-quarter results that demonstrated early signs of stabilization. Net sales totaled $1.3 billion, representing a 2.7% year-over-year increase, driven in part by a modest return to growth in North America—the region’s first growth since 2021. Adjusted EBITDA of $163 million exceeded guidance expectations, and management emphasized ongoing balance sheet repair, including full repayment of the 2025 Notes and a reduction in total leverage to approximately 2.8x.
Strategic focus during the month centered on the company’s “Herbalife 2.0” transformation initiatives. These included continued integration of the Link BioSciences acquisition to support personalized nutrition offerings and expansion of the Pro2col AI-powered coaching application, which remains in beta testing. Management highlighted these initiatives at the BofA Securities Leveraged Finance Conference in early December, underscoring a shift toward technology-enabled engagement and data-driven distributor support.
Analyst activity increased during the period, with several firms initiating or updating coverage following improved earnings visibility and reduced financial leverage. Valuation remains compressed relative to historical averages, trading at approximately 4.5x earnings based on consensus estimates, reflecting continued investor caution despite improving fundamentals. While recent operational progress and balance sheet repair have attracted renewed interest, sustained revenue growth and consistent execution across regions will be necessary to support multiple expansion over the medium term.
Medifast, Inc. (NYSE: MED), through its subsidiaries, operates as a health and wellness company offering habit-based, coach-guided lifestyle solutions focused on weight management and obesity support in the United States. The company’s flagship brand, OPTAVIA, delivers clinically-supported weight loss programs, GLP-1 support plans, and a wide variety of food products, such as bars, shakes, soups, cereals, and snacks, complemented by one-on-one coaching, digital tools, and community support. Medifast was founded in 1980 and is headquartered in Baltimore, Maryland. Its products are sold via point-of-sale transactions and e-commerce.
In December 2025, Medifast shares declined 2.6% month-over-month. Year-to-date, the stock was down 39.4%, and cumulative losses since the inception of the DSCI reached 86.6%. This performance reflects sustained investor concern surrounding revenue contraction, declining coach engagement, and structural challenges within the weight management industry.
Throughout 2025, financial results remained under pressure. Quarterly revenues declined sharply year-over-year, driven by lower coach counts and reduced productivity per coach. While Medifast maintained a strong liquidity position and a debt-free balance sheet—providing operational runway—profitability remained constrained, with intermittent net losses reported. The company has suspended dividends in favor of reinvestment and strategic repositioning.
Operational initiatives have focused on cost optimization, digital platform enhancements, and program innovation. However, structural headwinds persist, including intense competition from pharmaceutical GLP-1 therapies, which continue to reshape consumer behavior and expectations within the weight loss category.
Market sentiment remains mixed. Institutional investors acknowledge the value of Medifast’s balance sheet strength and brand recognition, but analyst commentary remains cautious, emphasizing the need for revenue stabilization and renewed momentum within the coach network. Looking ahead, Medifast’s outlook depends on its ability to adapt its business model to evolving market dynamics, reinvigorate engagement, and differentiate its offering within an increasingly competitive landscape. As such, the stock continues to represent a higher-risk profile with potential long-term upside contingent on effective execution.
USANA Health Sciences, Inc. (NYSE: USNA) develops, manufactures and sells science-based nutritional, personal care and skincare products across Asia Pacific, the Americas and Europe. The company operates in two segments: Direct Selling and Direct-to-Consumer. Its product lineup includes USANA Nutritional Optimizers, including supplements for cardiovascular, skeletal/structural and digestive health; Essentials/CellSentials, including vitamin and mineral supplements for all ages starting from 13 months; and food products, such as meal replacement shakes, snack bars and other related products for healthy weight management, digestive health, =[energy and hydration. USANA also offers Celavive, a skincare regimen tailored for various skin types and ethnicities, and other products, including materials and online tools that support associates in building their business and marketing the company’s products. The company sells its products through retail, subscription-based models, direct selling, and online platforms. It maintains research collaboration agreements with the Beijing University of Chinese Medicine and the National Sports Training Bureau. USANA Health Sciences, Inc. was founded in 1992 and is headquartered in Salt Lake City, Utah.
For the month of December 2025, USANA’s stock performance remained weak amid continued investor caution toward the direct selling sector. The company’s shares declined 1.1% during the month, bringing the year-to-date loss to 45.3%. Since the establishment of the Direct Selling Capital Advisors Direct Selling Index (DSCI) in February 2020, USANA shares have fallen 70.3%, underscoring prolonged underperformance relative to both broader equity markets and direct selling peers.
Operationally, USANA ended the year facing persistent headwinds in its core direct selling business, particularly across key Asia-Pacific markets where distributor engagement and consumer demand remained pressured by cautious discretionary spending. While certain markets showed signs of stabilization, overall revenue momentum remained constrained, and profitability continued to fall short of expectations. Gross margins held relatively steady, supported by disciplined cost management and a debt-free balance sheet, but earnings growth remained elusive.
Offsetting some of this weakness, the Hiya direct-to-consumer segment continued to deliver double-digit growth, reinforcing management’s diversification strategy beyond the traditional MLM model. However, the segment has not yet reached sufficient scale to fully counterbalance softness in the direct selling channel. During December, product quality recognitions and third-party certifications strengthened USANA’s premium brand positioning and provided incremental support for associate-led marketing efforts.
Investor sentiment toward year-end remained cautious, with analysts highlighting revenue visibility challenges, distributor productivity declines and structural pressures within the global direct selling model. Leadership changes announced shortly after the close of the year were viewed as a potential step toward strategic recalibration, though they had no material impact on December trading.
Overall, December 2025 capped a difficult year for USANA Health Sciences, characterized by sharp share price declines, ongoing operational challenges in direct selling and incremental progress in its direct-to-consumer business. As the company enters 2026, restoring distributor momentum while scaling Hiya and converting operational discipline into consistent earnings growth will be critical to reversing the negative stock performance and rebuilding investor confidence.
eXp World Holdings, Inc. (NASDAQ: EXPI), together with its subsidiaries, provides cloud-based real estate brokerage services for residential homeowners and homebuyers. The company operates through three segments: North American Realty, International Realty and Other Affiliated Services. It acts as a licensed broker for processing residential and commercial real estate transactions and provides other real estate support services. In addition, the company offers FrameVR.io, a web-accessible proprietary technology providing immersive 3D platforms; SUCCESS magazine and its related media properties, which offer training, classes, resources and tools under the SUCCESS brand; and SUCCESS Space, a coworking solution that provides rental workspaces, professional development coaching, media production services, virtual-world communications technology and full-service cafes.
The company operates primarily in North America, Canada, the United Kingdom, Australia, South Africa, India, Mexico, Portugal, France, Brazil, Italy, Hong Kong, Colombia, Spain, Israel, Panama, Germany, the Dominican Republic, Greece, New Zealand, Chile, Poland, Dubai and recently expanded into Japan with additional international markets across Europe and Asia. eXp World Holdings, Inc. was formerly known as eXp Realty International Corporation and changed its name in May 2016. The company was incorporated in 2008 and is headquartered in Bellingham, Washington.
In December 2025, eXp World Holdings’ stock declined 20.3% compared to November, bringing the year-to-date decrease to 21.4%. The monthly decline reflected heightened market volatility, investor sensitivity to interest rate expectations, and continued pressure on housing-related equities. Despite recent weakness, long-term performance remains notable, with shares up approximately 89.3% since the launch of the DSCI in February 2020.
Operationally, the company maintained its focus on cost discipline, agent productivity and international expansion. Investments continued in virtual collaboration, training tools and technology infrastructure, while the SUCCESS brand was further developed to support diversified and recurring revenue streams. Management emphasized operational efficiency as a key priority amid ongoing uncertainty in global real estate transaction volumes.
Market sentiment softened during the month due to concerns surrounding housing affordability, interest rate sensitivity and near-term transaction activity. Analyst commentary continues to highlight the scalability of eXp’s cloud-based brokerage model and the long-term value of its agent incentive structure, while acknowledging elevated near-term macroeconomic risk.
Primerica, Inc. (NYSE: PRI), together with its subsidiaries, provides financial products and services to middle-income households in the United States and Canada. The company operates through three segments: Term Life Insurance; Investment and Savings Products; and Corporate and Other Distributed Products. The Term Life Insurance segment underwrites individual term life insurance products. The Investment and Savings Products segment offers mutual funds, various retirement plans, managed investments, variable and fixed annuities, fixed indexed annuities and segregated funds. The Corporate and Other Distributed Products segment provides mortgage loans; prepaid legal services assisting subscribers with matters such as drafting wills, living wills and powers of attorney; trial defense and motor vehicle-related matters; ID theft defense services; auto and homeowners’ insurance; home automation solutions; and supplemental, accidental death and disability insurance. The company distributes and sells its products through licensed sales representatives. Primerica, Inc. was founded in 1927 and is headquartered in Duluth, Georgia.
From a market performance perspective, Primerica’s stock showed modest stability in December, increasing 0.4% compared with November 2025. For the full year 2025, shares declined 4.8% year-to-date, reflecting broader market pressures on financial services and insurance stocks. Despite this short-term softness, the company’s long-term performance remains notably strong. Since the launch of the Direct Selling Capital Advisors Direct Selling Index (DSCI) on February 1, 2020, Primerica shares have appreciated 135.8%, making PRI the strongest long-term performer among index constituents and reinforcing its reputation as a resilient, fundamentally driven company within the direct selling sector.
Operationally, Primerica continues to benefit from the stability of its core Term Life Insurance business, which remains a primary earnings driver supported by disciplined underwriting and solid policy persistence. The Investment and Savings Products segment has experienced some moderation in asset-based revenues due to market volatility, but demand for long-term retirement and savings solutions continues to support client engagement. The company’s capital-light distribution model, combined with a stable and well-trained sales force, allows Primerica to maintain broad reach among middle-income consumers while carefully managing costs. Consistent cash flow generation has historically enabled the company to return value to shareholders through dividends and share repurchases, underscoring its shareholder-friendly capital allocation approach.
Market sentiment toward Primerica, as reflected in analyst commentary summarized by Yahoo Finance, remains generally constructive. The stock is often viewed as a defensive holding within the financial services space, supported by predictable insurance cash flows, a strong balance sheet and a proven operating model. While near-term upside expectations are moderated by interest rate uncertainty and equity market fluctuations, analyst confidence is largely anchored in Primerica’s long-term fundamentals, disciplined expense management and consistent value creation.
Within the broader industry context, Direct Selling News highlights a renewed focus on financial education, consumer protection, and stability across the direct selling sector. Companies with mature governance structures, diversified product offerings and recurring revenue models are increasingly favored over higher-risk growth profiles. Primerica is well positioned within this environment, though it continues to face risks related to market volatility, regulatory oversight and competition for qualified sales representatives. Looking ahead, opportunities center on deeper penetration of underserved middle-income households, expanded cross-selling across its product portfolio and continued investment in sales force development, all of which support a stable and sustainable long-term outlook.
Oliveda International, Inc. (OTC: OLVI) was founded in 2003 and has more than 20 years of experience in: 1) the management and organic certification of mountain olive trees; 2) the extraction of international award-winning extra virgin olive oils; 3) the extraction of hydroxytyrosol, a compound with antioxidant, anti-inflammatory and skin- and eye-protective effects; and 4) the production and distribution of cosmetic and holistic waterless products derived from the olive tree.
Oliveda International, Inc. and its subsidiaries, including Olive Tree People Inc., Olive Tree People Europe AG, Oliveda Deutschland GmbH, and Olive Tree Farmers SL, were founded by German real estate investor Thomas Lommel. The group has established a unique market position through innovations such as Olive Tree Therapy “10 years in 14 days,” olive matcha (made from ground olive leaves) and a coffee alternative based on olive leaves and hydroxytyrosol. Lommel is also active in the mindfulness sector with his olive tree sound bath meditations and the broadcast of olive tree frequencies globally.
In December 2025, Oliveda’s stock declined 14.4% month-over-month, contributing to a cumulative year-to-date decline of 91.8%. The sharp deterioration in share price reflects elevated volatility, limited liquidity, and heightened investor concerns related to execution risk, financial transparency and long-term scalability.
As an OTC-listed issuer, Oliveda operates with significantly reduced disclosure requirements compared to exchange-listed peers. The absence of consistent, detailed financial reporting limits visibility into revenue sustainability, profitability, and cash flow generation, materially constraining institutional participation and investor confidence. These factors have positioned the stock as highly speculative within the direct selling universe.
While the company continues to emphasize product innovation and distributor engagement within the broader wellness and sustainable personal care categories, market participants remain cautious. Without demonstrable improvements in financial transparency, operational consistency and distributor network stability, the company is likely to remain subject to elevated share price volatility and restricted access to capital markets.
Looking ahead, Oliveda’s long-term prospects hinge on its ability to improve disclosure practices, establish predictable operating performance and demonstrate sustained consumer demand for its differentiated offerings. Until such visibility improves, the stock is expected to remain suitable only for investors with a high tolerance for risk.
The Beachbody Company, Inc. (NYSE: BODI) operates as a fitness and nutrition company in the United States and internationally. The company offers Beachbody on Demand, a subscription streaming service providing fitness programs such as P90X, Insanity and 21 Day Fix; nutrition programs including Portion Fix and 2B Mindset; and nutritional products like Shakeology shakes and Beachbody Performance supplements. The company also faces legal challenges in California, where efforts are underway to reclassify independent consultants as employees, which may impact its direct selling model.
In December 2025, Beachbody’s stock price increased by approximately 17.3% compared to November, continuing a strong upward trend that resulted in a year-to-date gain of about 68.5% for the full twelve months of 2025. This performance reflects renewed investor confidence following improved operating results and visible progress toward profitability. Trading activity remained volatile, consistent with smaller-cap growth stocks, but technical indicators and recent price momentum supported a constructive near-term outlook.
Operationally, 2025 marked a turning point for the company. In the third quarter, Beachbody reported its first quarterly net profit as a public company, with positive net income and solid adjusted EBITDA, despite a year-over-year decline in revenue driven by its business model transition. Management has focused on cost discipline, organizational restructuring and channel diversification, while also introducing initiatives such as allowing customers to purchase individual digital programs outside of subscriptions. These moves are designed to increase flexibility, attract new users and stabilize long-term revenue performance.
Market sentiment toward Beachbody improved over the course of the year, supported by profitability milestones and increased engagement with the investment community. Analyst coverage remains limited but generally constructive, with cautious optimism reflecting both the company’s operational progress and ongoing risks. From an industry perspective, Beachbody continues to operate in a direct selling environment facing heightened regulatory and legal scrutiny, particularly in California, where efforts to reclassify independent consultants as employees could impact legacy compensation structures. Looking ahead, Beachbody’s key opportunities lie in leveraging its strong brand equity, expanding digital product offerings and sustaining profitability, while principal risks include revenue volatility, legal uncertainty related to worker classification, and broader market fluctuations.
Below are two summary diagrams on the direct selling large cap companies.
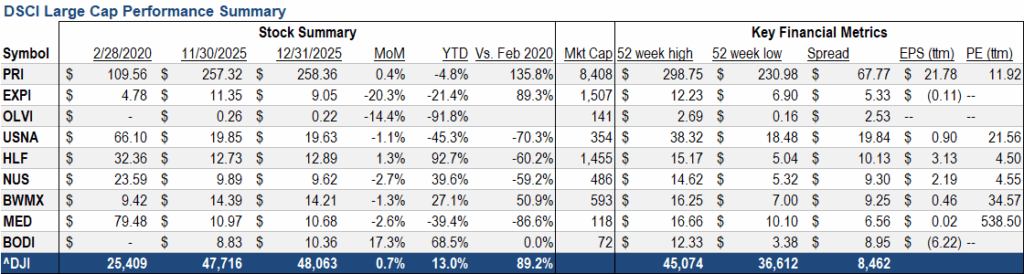
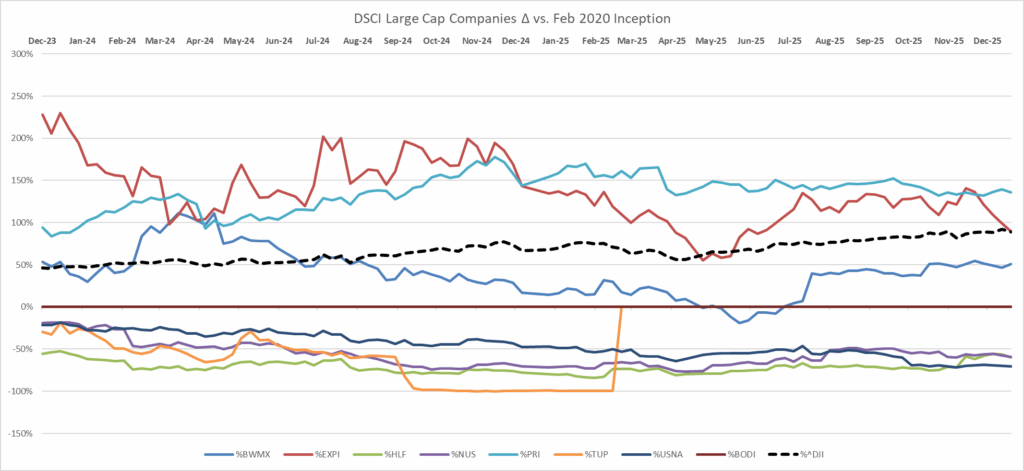
The Real Brokerage Inc. (NASDAQ: REAX) is a technology-driven, asset-light real estate brokerage that empowers agents through a cloud-based platform, AI-enabled tools and integrated fintech solutions. Founded in 2014, the company operates across the United States and Canada, utilizing an independent contractor model and performance-based compensation structure that aligns with direct selling adjacent distribution frameworks.
Entering December 2025, the stock continued to be viewed as a high-growth, technology-enabled brokerage model, albeit with increased sensitivity to broader equity market volatility and real estate transaction trends. Institutional ownership remained elevated at approximately 53%, reflecting continued confidence in the company’s balance sheet strength, capital allocation discipline and long-term growth strategy.
During the month, the company reported continued progress in agent recruitment and geographic expansion, onboarding several high-production teams across North America. The Real Brokerage surpassed 30,000 agents in December, reinforcing its position as one of the fastest-growing brokerages in the industry. Management continued to execute its “quality-at-scale” growth strategy, prioritizing agent productivity, retention and unit economics over headline expansion.
Technology investment remained a core strategic priority, with ongoing enhancements to the Leo CoPilot AI platform and consumer-facing digital tools designed to improve agent efficiency, transaction execution and client engagement. Financially, the company closed the year with strong revenue growth, a debt-free balance sheet and continued share repurchase activity, positioning it favorably relative to peers amid a challenging housing market environment.
Small Cap
Below is the December information for the two largest small cap companies, Nature’s Sunshine and LifeVantage.
Nature’s Sunshine Products, Inc. (NASDAQ: NATR), a natural health and wellness company, manufactures and sells nutritional and personal care products in Asia, Europe, North America, Latin America and internationally. The company provides general health products related to blood sugar support, bone health, cellular health, cognitive function, joint health, mood, sexual health, sleep, sports and energy and vision; immune products; cardiovascular products; and digestive products. It also offers personal care products, including oils and lotions, aloe vera gel, herbal shampoo, herbal skin treatment, toothpaste and skin cleanser products as well as weight management products. The company provides its products under the Nature’s Sunshine Products and Synergy WorldWide brands directly to customers and to a sales force of independent consultants. Nature’s Sunshine Products, Inc. was founded in 1972 and is headquartered in Lehi, Utah.
In December 2025, NATR’s share price increased by approximately 4.9% compared to November, extending a strong performance trend throughout the year. Over the first twelve months of 2025, the stock delivered a total return of 47.2%, significantly outperforming many peers in the health and wellness and direct selling sectors. Since the launch of the DSCI index, Nature’s Sunshine shares have gained 177.9%, highlighting sustained long-term value creation for investors. The company does not currently pay a dividend, instead prioritizing reinvestment in growth initiatives, operational improvements and balance sheet strength.
Operationally, Nature’s Sunshine entered the final months of 2025 with solid momentum. In its most recently reported quarter, the company delivered double-digit year-over-year revenue growth, supported by strong international demand and continued expansion of digital sales channels. Gross margins improved meaningfully, reflecting pricing discipline, product mix optimization and supply chain efficiencies, while adjusted EBITDA grew at a faster pace than revenue. Management raised full-year revenue and EBITDA guidance for 2025, signaling confidence in sustained demand, improving profitability, and the scalability of its business model. Ongoing investments in digital tools, customer engagement platforms and consultant support continued to drive higher retention and productivity across markets.
Market sentiment toward NATR remained generally positive at year-end. According to Yahoo Finance data, analyst coverage reflects a moderate buy consensus with expectations centered on continued margin expansion and steady top-line growth rather than short-term speculative upside. Valuation discussions among analysts point to the company trading at reasonable multiples relative to cash flow generation, particularly when viewed against its growth profile and balance sheet strength. Institutional ownership levels and relatively modest short interest further suggest stable investor confidence.
From an industry perspective, Direct Selling News continues to highlight key sector trends that align well with Nature’s Sunshine’s strategy. These include the shift toward omnichannel and digital-first selling models, increased consumer focus on preventive health and wellness and the importance of brand trust, product quality, and compliance in a highly competitive global environment. Companies that successfully integrate technology with relationship-based selling are gaining share, and Nature’s Sunshine’s ongoing digital transformation positions it favorably within this evolving landscape.
Looking ahead, Nature’s Sunshine is positioned for continued growth, supported by its diversified geographic footprint, broad product portfolio and expanding digital capabilities. Opportunities include further penetration in international markets, deeper utilization of subscription and auto-ship programs and continued margin improvement through operational discipline. Key risks remain tied to macroeconomic uncertainty, foreign exchange exposure, regulatory dynamics in direct selling and competitive pressures within the wellness category. Overall, the company enters the upcoming period with a solid strategic foundation, improving financial performance and a favorable standing within the global direct selling industry.
LifeVantage Corporation (NASDAQ: LFVN) engages in the identification, research, development, formulation and sale of advanced nutrigenomic activators, dietary supplements, nootropics, pre- and probiotics, weight management and skin and hair care products. It offers Protandim, a dietary supplement; LifeVantage Omega+, a dietary supplement that combines DHA and EPA Omega-3 fatty acids, Omega-7 fatty acids and vitamin D3; LifeVantage ProBio, a dietary supplement to support gut health; LifeVantage IC Bright, a supplement to support eye and brain health, reduce eye fatigue and strain, support cognitive functions and normal sleep patterns; LifeVantage Daily Wellness, a dietary supplement designed to strengthen immune health; LifeVantage Rise AM & Reset PM System that provides the body with the right nutrients; LifeVantage D3+, a dietary supplement that provides vitamin D3, vitamin K2, magnesium, calcium and other trace minerals to support a balanced immune system, strong bones and cardiovascular health; PhysIQ Fat Burn to support weight management; PhysIQ Prebiotic is a dietary supplement designed to support the good bacteria in the gut and a healthy microbiome; Petandim for Dogs, a supplement to combat oxidative stress in dogs; and Axio, a nootropic energy drink mix. The company also provides anti-aging skincare products, including liquid collagen, facial cleansers, eye cream, moisturizing cream, sunscreen, perfecting lotions, hand creams as well as hair care products, such as invigorating shampoos, nourishing conditioners and scalp serums under the TrueScience brand name. It sells its products through its website and network of independent consultants in the United States, Mexico, Japan, Australia, Hong Kong, Canada, Thailand, the United Kingdom, the Netherlands, Germany, Taiwan, Austria, Spain, Ireland, Belgium, New Zealand, Singapore and the Philippines. The company also launched Evolve Compensation Plan and other LV360 initiatives into the Philippines, Taiwan, Hong Kong and Singapore. The company is based in Lehi, Utah.
In December, LifeVantage’s stock declined 9.7% compared to November 2025, contributing to a cumulative year-to-date loss of approximately 64.9%, highlighting continued volatility and investor caution toward the shares. Since the establishment of the Direct Selling Capital Advisors Direct Selling Index (DSCI) on February 1, 2020, LFVN stock has declined roughly 48.3%, reflecting broader pressure on small-cap direct selling and wellness companies amid shifting consumer demand and capital market conditions. Despite these declines, the company continues to trade at valuation multiples below broader market averages and maintains a dividend, which provides some support for income-oriented investors.
Operationally and financially, LifeVantage has shown mixed performance. Recent fiscal results indicate relatively stable revenue levels with modest year-over-year growth, while profitability metrics such as EBITDA have faced pressure due to higher operating costs, investments in international expansion and integration efforts related to strategic initiatives. The company has emphasized product innovation, science-backed wellness positioning and expansion into microbiome health as key growth drivers. Its acquisition activity and product development efforts are aligned with consumer trends favoring immune health, gut health, cognitive support, and personalized wellness solutions.
Market sentiment toward LifeVantage remains cautious but not uniformly negative. Analyst coverage is limited, though available assessments generally characterize the stock as undervalued relative to its earnings and cash flow potential, offset by concerns about revenue consistency, distributor engagement trends and execution risk. Investor confidence has been influenced by recent share price weakness, leadership transitions and the need for sustained growth in active consultants, particularly in mature markets.
From an industry perspective, Direct Selling News highlights continued transformation within the direct selling sector, with companies increasingly focused on digital tools, enhanced compensation structures and science-driven product differentiation to attract and retain distributors.
LifeVantage’s emphasis on nutrigenomics, microbiome health and global compensation plan enhancements positions it to benefit from these trends, although competition remains intense. Looking ahead, opportunities include leveraging international markets, expanding high-margin wellness categories and improving consultant productivity, while key risks include ongoing stock volatility, competitive pressures, execution challenges and broader macroeconomic uncertainty affecting discretionary consumer spending.
Below are two summary diagrams on the direct selling small cap companies.
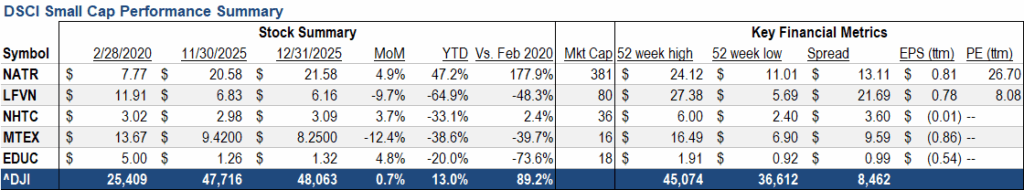

Short Interest Data & Analysis
The following chart is an aggregate index of “days to cover” among the entire tracking set. Days to cover (DTC) is a measurement determined by dividing the total outstanding short interest by average daily trading volume.
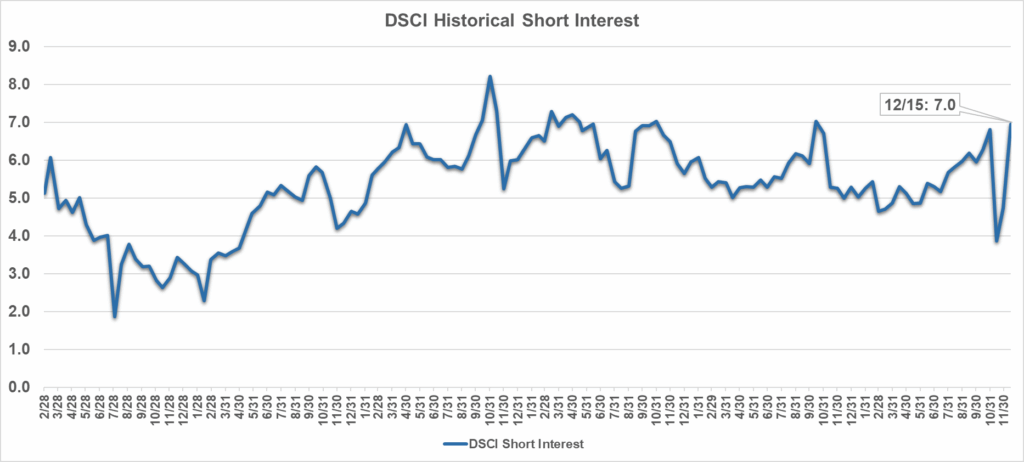
As indicated in the chart, short interest in DSCI stocks was 7.0 days as of December 14, 2025. Short interest can be a difficult indicator to analyze. On the one hand, an increase in short interest can be a bearish sign in that it indicates an increased view among investors that a stock is likely to decline based on any number of factors, such as a belief that the company’s fundamentals are deteriorating or that it has run too far, too fast. On the other hand, as a stock moves higher, a significant short interest can serve as extra fuel on the fire as investors scramble to “buy to cover” their short positions and mitigate losses.
Analyst Sentiment Index
The DSCA Analyst Sentiment Index is a consensus tracking tool that aggregates and averages the recommendations of all covering analysts across all public direct selling companies.

-
November 2025
Brought to you by Direct Selling Capital Advisors
Direct Selling Index mirrors the DJIA for the month of November 2025
The Direct Selling Capital Advisors Direct Selling Index (DSCI) rose by 0.3% in November compared to October 2025. The DJIA rose by about 0.04% over the same period. During the first eleven months of 2025, the DSCI has gained 12.2%. Since its inception, the index has delivered a total return of 87.8%, underscoring the sustained strength and resilience of the direct selling channel over time.

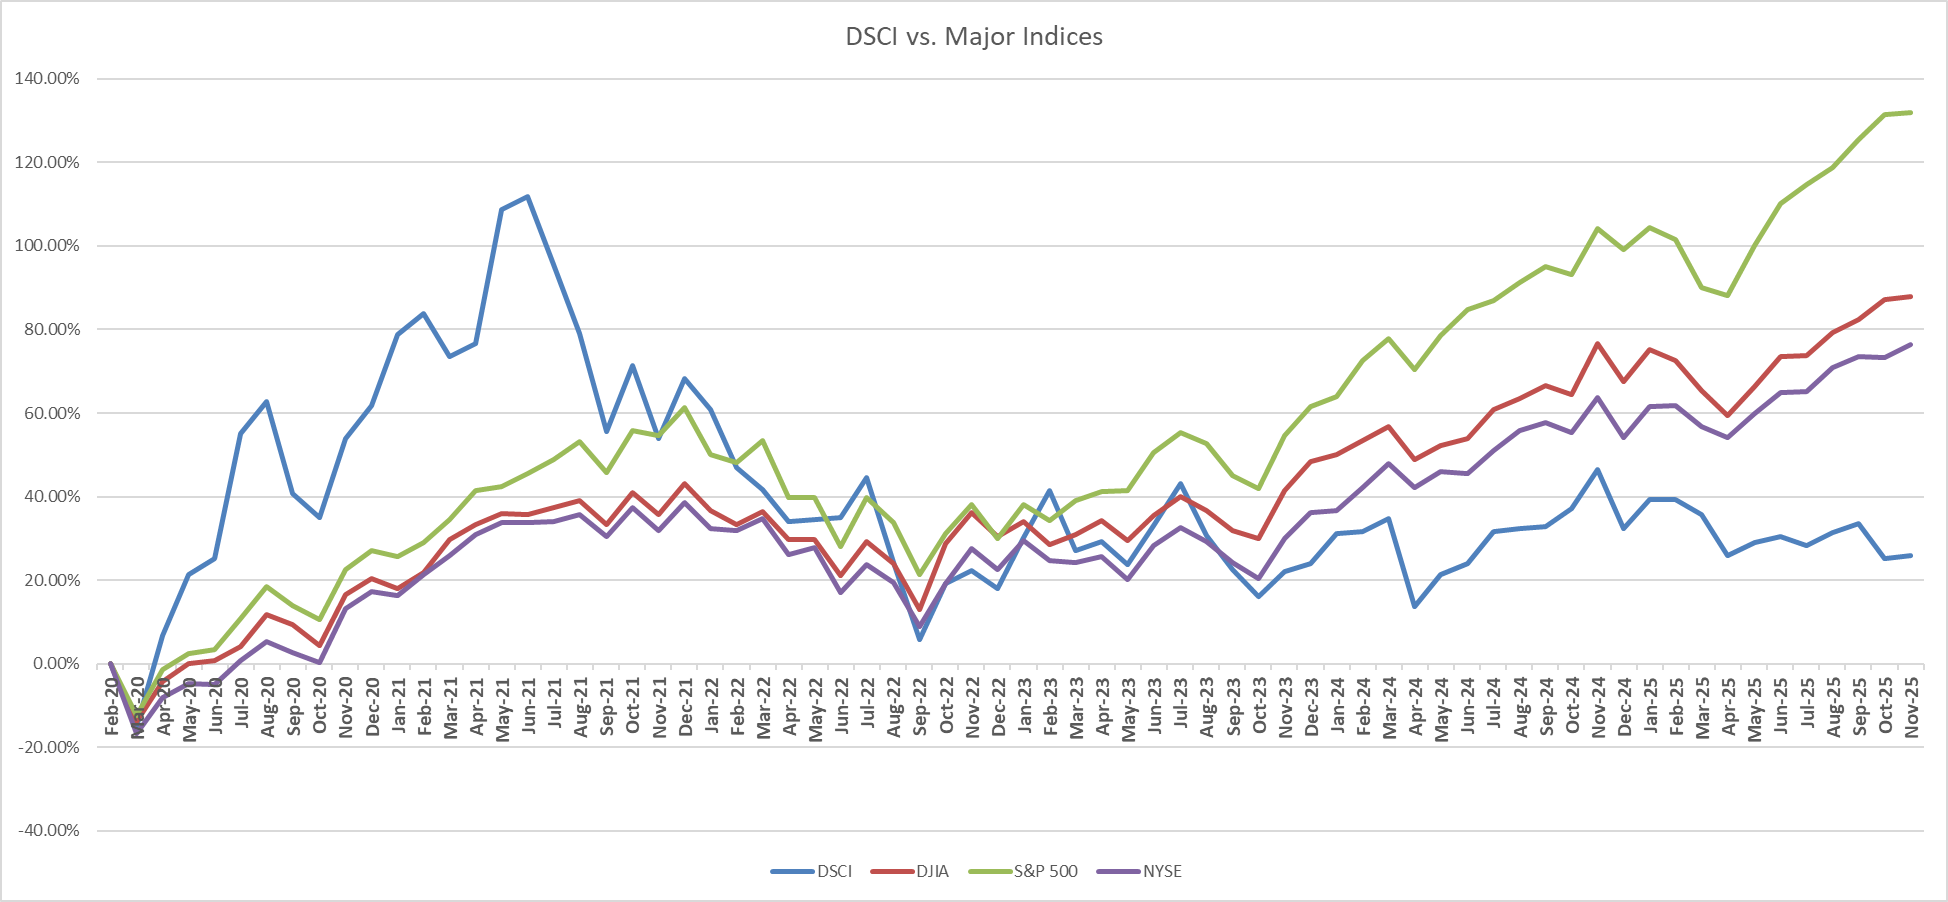
Positive Developments
- While full November disclosures are still limited, companies with global footprint and digital‑enabled distributor networks continue to show stability, suggesting that the favorable structural trends noted in October remain relevant.
- Many firms persist in refining compensation plans and distributor‑engagement strategies—leveraging online tools, social channels and digital order systems—which likely contributes to maintaining sales and distributor motivation even amid market headwinds.
- Industry‑wide emphasis on branding, distributor loyalty and innovative distributor programs remains a differentiator; companies investing in brand recognition and distributor support are better positioned for long-term sustainability.
Challenges & Caution Areas
- Regional performance remains uneven: despite growth in certain high‑potential geographies, other regions continue to show flat or minimal gains. Given the limited number of public reports for November, it remains difficult to generalize performance across the sector.
- Persistent macroeconomic and structural pressures—such as economic uncertainty, currency fluctuations, inflation, logistics and distribution costs—continue to pose headwinds, especially for firms balancing traditional distributor networks with emerging digital‑to‑consumer models.
- The scarcity of transparent, timely monthly disclosures constrains ability to conduct a comprehensive, sector‑wide analysis. This opacity may conceal underperforming segments or emerging risks.
Strategic Implications / Outlook
- Firms integrating an omnichannel approach—combining traditional distributor networks, digital direct‑to‑consumer sales and online ordering systems—appear better equipped to weather volatility and outperform peers.
- Prioritizing operational efficiency, supply‑chain optimization and cost management remains critical, especially in regions exhibiting strong growth potential.
- Ongoing investment in distributor engagement, training, incentives and support infrastructure will likely be key to retaining active networks and sustaining sales momentum.
- Although no major regulatory shifts were announced in November, companies should maintain vigilance on legal and regulatory environments across all markets, particularly in regions with evolving policies affecting direct selling operations.
Summary
In November 2025, the direct‑selling sector demonstrated modest but positive performance: the DSCI rose modestly and continued to outpace (or at least match) broader market dynamics captured by DJIA. Companies with robust global presence and digitally‑enabled distributor strategies remain in a favorable position. Nevertheless, uneven regional results, limited public disclosures and macroeconomic uncertainties highlight the need for cautious optimism. Going forward, firms that successfully execute on omnichannel integration, operational efficiency and distributor engagement are best positioned to sustain long-term growth and stability in the direct‑selling channel.
Large Cap
Note: For the purposes of this report, Direct Selling Capital considers companies with a market capitalization in excess of $1 billion “Large Cap.”
Betterware de Mexico (NASDAQ: BWMX), founded in 1995, is the leading direct-to-consumer company in Mexico focused on innovative products related to household organization, practicality, space-saving and hygiene. Through the acquisition of JAFRA on April 7, 2022, the company expanded into the beauty market in Mexico and the US, offering fragrances, color cosmetics, skincare and toiletries. The combined business operates an asset-light model with low capital expenditure, consistent profitability, double-digit revenue growth and strong free cash flow generation. Today, Betterware distributes its products in both Mexico and the United States.
In November 2025, Betterware’s stock price declined by 0.6% compared to October. Year-to-date, the stock recorded a positive performance of 28.7%. Since the establishment of the DSCI on February 1, 2020, BWMX has grown by 52.8%.
For Q3 2025, the company’s consolidated results remained consistent with prior trends, reflecting the ongoing integration of JAFRA. Betterware Mexico continued to experience moderate revenue softness due to cautious consumer spending, while JAFRA Mexico maintained strong growth momentum, with year-over-year revenue gains of approximately 31%, supported by ongoing brand revitalization, optimized salesforce productivity and targeted pricing strategies.
During November, Betterware declared a quarterly dividend of US $0.29 per share, payable on November 20, 2025. The dividend reflects the company’s commitment to returning value to shareholders and maintaining financial discipline, even amid short-term stock price fluctuations.
The company’s transformation strategy continues to advance post-JAFRA acquisition, with disciplined cost management and robust free-cash-flow conversion helping support investor confidence. International expansion efforts gained further traction in emerging markets such as Ecuador and Guatemala. Management reaffirmed its long-term strategic priorities, focusing on international growth, product portfolio optimization and sustained profitability to drive long-term shareholder value.
Nu Skin Enterprises, Inc. (NYSE: NUS), together with its subsidiaries, engages in the development and distribution of various beauty and wellness products worldwide. It offers skin care devices, cosmetics and other personal care products, including ageLOC LumiSpa and ageLOC LumiSpa iO; and nutrition skincare products. The company also provides wellness products, such as LifePak nutritional supplements, ageLOC TR90 weight management system and Beauty Focus Collagen+. In addition, it is involved in the research and product development of skincare products and nutritional supplements. The company sells its products under the Nu Skin, Pharmanex, and ageLOC brands through retail stores, website, digital platforms and independent direct sellers and marketers, as well as a service center. Nu Skin Enterprises, Inc. was founded in 1984 and is headquartered in Provo, Utah.
In November 2025, Nu Skin’s stock declined by 7.7% compared to October, bringing year-to-date performance to 43.5%. Since the launch of the DSCI in February 2020, the shares have declined 58.1%. The stock traded in a 52-week range of $5.32–$14.62, reflecting continued volatility.
Operationally, Q3 2025 results shaped the November market sentiment. The company reported revenue of $364.2 million, down 15.3% year-over-year, or 11.5% excluding divested businesses. Earnings per share were $0.34, up from $0.17 in the prior year, demonstrating improved profitability despite top-line pressure. Gross margins remained strong at 70.5%, and the company reduced long-term debt to $209 million while increasing cash and cash equivalents to $251.8 million. The board declared a quarterly dividend of $0.06 per share, payable in December 2025.
Nu Skin continues to face headwinds in its direct-selling network, with declines in customers (~10%), paid affiliates (~13%), and sales leaders (~19%) compared to the prior-year quarter. Nevertheless, the Latin America region maintained strong growth, and certain operational segments showed sequential improvement. Management is preparing for the rollout of its intelligent wellness device, Prysm iO, along with a pre-market entry into India in Q4 2025, as part of its strategic focus on device-plus-consumable and subscription-based recurring revenue.
Despite the revenue challenges, improved profitability, margin stability, debt reduction and ongoing strategic initiatives were positive signs for the company’s medium-term outlook. Investor sentiment, however, was cautious, resulting in the stock decline in November.
In summary, November was a mixed month: Nu Skin faced continued pressure on revenue and network metrics, yet achieved higher profitability, strengthened its balance sheet and maintained dividend payouts. Strategic initiatives such as the Prysm iO device rollout, expansion into high-growth markets and a focus on subscription and recurring revenue position the company for potential stabilization and gradual recovery, although near-term volatility is likely to persist.
Herbalife Ltd. (NYSE: HLF), (formerly Herbalife Nutrition, Inc.) provides health and wellness products across North America, Latin America, EMEA, China and the Asia Pacific. The company offers products in the areas of weight management; targeted nutrition; energy, sports and fitness; outer nutrition; and literature, promotional and other items. It also provides weight management products, including meal replacement products, protein shakes, drink mixes, weight loss supplements, healthy snacks and metabolism boosting teas; targeted nutrition products, which comprise functional beverages and dietary and nutritional supplements that contain herbs, vitamins, minerals and other natural ingredients; outer nutrition products, such as facial skin, body and hair care products; and energy, sports and fitness products, including N-R-G tea and energy drink products. In addition, it offers literature, promotional and other materials that comprise start-up kits, sales tools and educational materials. The company sells its products through sales representatives, independent service providers and company-operated retail stores and platforms. The company was formerly known as Herbalife Nutrition Ltd. and changed its name to Herbalife Ltd. in April 2023. Herbalife Ltd. was founded in 1980 and is headquartered in Los Angeles, California.In November 2025, Herbalife’s stock rose 59.1% compared to October, extending year-to-date gains to 90.3%. Since the creation of the DSCI in February 2020, shares remain down approximately 60.7%.
On November 5, 2025, Herbalife reported its Q3 2025 financial results, showing net sales of $1.30 billion, a 2.7% increase year-over-year and up 3.2% on a constant-currency basis. North America returned to growth with net sales up 1.0% YoY, marking its first quarterly gain in the region since Q2 2021. Adjusted EBITDA was $163.0 million, exceeding guidance, while adjusted diluted EPS came in at $0.50, above consensus estimates. Operating cash flow for the quarter was $138.8 million, with capital expenditures of $20.8 million, and the company repaid the remaining principal on its 2025 Senior Notes, reducing its leverage ratio to approximately 2.8×.
Strategically, Herbalife expanded access to the beta version of its digital platform Pro2col™, aimed at enhancing distributor operations and customer engagement, with a full US rollout planned by the end of 2025 and global expansion in 2026. Management noted that the third-quarter performance reflects continued progress in the company’s transformation strategy, disciplined financial execution and ongoing operational improvements. For Q4 2025, the company issued guidance for net sales growth of 1.5% to 5.5% YoY, while full-year 2025 net sales are expected to increase 0.3% to 0.7% YoY, reflecting cautious optimism as Herbalife continues to stabilize and improve regional performance, profitability and digital capabilities.
Medifast, Inc. (NYSE: MED), through its subsidiaries, operates as a health and wellness company offering habit-based, coach-guided lifestyle solutions focused on weight management and obesity support in the United States. The company’s flagship brand, OPTAVIA, delivers clinically supported weight loss programs, GLP-1 support plans and a wide variety of food products, such as bars, shakes, soups, cereals and snacks, complemented by one-on-one coaching, digital tools and community support. Medifast was founded in 1980 and is headquartered in Baltimore, Maryland. Its products are sold via point-of-sale transactions and ecommerce.
In November 2025, Medifast shares declined by 8.7% compared to October. Year-to-date, the stock remains down 37.7%, and since the DSCI’s inception it has lost 86.2%.
In Q3 2025, revenue was $89.4 million, down 36.2% from Q3 2024. The company recorded a net loss of $2.3 million, or $0.21 per diluted share. Gross profit fell to $62.2 million with a 69.5% gross margin. Active earning OPTAVIA coaches decreased 35% to 19,500. SG&A expenses fell due to lower coach compensation, marketing and convention costs. The company ended the quarter with $173.5 million in cash and investments and no debt.
In late October and November, Medifast announced a strategic pivot toward metabolic health, introducing the Metabolic Synchronization program and presenting new clinical research at the ObesityWeek Conference. The company plans to launch a next-generation product line in 2026 to support metabolic health.
Despite continued revenue decline and loss of coaches, the strong balance sheet and strategic shift toward metabolic health provide a potential path for repositioning in a broader wellness market. For Q4 2025, revenue is projected at $65–80 million with EPS between –$0.70 and –$1.25.
USANA Health Sciences, Inc. (NYSE: USNA) develops, manufactures and sells science-based nutritional, personal care and skincare products across the Asia Pacific, the Americas and Europe. The company operates in two segments: Direct Selling and Direct-to-Consumer. Its product lineup includes USANA Nutritional Optimizers, including supplements for cardiovascular, skeletal/structural and digestive health; Essentials/CellSentials, including vitamin and mineral supplements for all ages starting from 13 months; and food products, such as meal replacement shakes, snack bars and other related products for healthy weight management, digestive health and energy and hydration. USANA also offers Celavive, a skincare regimen tailored for various skin types and ethnicities and other products, including materials and online tools that support associates in building their business and marketing the company’s products. The company sells its products through retail, subscription-based models, direct selling and online platforms. It maintains research collaboration agreements with the Beijing University of Chinese Medicine and the National Sports Training Bureau. USANA Health Sciences, Inc. was founded in 1992 and is headquartered in Salt Lake City, Utah.
In November 2025, USANA’s stock declined by 6.1% from October, partly recovering from earlier weakness. Year-to-date, shares are down 44.7%, and since the DSCI’s inception, they have fallen 70.0%.
For the month of November 2025, USANA’s stock declined by 6.1% compared to October, marking a smaller downturn than in the prior month and showing partial stabilization after significant earlier volatility. Year-to-date, the shares have fallen 44.7%, reflecting one of the most challenging years for the company in recent history. Since the inception of the Direct Selling Capital Advisors Index (DSCI), USANA’s share price remains down 70.0%, highlighting the long-term pressure the stock has faced.
November trading continued to reflect the market’s reaction to the company’s third-quarter results, released in late October. USANA reported Q3 2025 net sales of $214 million, representing 7% year-over-year growth, supported in part by the Hiya subscription channel. However, the company posted a net loss of $6.5 million, with adjusted EBITDA falling sharply due to increased operating costs, restructuring expenses and margin pressure. Active direct-selling customer counts declined meaningfully, while Hiya maintained steady subscriber engagement. The rollout of the new global Brand Partner compensation plan continued to create short-term disruption, as partners adjusted to new incentives and updated operational structures.
During November, USANA also received positive product related news: its MagneCal D supplement earned a recognized third-party quality certification, reinforcing the company’s longstanding focus on product safety, purity and scientific validation. Leadership communications throughout the month emphasized renewed engagement with Brand Partners and the importance of rebuilding trust, training and sales productivity within the field organization.
Overall, November reflected a period of modest decline and relative stabilization. While the company maintains a strong balance sheet with substantial cash and no debt, operational headwinds persist. USANA’s near-term performance will depend on how quickly Brand Partner productivity recovers under the new compensation plan and how effectively the company balances cost structure, margin improvement and growth in its direct-to-consumer business.
eXp World Holdings, Inc. (NASDAQ: EXPI), together with its subsidiaries, provides cloud-based real estate brokerage services for residential homeowners and homebuyers. The company operates through three segments: North American Realty, International Realty and Other Affiliated Services. It acts as a licensed broker for processing residential and commercial real estate transactions and provides other real estate support services. In addition, the company offers FrameVR.io, a web-accessible proprietary technology providing immersive 3D platforms; SUCCESS magazine and its related media properties, which offer training, classes, resources and tools under the SUCCESS brand; and SUCCESS Space, a coworking solution that provides rental workspaces, professional development coaching, media production services, virtual-world communications technology and full-service cafes.
The company operates primarily in North America, Canada, the United Kingdom, Australia, South Africa, India, Mexico, Portugal, France, Brazil, Italy, Hong Kong, Colombia, Spain, Israel, Panama, Germany, the Dominican Republic, Greece, New Zealand, Chile, Poland, Dubai and recently expanded into Japan, with additional international markets across Europe and Asia. eXp World Holdings, Inc. was formerly known as eXp Realty International Corporation and changed its name in May 2016. The company was incorporated in 2008 and is headquartered in Bellingham, Washington.
In November 2025, EXPI’s stock price increased by 10.8% compared to October, marking a solid rebound after earlier weakness. This improvement reduced the year-to-date decline to just 1.4%, positioning eXp as one of the more resilient performers in the real estate sector during 2025. Since the launch of the DSCI on February 1, 2020, the company’s shares have appreciated by 137.4%, reinforcing its strong long-term performance and continued investor confidence in its cloud-based model.
November’s trading performance was influenced by the company’s Q3 2025 financial results, which were released in early November. Revenue grew 7% year-over-year to $1.317 billion, driven by higher real estate sales volume of $54.1 billion, also up 7%. eXp reported net income of $3.5 million (EPS $0.02) and adjusted EBITDA of $17.7 million, with $28.9 million in net cash provided by operating activities. Although the global agent and broker count declined by 2% to approximately 83,446, productivity remained strong: real estate transactions increased 3% to 121,516, demonstrating efficiency gains despite a smaller agent base.
Throughout November, the company’s strategic focus remained centered on platform enhancements, agent training and continued investment in AI-driven technology. Management emphasized strengthening the value proposition for active agents, improving retention of top performers and accelerating global expansion efforts. Industry commentary highlighted that eXp’s cloud-based infrastructure continues to offer scalability advantages and operational flexibility, supporting the company’s ability to navigate shifting real estate market conditions.
Overall, November represented a constructive month for eXp. The strong stock recovery, combined with steady operational performance and growing sales activity, signaled renewed market confidence. While the company still faces near-term pressure from agent turnover and real estate market volatility, its technology-driven model, international reach and consistent execution position it favorably for potential growth as market conditions stabilize heading into late 2025.
Primerica, Inc. (NYSE: PRI), together with its subsidiaries, provides financial products and services to middle-income households in the United States and Canada. The company operates through three segments: Term Life Insurance; Investment and Savings Products; and Corporate and Other Distributed Products. The Term Life Insurance segment underwrites individual term life insurance products. The Investment and Savings Products segment offers mutual funds, various retirement plans, managed investments, variable and fixed annuities, fixed indexed annuities and segregated funds. The Corporate and Other Distributed Products segment provides mortgage loans; prepaid legal services assisting subscribers with matters such as drafting wills, living wills and powers of attorney; trial defense and motor vehicle-related matters; ID theft defense services; auto and homeowners’ insurance; home automation solutions; and supplemental, accidental death and disability insurance. The company distributes and sells its products through licensed sales representatives. Primerica, Inc. was founded in 1927 and is headquartered in Duluth, Georgia.In November, the stock price declined by 1.0% vs. October 2025. For the first eleven months of 2025, the stock has declined 5.2% year-to-date. Since the inception of the DSCI on February 1, 2020, PRI has appreciated 134.9%, remaining the strongest long-term performer among index constituents.
Primerica shares moved modestly lower in November as investors evaluated the company’s third-quarter 2025 earnings results and subsequent capital allocation announcements. The third-quarter report highlighted record Investment & Savings Products (ISP) sales, strong client asset growth, and continued focus on expanding and supporting the life-licensed representative force. Management emphasized solid cash generation and robust capital positioning.
In mid-November, the company announced two notable capital-return actions:
- A quarterly dividend declaration payable in mid-December.
- A $475 million share repurchase authorization extending through the end of 2026.
These actions signal management’s confidence in long-term business fundamentals and its commitment to delivering shareholder returns.
During the month, Primerica also released updated consumer insights based on its Financial Security Monitor and Household Budget Index™, noting that middle-income households continue to experience financial strain from elevated living costs. Families reported relying more heavily on savings, credit and reduced retirement contributions, underscoring ongoing economic pressures. Although this environment challenges consumers, it also reinforces demand for Primerica’s financial guidance and protection-oriented products.Analyst and industry commentary in November focused on several themes:
- Strong ISP performance, with record quarterly sales and growing client asset balances.
- Shareholder returns, driven by the new buyback authorization and ongoing dividends.
- Field force dynamics, as industry outlets noted Primerica’s steady position within the direct-selling financial services sector.
Insider and ownership activity, with some outlets noting recent insider selling but maintaining positive long-term assessments of company execution.
Management reiterated its priorities of expanding and improving the productivity of its licensed representative network, increasing ISP sales and maintaining disciplined underwriting and capital management. The company continues to benefit from a diversified revenue base across term life insurance and investment and savings products, supported by a stable middle-income client base.The modest 1.0% decline in November occurred against a backdrop of otherwise strong operational results and significant capital-return initiatives. While macroeconomic pressures remain a factor for Primerica’s core customers, the company’s long-term performance, disciplined financial management and resilient distribution model continue to position it as one of the strongest performers within the DSCI.
Oliveda International, Inc. (OTC: OLVI) was founded in 2003 and has more than 20 years of experience in: 1) the management and organic certification of mountain olive trees; 2) the extraction of international award-winning extra virgin olive oils; 3) the extraction of hydroxytyrosol, a compound with antioxidant, anti-inflammatory, and skin- and eye-protective effects; and 4) the production and distribution of cosmetic and holistic waterless products derived from the olive tree.
Oliveda International, Inc. and its subsidiaries, including Olive Tree People Inc., Olive Tree People Europe AG, Oliveda Deutschland GmbH and Olive Tree Farmers SL, were founded by German real estate investor Thomas Lommel. The group has established a unique market position through innovations such as Olive Tree Therapy “10 years in 14 days,” olive matcha (made from ground olive leaves) and a coffee alternative based on olive leaves and hydroxytyrosol. Lommel is also active in the mindfulness sector with his olive tree sound bath meditations and the broadcast of olive tree frequencies globally.
Comparing November 2025 to October 2025, the stock price increased by 7.1%. For the first eleven months of 2025, the stock declined by 90.4%.
In November, Oliveda International launched its first hydroxytyrosol-based pet brand, Is that Matty, marking a strategic expansion beyond human cosmetics and wellness. This launch follows a strong 2025 growth cycle with Olive Tree People reporting over US $104.5 million in net revenues during its second year in the US.
The company continued its expansion in Europe through the direct-to-consumer (D2C) model via Olive Tree People Europe AG, following its US and Canada operations. Additional waterless and hydroxytyrosol-based products remain in development, diversifying the portfolio beyond skincare and makeup. Operationally, Oliveda advanced its vertical integration strategy, including construction of a new olive mill in partnership with the municipality of Arroyomolinos de León, to ensure supply stability for global operations.
While these initiatives position Oliveda for global growth, execution risks remain in new markets. The 90% decline in stock value over 11 months reflects market skepticism about the scalability and sustainability of the direct-selling model amid volatility and low trading volume.
CEO Thomas Lommel emphasized that despite market volatility, Oliveda remains committed to innovation, sustainability, and its mission to redefine beauty and wellness through the power of the olive tree.
The Beachbody Company, Inc. (NYSE: BODI) operates as a fitness and nutrition company in the United States and internationally. The company offers Beachbody on Demand, a subscription streaming service providing fitness programs such as P90X, Insanity, and 21 Day Fix; nutrition programs including Portion Fix and 2B Mindset; and nutritional products like Shakeology shakes and Beachbody Performance supplements. The company also faces legal challenges in California, where efforts are underway to reclassify independent consultants as employees, which may impact its direct selling model.In November, the stock price increased by 82.1% compared to October 2025. For the first eleven months of 2025, the stock price increased by 43.6%.
Recent updates reported through financial and industry coverage highlight that the company’s November performance was strongly influenced by its third-quarter 2025 results released earlier in the month. Revenue for Q3 reached approximately $59.9 million, with digital subscriptions continuing to represent the most resilient segment of the business. Management reported a return to profitability for the quarter, including positive adjusted EBITDA, reflecting the impact of cost-reduction efforts and a more efficient operating structure. These results were favorably received by investors, contributing to the substantial stock price increase during November. Industry reporting from direct-selling and affiliate-marketing sources also emphasized progress in the company’s transition toward an affiliate-driven model, noting growing stability in digital subscriber metrics and ongoing simplification of the compensation and distribution structure.
The strong stock recovery in November reflects improved investor confidence as the company shows signs of operational stabilization, strengthened margin performance and early success in its strategic pivot. Nonetheless, continued revenue pressures and regulatory uncertainties remain important considerations as the company works to sustain momentum through the remainder of the year.
Below are two summary diagrams on the direct selling large cap companies.

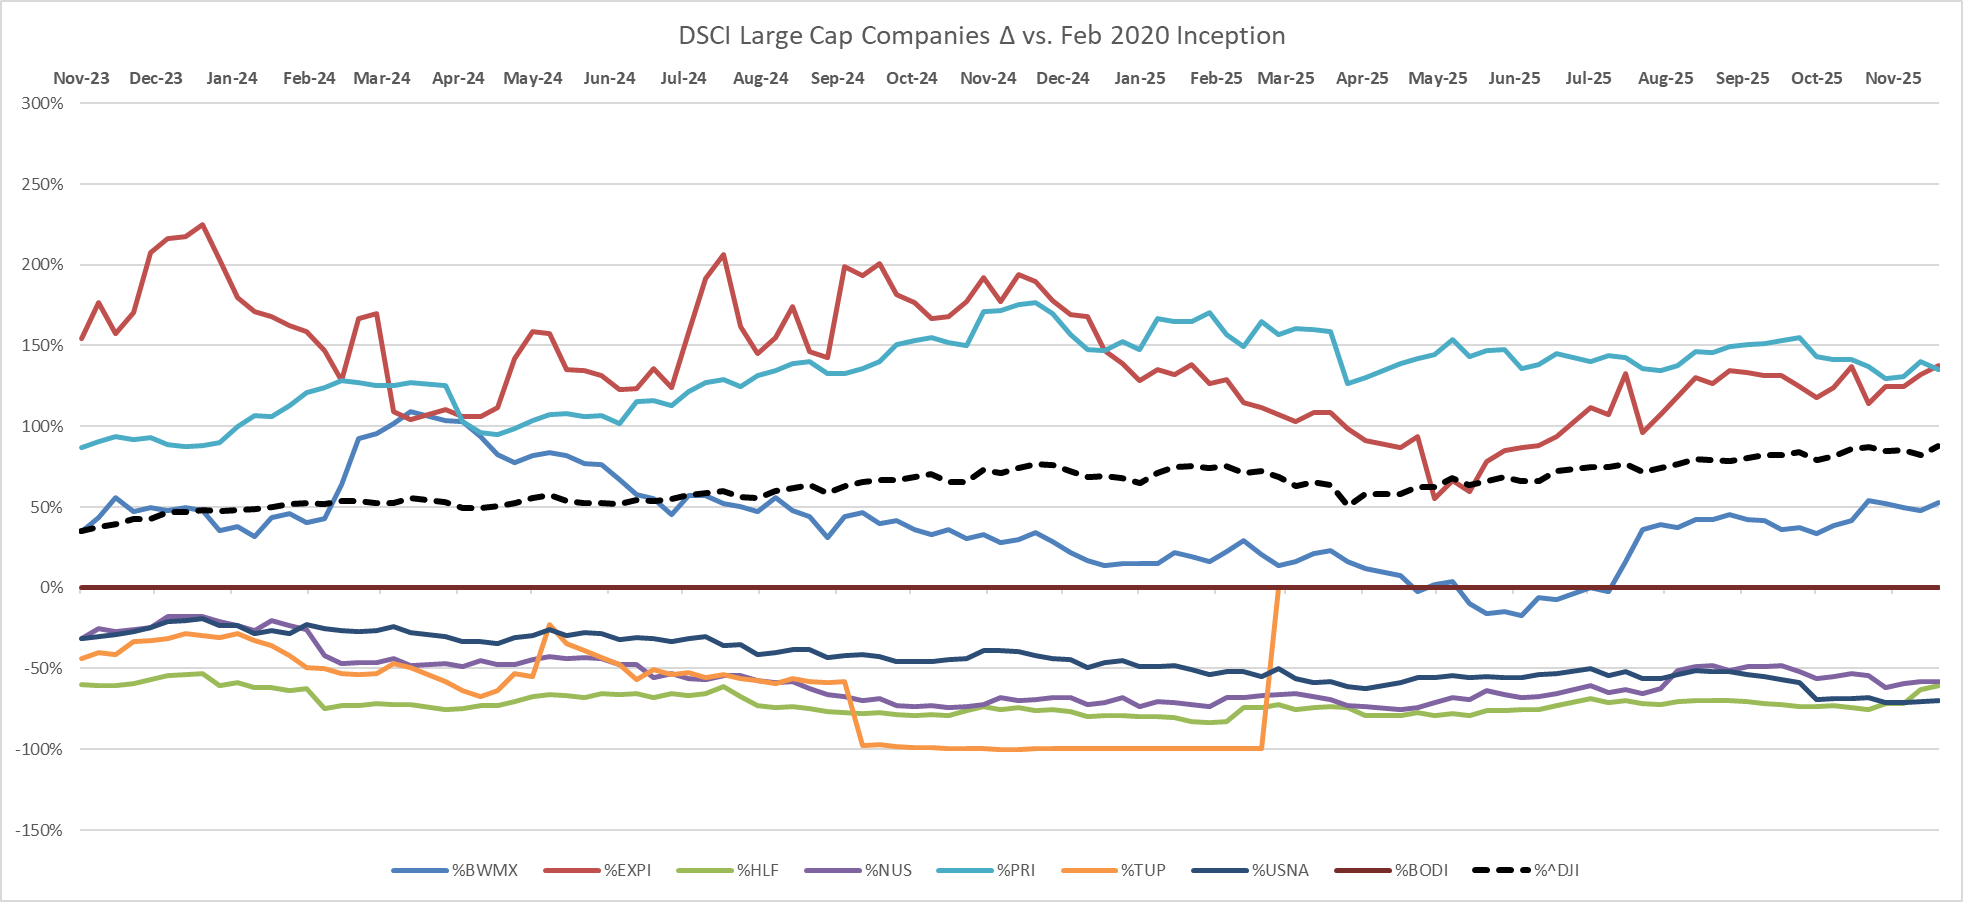
The Real Brokerage Inc. (NASDAQ: REAX), founded in 2014, is a technology-driven, asset-light real estate brokerage that empowers agents through a cloud-based platform, AI tools and fintech solutions. Operating across the US and Canada, the company combines commission-based revenue, innovative agent incentives and strategic acquisitions to disrupt traditional brokerage models and drive scalable growth.
The Real Brokerage entered November 2025 trading below its 52-week high, with the stock fluctuating in the $3.60–$4.10 range throughout the month and closing November at a notable discount of roughly 30–35% from its annual peak. Despite the softer share price, market sentiment remained stable as investors evaluated the company’s continued operational momentum and expanding agent network.
Operationally, November was a strong month. Real was recognized as one of the fastest-growing technology companies in North America, ranking No. 100 on the 2025 Deloitte Technology Fast 500™ due to 939% revenue growth from 2021 to 2024. This acknowledgment reinforced the company’s positioning as a tech-driven brokerage with scalable, asset-light economics.
During the month, Real resolved its litigation with former CFO Michelle Ressler, achieving a settlement with no payment required from the company. This removed a lingering source of uncertainty and was viewed positively from a governance standpoint. Additionally, leadership activity remained high-profile: CEO Tamir Poleg presented the company’s long-term vision at the RBC Global Technology, Internet, Media & Telecommunications Conference, highlighting Real’s focus on organic growth, agent empowerment and deepening the technological foundation of its platform. Later in the month, Poleg filed a notice to sell a small number of restricted shares—a standard administrative step but one noted by the market.
The company also prepared for its annual agent conference, RISE 2025, where it planned to unveil new AI tools, peer-learning programs and community initiatives, underscoring its ongoing commitment to innovation and the agent experience.
Financially, the most recent Q3 2025 results (released at the end of October) continued to define expectations for the November period. Revenue grew 53% year-over-year, adjusted EBITDA reached $20.4 million, and the agent network expanded to more than 30,000 agents across the US and Canada. Operational efficiency improved as adjusted expense per transaction declined 13%, and the company generated strong operating cash flow while continuing its share repurchase program, signaling management’s confidence in long-term value creation.
Analyst sentiment in November remained constructive, with at least one major firm reaffirming a Buy rating based on Real’s scalable model and consistent revenue growth trajectory.
Overall, November 2025 reflected steady operational strength for The Real Brokerage. Despite share price volatility, the company delivered meaningful advancements in technology, recognition, legal clarity and strategic communication—all contributing to a reinforced long-term growth outlook.
Small CapBelow is the November information for the two largest small cap companies, Nature’s Sunshine and LifeVantage.
Nature’s Sunshine Products, Inc. (NASDAQ: NATR), a natural health and wellness company, manufactures and sells nutritional and personal care products in Asia, Europe, North America, Latin America and internationally. The company provides general health products related to blood sugar support, bone health, cellular health, cognitive function, joint health, mood, sexual health, sleep, sports and energy and vision; immune products; cardiovascular products; and digestive products. It also offers personal care products, including oils and lotions, aloe vera gel, herbal shampoo, herbal skin treatment, toothpaste and skin cleanser products, as well as weight management products. The company provides its products under the Nature’s Sunshine Products and Synergy WorldWide brands directly to customers and to a sales force of independent consultants. Nature’s Sunshine Products, Inc. was founded in 1972 and is headquartered in Lehi, Utah.
In November, NATR’s stock price increased by 52.7% compared to October 2025, marking the strongest monthly gain among small-cap direct-selling companies. For the first eleven months of 2025, the stock rose 40.4%, and since the launch of the DSCI index, NATR has gained 165.0%.
During November, the company reported its Q3 2025 results, delivering net sales of $128.3 million, up 12% year-over-year, achieving its highest quarterly revenue to date. Adjusted EBITDA increased 42% to $15.2 million, while gross margin improved to 73.3%, supported by operational efficiencies and favorable product mix. GAAP net income was $5.3 million or $0.30 per diluted share, up from the prior year. Digital momentum remained strong, with North America digital sales growing 52% year-over-year, driven by expanding ecommerce and auto ship programs. International regions, particularly Asia-Pacific and Europe, also posted strong growth. The company ended the quarter with approximately $95.6 million in cash and no debt.
Given this strong performance, management raised full-year 2025 guidance to $476–480 million in net sales and $47–49 million in adjusted EBITDA. Positive responses from analysts and direct selling industry coverage, including favorable commentary on digital expansion and operational strength, contributed to heightened investor confidence and the substantial share-price surge in November.
Nature’s Sunshine enters the final quarter of the year with solid momentum, driven by digital channel growth, international expansion and reinforced profitability, positioning the company for continued strength heading into 2026.
LifeVantage Corporation (NASDAQ: LFVN) engages in the identification, research, development, formulation and sale of advanced nutrigenomic activators, dietary supplements, nootropics, pre- and probiotics, weight management, and skin and hair care products. It offers Protandim, a dietary supplement; LifeVantage Omega+, a dietary supplement that combines DHA and EPA Omega-3 fatty acids, Omega-7 fatty acids, and vitamin D3; LifeVantage ProBio, a dietary supplement to support gut health; LifeVantage IC Bright, a supplement to support eye and brain health, reduce eye fatigue and strain, support cognitive functions and support normal sleep patterns; LifeVantage Daily Wellness, a dietary supplement designed to strengthen immune health; LifeVantage Rise AM & Reset PM System that provides the body with the right nutrients; LifeVantage D3+, a dietary supplement that provides vitamin D3, vitamin K2, magnesium, calcium and other trace minerals to support a balanced immune system, strong bones and cardiovascular health; PhysIQ Fat Burn to support weight management; PhysIQ Prebiotic is a dietary supplement designed to support the good bacteria in the gut and a healthy microbiome; Petandim for Dogs, a supplement to combat oxidative stress in dogs; and Axio, a nootropic energy drink mix. The company also provides anti-aging skincare products, including liquid collagen, facial cleansers, eye cream, moisturizing cream, sunscreen, perfecting lotions, hand creams as well as hair care products, such as invigorating shampoos, nourishing conditioners and scalp serums under the TrueScience brand name. It sells its products through its website and network of independent consultants in the United States, Mexico, Japan, Australia, Hong Kong, Canada, Thailand, the United Kingdom, the Netherlands, Germany, Taiwan, Austria, Spain, Ireland, Belgium, New Zealand, Singapore and the Philippines. The company also launched Evolve Compensation Plan and other LV360 initiatives into the Philippines, Taiwan, Hong Kong and Singapore. The company is based in Lehi, Utah.
In November, LifeVantage’s stock price declined by 16.7% compared to October 2025, narrowing the company’s year-to-date losses to 61.1%. Since the February 1, 2020 establishment of the DSCI, LFVN has fallen 42.7%.
The November decline followed the company’s release of first-quarter fiscal 2026 results on November 4, which reported revenue of $47.6 million—below market expectations. Margin pressures tied to shipping and warehouse expenses, along with integration costs related to the LoveBiome acquisition, contributed to cautious investor sentiment and increased volatility.
Despite short-term challenges, LifeVantage continued to advance key strategic initiatives in November. The company provided updates on the integration of LoveBiome, reinforcing its growing focus on gut health and microbiome-oriented innovation. Management also highlighted ongoing consultant engagement programs tied to the Activate 2025 framework, including Momentum initiatives designed to support field productivity and long-term sales growth. In addition, LifeVantage announced its scheduled quarterly dividend, underscoring its intent to maintain shareholder returns while navigating near-term operational pressures.
Operationally, the company reported gross-profit and margin compression due to elevated logistics and seasonal costs. Although revenue showed slight year-over-year growth on a reported basis, it fell short of consensus expectations, making revenue execution and margin recovery central themes for investors in November. Still, the company emphasized continued progress in strengthening its product portfolio, particularly in science-backed nutrigenomics and GLP-1-related wellness solutions.
Overall, while LifeVantage’s shares faced downward pressure in November, the company’s ongoing focus on product innovation, microbiome expansion, consultant engagement and disciplined capital allocation continues to underpin its long-term growth strategy.
Below are two summary diagrams on the direct selling small cap companies.


Short Interest Data & Analysis
The following chart is an aggregate index of “days to cover” among the entire tracking set. Days to cover (DTC) is a measurement determined by dividing the total outstanding short interest by average daily trading volume.

As indicated in the chart, short interest in DSCI stocks was 3.9 days as of November 14, 2025. Short interest can be a difficult indicator to analyze. On the one hand, an increase in short interest can be a bearish sign in that it indicates an increased view among investors that a stock is likely to decline based on any number of factors, such as a belief that the company’s fundamentals are deteriorating or that it has run too far, too fast. On the other hand, as a stock moves higher, a significant short interest can serve as extra fuel on the fire as investors scramble to “buy to cover” their short positions and mitigate losses.
Analyst Sentiment Index
The DSCA Analyst Sentiment Index is a consensus tracking tool that aggregates and averages the recommendations of all covering analysts across all public direct selling companies.

-
October 2025
Brought to you by Direct Selling Capital Advisors
Direct Selling Index mirrors the DJIA for the month of October 2025
The Direct Selling Capital Advisors Direct Selling Index (DSCI) increased by 2.7% in October compared to September 2025. The DJIA rose by 2.6% over the same period. During the first ten months of 2025, the DSCI has gained 11.8%. Since its inception, the DSCI has delivered a total return of 87.2%, underscoring the sustained strength and stability of the direct selling channel over time.

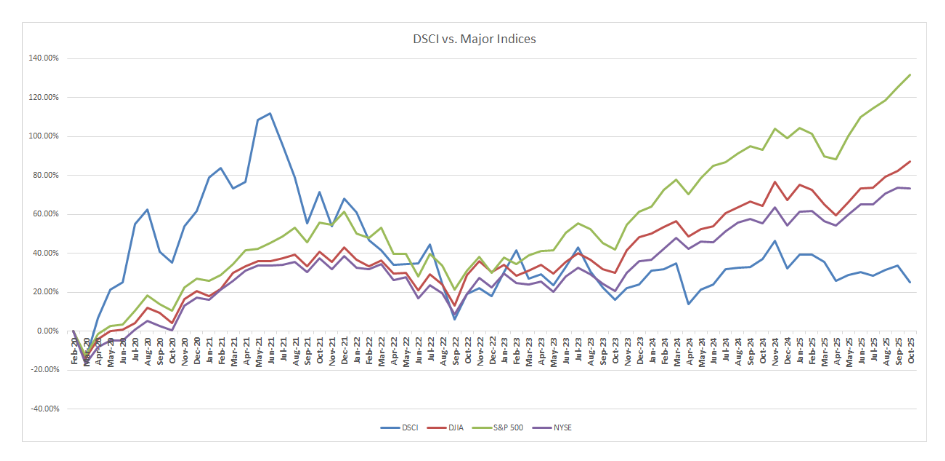
Positive Developments
- Strong organic growth in select firms: Zinzino reported approximately 65% year-on-year revenue growth in October 2025, with year-to-date revenue up ~55%. Growth was especially strong in Central Europe (+88%) and Asia-Pacific (+384%), while some regions, such as Eastern Europe, remained flat.
- Continued focus on digital and distributor engagement strategies: Many direct-selling firms are refining business and compensation models to improve distributor motivation and sales performance.
- Recognition and brand/industry initiatives: Herbalife Nutrition received industry recognition for innovative distributor programs, highlighting the importance of branding and engagement initiatives
Challenges & Caution Areas
- Uneven regional performance: Despite strong growth in some regions, other markets show flat or limited performance, emphasizing the need for targeted market strategies.
- Ongoing macroeconomic and structural pressures: Companies are still adjusting business models rather than relying on organic growth alone, reflecting persistent economic uncertainty.
- Limited public data: Many direct-selling firms have limited October disclosures, making comprehensive industry-level analysis challenging.
Strategic Implications / Outlook
- Omnichannel Integration: Firms blending traditional distributor networks with digital direct-to-consumer channels maintain a competitive advantage.
- Operational Efficiency: Strong growth in high-potential geographies underscores the importance of scaling efficiently while managing logistics and costs.
- Strategic Growth / M&A: Focus remains on selective international expansion and organic growth with M&A activity less pronounced in October.
- Distributor Engagement: Improving support, incentives, and training remains a top priority to sustain performance and retention.
- Regulatory & Legal Oversight: No major new regulatory developments in October; the environment remains stable but requires ongoing vigilance.
Summary
In October 2025, the direct-selling channel demonstrated strong performance among companies with global reach and digitally enabled distributor engagement strategies. While growth opportunities remain, particularly in emerging markets, uneven regional performance and economic pressures highlight the need for disciplined execution. Companies combining international expansion with enhanced digital and distributor strategies are positioned to outperform their peers.
Large Cap
Note: For the purposes of this report, Direct Selling Capital considers companies with a market capitalization in excess of $1 billion “Large Cap.”
Founded in 1995, Betterware de Mexico (NASDAQ: BWMX) is the leading direct-to-consumer company in Mexico focused on offering innovative products that solve specific household needs related to organization, space-saving, practicality and hygiene. Through the acquisition of JAFRA on April 7, 2022, the company expanded into the beauty category across Mexico and the United States, offering fragrances, color and cosmetics, skincare and toiletries. The combined business operates an asset-light model with historically strong profitability, double-digit revenue growth rates and solid free-cash-flow generation.
In October 2025, Betterware’s stock price increased by 11.0% compared to September. Year-to-date, the stock recorded a positive performance of 29.5%. Since the establishment of the DSCI on February 1, 2020, BWMX has grown by 53.7%.
For Q3 2025, the company reported consolidated revenue growth of 1.4% year-over-year and a strong 22% increase in EBITDA, with EBITDA margin expanding to 21.4%, reflecting significant improvements in profitability. Betterware Mexico faced a moderate revenue decline due to softer consumer spending, while JAFRA Mexico delivered robust growth of approximately 31% year-over-year, supported by brand revitalization, enhanced salesforce productivity and strategic pricing initiatives.
The quarter demonstrated continued progress in the company’s transformation strategy following the JAFRA acquisition. Strong performance from the beauty segment, combined with disciplined cost management and improved free-cash-flow conversion, helped reinforce investor confidence—contributing to the positive stock movement in October.
Betterware also continued advancing its international expansion efforts, with growing momentum in recently launched markets such as Ecuador and Guatemala. Management reaffirmed its long-term strategic priorities centered on international growth, product portfolio optimization and sustained profitability to support its long-term revenue ambitions and value creation for shareholders.
Nu Skin Enterprises, Inc. (NYSE: NUS), together with its subsidiaries, develops and distributes a broad portfolio of beauty and wellness products worldwide. The company’s offerings include skincare devices (ageLOC LumiSpa, ageLOC LumiSpa iO), cosmetics and personal care products, and nutritional/wellness products such as LifePak, ageLOC TR90 and Beauty Focus Collagen+. Nu Skin conducts research and product development across skin care and nutrition and sells through retail channels, digital platforms and a global network of independent direct sellers under the Nu Skin, Pharmanex and ageLOC brands. The company was founded in 1984 and is headquartered in Provo, Utah.
In October 2025, Nu Skin’s stock price declined by 11.3% compared to September. Year-to-date the stock is up 55.6%, while since the establishment of the DSCI on February 1, 2020, Nu Skin’s stock has declined 54.6%. The stock’s 52-week range remains wide, with a high near $11.62 and a low of $5.32, reflecting continued volatility as the market weighs near-term pressures against strategic progress.
Nu Skin continued to face top-line pressure driven by contraction in parts of its direct-selling network even as pockets of growth and operational improvement emerged. The company’s device and manufacturing businesses showed positive momentum during October. Nu Skin was recognized in industry rankings as a leading beauty and wellness device company, underscoring the strength of its device platform and the strategic importance of device-enabled product ecosystems to future recurring revenue.
Customer and affiliate metrics have been under pressure for multiple quarters, and October commentary reinforced this trend, with management continuing to prioritize salesforce alignment, targeted incentives and product-led engagement initiatives to rebuild field productivity. The company reiterated that shifts toward affiliate-powered social commerce and subscription offerings are central to stabilizing and reaccelerating active user and affiliate growth.
Nu Skin reiterated its focus on the device-plus-consumable strategy and signaled ongoing product portfolio expansion later in the year. The company continues to progress on the Prysm iO intelligent wellness device and related personalization/subscription capabilities, which management expects to stimulate the supplements and recurring-commerce businesses once broadly deployed.
Management remains focused on three core levers: (1) accelerate adoption of device ecosystems and subscription models to improve customer lifetime value; (2) deepen momentum in high-growth markets (notably Latin America) while preparing for targeted new market entries; and (3) continue operational optimization to protect margins amid revenue headwinds. While near-term revenue pressures persist, Nu Skin pointed to margin discipline and targeted investments in innovation and market expansion as the path to restoring more consistent growth.
October was a mixed month: the stock pulled back materially, reflecting investor sensitivity to near-term network and revenue challenges, yet underlying strategic progress—device recognition and ongoing product roadmaps—provides a plausible recovery path if the company can translate innovation and market expansion into improved salesforce productivity and recurring revenue growth.
Herbalife Nutrition, Inc. (NYSE: HLF), together with its subsidiaries, provides health and wellness products in North America, Mexico, South and Central America, Europe, the Middle East, Africa, China and Asia Pacific. The company offers products in the areas of weight management; targeted nutrition; energy, sports and fitness; outer nutrition; and literature, promotional and other items. It also provides weight management products, including meal replacement products, protein shakes, drink mixes, weight loss supplements, healthy snacks and metabolism boosting teas; targeted nutrition products, which include functional beverages and dietary and nutritional supplements that contain herbs, vitamins, minerals and other natural ingredients; outer nutrition products, such as facial skin, body and hair care products; and energy, sports and fitness products, including N-R-G tea and energy drink products. In addition, it offers literature, promotional and other materials that comprise start-up kits, sales tools and educational materials. The company sells its products through sales representatives, independent service providers and company-operated retail stores and platforms. The company was formerly known as Herbalife Nutrition Ltd. and changed its name to Herbalife Ltd. in April 2023. Herbalife Ltd. was founded in 1980 and is headquartered in Los Angeles, California.
For the month of October 2025, Herbalife’s stock declined by approximately 6.0% compared to September, marking a pause in the recent positive momentum. Year-to-date, the stock has increased by 19.6%, maintaining a positive return. However, HLF remains down 75.3% since the establishment of the DSCI on February 1, 2020.
In October, the stock’s Relative Strength Rating remained strong, reflecting continued technical resilience. Analysts note that investors may watch for entry setups such as pullbacks to the 50-day or 10-week moving average or formation of a three-week-tight pattern. Earnings in the last quarter rose modestly, while net sales increased by 2.7% year-over-year, with North America posting its first quarterly gain since Q2 2021.
On November 6, 2025, Herbalife reported its Q3 2025 financial results, showing net sales near $1.30 billion, adjusted EBITDA above expectations and continued improvement in its leverage ratio. In October, the company opened a new “Center of Excellence” R&D and quality-control lab to support innovation and was recognized with the Direct Selling Association’s “Vision for Tomorrow” award for its Casa Herbalife initiative.
Herbalife continues to trade at a discount to fair value estimates, suggesting potential upside if current operational and market trends persist. While earnings forecasts indicate a modest decline over the next three years, improvements in regional performance, product innovation and technical strength could support recovery.
With stable stock performance, regional growth and ongoing strategic initiatives, Herbalife enters the final months of 2025 positioned for potential growth, making upcoming quarters critical for confirming this trajectory.
Medifast, Inc. (NYSE: MED), through its subsidiaries, operates as a health and wellness company offering habit-based, coach-guided lifestyle solutions focused on weight management and obesity support in the United States. The company’s flagship brand, OPTAVIA, delivers clinically supported weight loss programs, GLP-1 support plans and a wide variety of food products, such as bars, shakes, soups, cereals and snacks, complemented by one-on-one coaching, digital tools and community support. Medifast was founded in 1980 and is headquartered in Baltimore, Maryland. Its products are sold via point-of-sale transactions and ecommerce.
For the month of October 2025, shares of Medifast declined by 13.2% compared to September. Year-to-date, the stock is down 31.8%, and since the establishment of the DSCI on February 1, 2020, the stock has declined by 84.9%.
In Q3 2025, the company reported revenue of $89.4 million, a 36.2% decrease compared to the same period in 2024. Medifast recorded a net loss of $2.3 million, or $0.21 per diluted share, compared with net income of $1.1 million, or $0.10 per diluted share, a year earlier. Gross profit fell 41.2% to $62.2 million, with a gross margin of 69.5%. The number of active OPTAVIA coaches declined by 35.0% to 19,500, while SG&A expenses decreased by 36.0% to $66.2 million, primarily due to lower coach compensation, reduced marketing spending and fewer convention-related costs. The company ended the quarter with $173.5 million in cash, cash equivalents and investment securities and reported no debt.
During the quarter, Medifast continued its strategic pivot toward metabolic health solutions, including enhanced support for clients using GLP-1 medications and introduced initiatives aimed at improving coach engagement and retention. For Q4 2025, Medifast expects revenue between $65 million and $80 million, with earnings per share projected in the range of –$0.70 to –$1.25.
Following the Q3 earnings release, Medifast’s shares experienced a moderate decline as investors focused on the ongoing revenue contraction, continued decline in coach numbers and cautious forward guidance, despite the company’s solid balance sheet and cost-control efforts.
USANA Health Sciences, Inc. (NYSE: USNA) develops, manufactures and sells science-based nutritional, personal care and skincare products in the Asia Pacific, the Americas and Europe. It operates in two segments, direct selling and Hiya direct-to-consumer. The company offers USANA nutritional optimizers, including supplements for cardiovascular health, skeletal/structural health and digestive health; Essentials/CellSentials, such as vitamin and mineral supplements for age groups beginning with children 13 months of age; and food products that include meal replacement shakes, snack bars and other related products for healthy weight management, digestive health and energy and hydration. It also provides Celavive, a skincare regimen for various skin care types and ethnicities and all other products comprising materials and online tools for associates to build business and marketing of products. The company sells its products through retail customers, a subscription model and direct selling, as well as online. The company has a research collaboration agreement with Beijing University of Chinese Medicine; and National Sports Training Bureau. USANA Health Sciences, Inc. was founded in 1992 and is headquartered in Salt Lake City, Utah.
For the month of October 2025, USANA’s stock declined by 23.5% compared to September, marking one of its steepest monthly drops of the year. Year-to-date, the stock is down 41.1%, significantly underperforming broader markets and peers. Since the establishment of the DSCI on February 1, 2020, USANA shares have lost 68.0%.
October was largely shaped by the company’s third-quarter earnings report, which triggered substantial volatility and investor concern. On October 22, USANA reported Q3 2025 net sales of $214 million, representing approximately 7% year-over-year growth, but posted a net loss of $6.5 million, reflecting continued margin pressure. Despite revenue growth driven by the Hiya direct-to-consumer segment, profitability came under strain due to higher operating expenses and transition costs associated with the rollout of a new global compensation plan.
The earnings release and subsequent guidance revision weighed heavily on investor sentiment. Management trimmed its full-year 2025 outlook, citing near-term disruption from the compensation plan implementation and productivity adjustments among Brand Partners. Analysts viewed the update as a sign of short-term turbulence, with several rating agencies and research outlets lowering their near-term forecasts. Zacks, for instance, shifted its stance to a more cautious outlook, reflecting diminished earnings visibility.
Operationally, the company continues to emphasize digital expansion and product innovation while maintaining a strong balance sheet. Growth in the Hiya subscription business provided a partial offset to softness in the core direct-selling channel, but active customer counts and sales productivity remained below last year’s levels. Management reiterated that 2025 is a 53-week fiscal year and expects that the transition to the new compensation model will enhance long-term field engagement and sales efficiency once fully implemented.
However, October’s steep share-price decline underscores the market’s growing impatience with near-term execution risks. Analysts highlighted that while USANA’s revenue trajectory is stabilizing, profitability headwinds, increased costs and declining field activity continue to pressure the stock.
Overall, October reflected a challenging month for USANA, marked by solid top-line growth but weak earnings performance and a negative investor reaction. As the company enters the final quarter of 2025, management’s ability to restore Brand Partner productivity, stabilize margins and translate strategic initiatives into consistent growth will be key to rebuilding investor confidence.
eXp World Holdings, Inc. (NASDAQ: EXPI), together with its subsidiaries, provides cloud-based real estate brokerage services for residential homeowners and homebuyers. It operates through three segments: North American Realty, International Realty and Other Affiliated Services. The company acts as a licensed broker for processing residential and commercial real estate transactions and provides other real estate support services. It also offers FrameVR.io, a web-accessible proprietary technology offering immersive 3D platforms; a magazine and related media properties which provide training, classes, resources and tools under the SUCCESS brand; SUCCESS Space, a coworking solution offering rental workspaces for individual and group use, access to professional development coaching, media production services, virtual-world communications technology and full-service cafes. It operates in North America, Canada, the United Kingdom, Australia, South Africa, India, Mexico, Portugal, France, Puerto Rico, Brazil, Italy, Hong Kong, Colombia, Spain, Israel, Panama, Germany, the Dominican Republic, Greece, New Zealand, Chile, Poland, Dubai and recently expanded into Japan. The company was formerly known as eXp Realty International Corporation and changed its name to eXp World Holdings, Inc. in May 2016. eXp World Holdings, Inc. was incorporated in 2008 and is headquartered in Bellingham, Washington.
The stock price declined 7.9% in October vs. September 2025. For the first ten months of 2025, their stock price has declined by 11.0%. More constructively, EXPI shares have appreciated an aggregate 114.2% over the five years the DSCI has been computed, reflecting strong long-term performance despite recent headwinds.
On November 6, the company reported its Q3 2025 financial results. Revenue grew 7% year-over-year to $1.317 billion, driven by higher real estate sales volume, which reached $54.1 billion (+7% YoY). Net income for the quarter was $3.5 million, with EPS of $0.02, while adjusted EBITDA totaled $17.7 million. Net cash provided by operating activities came in at $28.9 million. While revenues and sales volume improved, agent and broker count declined 2% to 83,446, reflecting ongoing retention and recruiting pressures.
Operationally, eXp continued investing in its cloud-based platform, agent tools and global expansion initiatives. Productivity per agent remained healthy, with transactions rising 3% to 121,516 in Q3, highlighting efficiency gains even as total agent count slipped. Platform enhancements, agent training, and AI-driven initiatives were key focus areas during the quarter, positioning the company for longer-term growth despite short-term operational pressures.
October’s stock weakness likely reflected investor caution over near-term profitability, modest agent-count declines and elevated operating expenses from strategic investments. Nevertheless, eXp’s strong five-year performance, scalable cloud-based model, and disciplined financial management continue to support the company’s long-term growth narrative. The combination of platform strength, international reach and training/technology initiatives provides a foundation for potential recovery if real estate market conditions stabilize in late 2025.
With a blend of long-term performance, short-term operational challenges and solid platform fundamentals, October highlighted the market’s cautious stance on near-term metrics while maintaining confidence in eXp’s long-term growth story.
Selected financial & operational snapshot:
- Stock price: -7.9% in October vs. September 2025; -11.0% YTD; +114.2% five-year aggregate appreciation
- Q3 2025 revenue: $1.317 billion (+7% YoY)
- Q3 2025 adjusted EBITDA: $17.7 million
- Q3 2025 net income: $3.5 million (EPS $0.02)
- Agents and brokers (Sept 30, 2025): 83,446 (-2% YoY)
- Q3 transactions: 121,516 (+3% YoY); sales volume: $54.1 billion (+7% YoY)
- Net cash provided by operating activities: $28.9 million
Primerica, Inc. (NYSE: PRI), together with its subsidiaries, provides financial products and services to middle-income households in the United States and Canada. The company operates in three segments: Term Life Insurance; Investment and Savings Products; Senior Health; and Corporate and Other Distributed Products. The Term Life Insurance segment underwrites individual term life insurance products. The Investment and Savings Products segment provides mutual funds and various retirement plans, managed investments, variable and fixed annuities and fixed indexed annuities and offers segregated funds. The Corporate and Other Distributed Products segment provides mortgage loans; prepaid legal services that assist subscribers with legal matters, such as drafting wills, living wills and powers of attorney, trial defense and motor vehicle-related matters; ID theft defense services; auto and homeowners’ insurance; home automation solutions and insurance products, including supplemental and accidental death and disability insurance. It distributes and sells its products through licensed sales representatives. Primerica, Inc. was founded in 1927 and is headquartered in Duluth, Georgia.
In October, the stock price declined by 5.9% vs. September 2025. For the first ten months of 2025, the stock has declined 4.3%. PRI has appreciated 137.2% since February 1, 2020, the best long-term performance for any DSCI member.
Primerica shares slipped in October after modest gains earlier in the year, as investors monitored the company’s third quarter earnings report and broader consumer spending trends. Despite the pullback, Primerica remains among the strongest long-term performers within DSCI, underpinned by a resilient client base and disciplined financial management.
The Primerica Household Budget Index™ (HBI) for September 2025, released in October, came in at 99.9%, down 0.1 percentage points from August’s 100.0%, according to Primerica’s consulting economist, Amy Crews Cutts. She noted, “The continued stability of the HBI suggests that wage growth remains sufficient to offset rising costs of essentials, though many families are still exposed to volatility in food and energy prices.” This signals that the company’s core middle-income customer base continues to face inflationary pressures but is managing to maintain relative financial stability.
Management continues to prioritize the expansion of its licensed representative force and the development of additional financial wellness offerings tailored to its core demographic. Analysts emphasize the company’s conservative underwriting standards and strong capital reserves as important factors supporting ongoing profitability and stability, even as economic conditions remain uncertain.
Oliveda International, Inc. (OTC: OLVI) was founded in 2003 and has more than 20 years of experience in: 1) the management and organic certification of mountain olive trees; 2) the extraction of international award-winning extra virgin olive oils; 3) the extraction of hydroxytyrosol, a compound with antioxidant, anti-inflammatory, anticancer and skin- and eye-protective effects; and 4) the production and distribution of cosmetic and holistic waterless products derived from the olive tree.
Oliveda International, Inc. and its subsidiaries, including Olive Tree People Inc., Olive Tree People Europe AG, Oliveda Deutschland GmbH and Olive Tree Farmers SL, were founded by German real estate investor Thomas Lommel. The group has established a unique market position through innovations such as Olive Tree Therapy “10 years in 14 days,” olive matcha (made from ground olive leaves) and a coffee alternative based on olive leaves and hydroxytyrosol. Lommel is also active in the mindfulness sector with his olive tree sound bath meditations and the broadcast of olive tree frequencies globally.
Comparing October 2025 to September 2025, the stock price declined by 63.6%. For the first ten months of 2025, the stock declined by 91.1%.
Olive Tree People, OLVI’s waterless beauty subsidiary, continued its global expansion in October 2025 with the official launch of operations in Europe through Olive Tree People Europe AG. Following extraordinary growth in 2024 and a strong first half of 2025, the company expanded its retail and direct selling presence across key European markets. In early October, Olive Tree People hosted a major event at its Los Angeles flagship store, celebrating over 69,000 active brand partners and unveiling a new product concept connected to its “NO MAKEUP” line, first introduced at New York Fashion Week in September.
In October, the company reaffirmed its upcoming launch of the hydroxytyrosol-based pet care brand “Is that Matty,” scheduled for November, and confirmed progress on the construction of a new olive mill in partnership with the municipality of Arroyomolinos de León. These initiatives aim to strengthen OLVI’s vertical integration and ensure supply stability for its growing global operations.
CEO Thomas Lommel emphasized that despite volatility in the capital markets, Oliveda International remains focused on innovation, sustainability and its mission to redefine beauty and wellness through the power of the olive tree.
The Beachbody Company, Inc. (NYSE: BODI) operates as a fitness and nutrition company in the United States and internationally. The company offers BODi (formerly Beachbody On Demand), a subscription streaming service providing fitness programs such as P90X, Insanity and 21 Day Fix; nutrition programs including Portion Fix and 2B Mindset; and nutritional products like Shakeology shakes and BODi Performance supplements. The company continues its transition from a traditional direct selling model toward an affiliate and omnichannel approach, aiming to improve customer acquisition efficiency and streamline operations. Legal challenges in California regarding the classification of independent consultants as employees remain a potential risk to its business model.
In October, the stock price declined by 17.8% compared to September 2025. For the first ten months of 2025, the stock price declined by 21.1%.
Recent updates include continued implementation of cost reduction measures and a focus on expanding the company’s digital subscription base. According to recent reports, total revenue in Q2 2025 reached approximately $63.9 million, reflecting a significant year-over-year decrease, while net losses narrowed compared to the prior year period. Management emphasized progress in shifting the business model and strengthening recurring subscription revenue through its affiliate program relaunch.
The decline in stock price during October reflects investor caution amid ongoing revenue pressures and legal uncertainties. However, operational improvements, a streamlined cost structure and growing digital engagement suggest cautious optimism for long-term stabilization.
Below are two summary diagrams on the direct selling large cap companies.
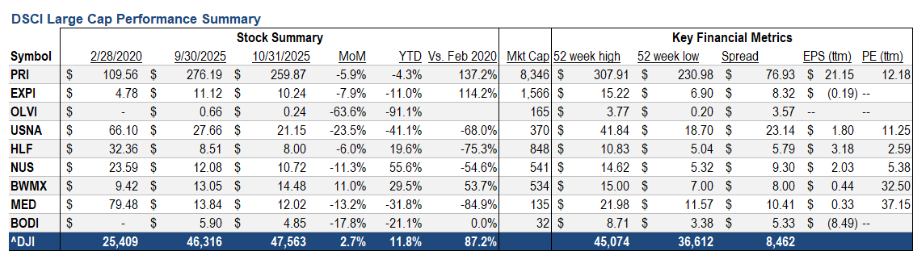
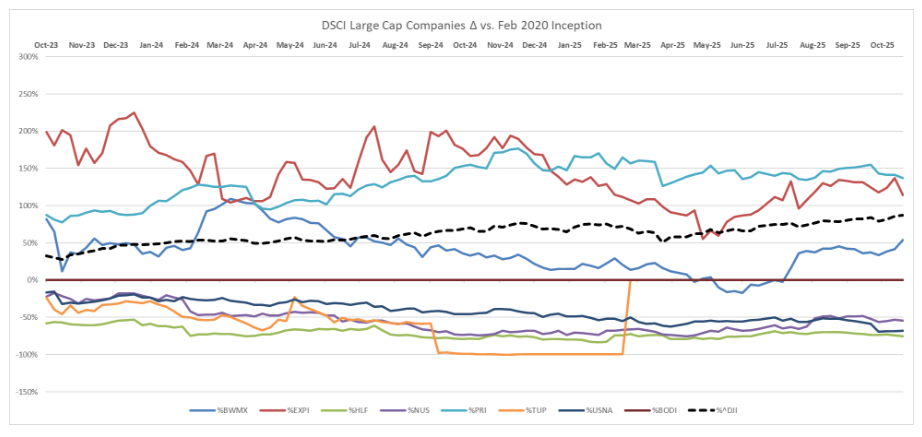
Founded in 2014, The Real Brokerage Inc. (NASDAQ: REAX) is a technology-driven, asset-light real estate brokerage that empowers agents through a cloud-based platform, AI tools and fintech solutions. Operating across the US and Canada, the company combines commission-based revenue, innovative agent incentives and strategic acquisitions to disrupt traditional brokerage models and drive scalable growth.
In Q3 2025, Real reported revenue of $568.5 million (+53% YoY) and gross profit of $49.2 million (+45% YoY). Adjusted EBITDA increased to $20.4 million, up from $13.8 million a year earlier, while net income reflected a modest net loss of $0.4 million, a significant improvement from a $2.2 million loss in Q3 2024. The company closed 53,512 transactions (+59% YoY) with a total transaction value of $21.4 billion (+55% YoY). Agent count grew 43% to 30,120 at quarter-end, supported by continued recruitment momentum and platform expansion. Operating cash flow remained strong, and the company ended the quarter with solid liquidity and no debt.
Strategic highlights included the ongoing rollout of the Real Wallet fintech platform and the expansion of the integrated One Real ecosystem—including mortgage, title and insurance services—designed to enhance agent productivity and capture additional transaction value. The integration of Flyhomes’ AI-powered home search portal, announced earlier in 2025, has further strengthened Real’s data and AI capabilities, improving the agent and client experience across its cloud platform.
Throughout October, Real emphasized its focus on sustainable profitability and continued market share gains through a blend of technology innovation, agent growth and fintech monetization. With a debt-free balance sheet, robust operating cash generation and expanding revenue base, Real remains well-positioned to navigate housing market headwinds while scaling its unified real estate and fintech platform.
Small Cap
Below is the October information for the two largest small cap companies.
Nature’s Sunshine Products, Inc. (NASDAQ: NATR), a natural health and wellness company, manufactures and sells nutritional and personal care products in Asia, Europe, North America, Latin America and other markets internationally. The company provides general health products related to blood sugar support, bone health, cellular health, cognitive function, joint health, mood, sexual health, sleep, sports and energy and vision; immune products; cardiovascular products; and digestive products. It also offers personal care products, including oils and lotions, aloe vera gel, herbal shampoo, herbal skin treatment, toothpaste and skin cleanser products as well as weight management products. The company provides its products under the Nature’s Sunshine Products and Synergy WorldWide brands directly to customers and to a sales force of independent consultants. Nature’s Sunshine Products, Inc. was founded in 1972 and is headquartered in Lehi, Utah.
In October, their stock price declined by 11.4% compared to September 2025. For the first ten months of 2025, the stock declined by 8.0%. Since the inception of the DSCI, NATR has gained 73.6%.
Recent developments include the relaunch of the company’s Power Line, a key metabolic health product range, as part of its ongoing innovation and wellness strategy. Additionally, Nature’s Sunshine announced a leadership transition with Kenneth Romanzi appointed as Chief Executive Officer effective October 29, 2025. The company also held its Q3 2025 earnings conference call for November 6, 2025. These updates drew investor attention and likely contributed to share price volatility during the month.
Operationally, the company continues to demonstrate resilience with strong international sales momentum, particularly in Japan and Central Europe and ongoing strength in digital and autoship channels. Its previously reported Q2 2025 results showed net sales of $114.8 million, up 4% year-over-year, adjusted EBITDA of $11.3 million, up 8% year-over-year, and gross margin improvement to 71.7%. The company ended the quarter with $81.3 million in cash and no debt and raised its full-year 2025 guidance to net sales between $460 million and $475 million, and adjusted EBITDA between $41 million and $45 million.
The sharp stock price decline in October, despite the company’s solid operational performance and raised full-year guidance, appears to be influenced by investor reaction to the CEO transition and broader small-cap market sentiment. However, Nature’s Sunshine’s strong balance sheet, consistent profitability, international growth and focus on digital expansion support a cautiously optimistic outlook for the remainder of the year.
LifeVantage Corporation (NASDAQ: LFVN) engages in the identification, research, development, formulation and sale of advanced nutrigenomic activators, dietary supplements, nootropics, pre- and probiotics, weight management and skin and hair care products. Its offerings include Protandim, LifeVantage Omega+, LifeVantage ProBio, LifeVantage IC Bright, LifeVantage Daily Wellness, LifeVantage Rise AM & Reset PM System, LifeVantage D3+, PhysIQ Fat Burn, PhysIQ Prebiotic, Petandim for Dogs and Axio, a nootropic energy drink mix. The company also provides anti-aging skincare and hair care products under the TrueScience brand. LifeVantage sells its products through its website and network of independent consultants in markets including the United States, Mexico, Japan, Australia, Hong Kong, Canada, Thailand, the United Kingdom, the Netherlands, Germany, Taiwan, Austria, Spain, Ireland, Belgium, New Zealand, Singapore and the Philippines. The company is based in Lehi, Utah.
In October, LifeVantage’s stock price declined by 16.1% compared to September 2025, extending its year-to-date losses to 53.3%. Since the February 1, 2020 establishment of the DSCI, LFVN has decreased by 31.2%. The company’s shares continued to experience downward pressure amid broader market volatility and investor caution across the direct selling sector.
Despite the challenging stock performance, LifeVantage maintained strategic momentum during the month. The company completed the acquisition of LoveBiome, strengthening its position in the gut health and microbiome wellness category—a move that complements its existing ProBio and PhysIQ product lines. LifeVantage also continued its global distributor engagement initiatives, including Momentum and Momentum Academy events, designed to empower consultants and drive long-term sales growth.
The company’s summer Activate 2025 framework continues to guide its innovation and international expansion strategy, following its recent market entry into Iceland and clinical findings demonstrating a 200% increase in natural GLP-1 production, a hormone associated with appetite regulation and metabolic health.
While short-term stock performance remains under pressure, LifeVantage’s strategic initiatives—including product innovation, scientific validation and geographic expansion—continue to underscore the company’s commitment to long-term value creation and global brand growth.
Below are two summary diagrams on the direct selling small cap companies.
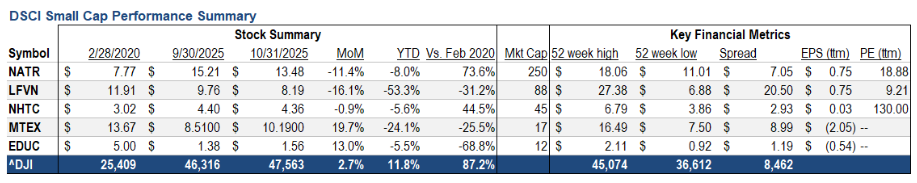

Short Interest Data & Analysis
The following chart is an aggregate index of “days to cover” among the entire tracking set. Days to cover (DTC) is a measurement determined by dividing the total outstanding short interest by average daily trading volume.

As indicated in the chart, short interest in DSCI stocks was 6.3 days as of October 15, 2025. Short interest can be a difficult indicator to analyze. On the one hand, an increase in short interest can be a bearish sign in that it indicates an increased view among investors that a stock is likely to decline based on any number of factors, such as a belief that the company’s fundamentals are deteriorating or that it has run too far, too fast. On the other hand, as a stock moves higher, a significant short interest can serve as extra fuel on the fire as investors scramble to “buy to cover” their short positions and mitigate losses.
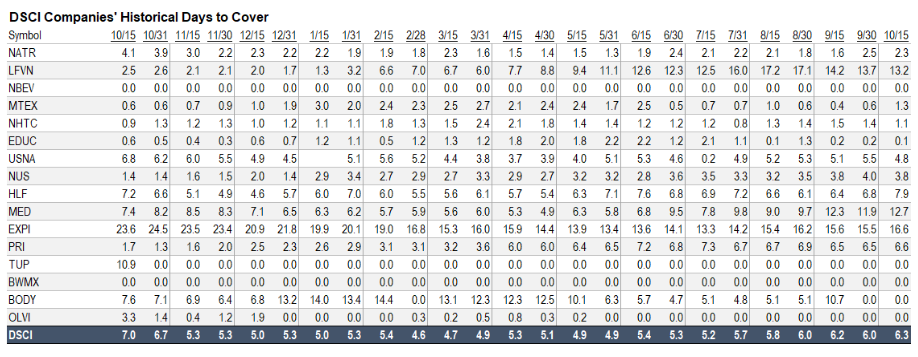
Analyst Sentiment Index
The DSCA Analyst Sentiment Index is a consensus tracking tool that aggregates and averages the recommendations of all covering analysts across all public direct selling companies.

-
September 2025
Brought to you by Direct Selling Capital Advisors
Direct Selling Index mirrors the DJIA for the month of September 2025
The Direct Selling Capital Advisors Direct Selling Index (DSCI) rose 1.7% in September 2025 compared to August, while the Dow Jones Industrial Average (DJIA) advanced 2.5% over the same period. Year to date, the DSCI has gained 8.9%, reflecting steady growth across the sector. Since its inception, the DSCI has delivered an aggregate return of 82.3%, underscoring the long-term resilience and stability of the direct selling channel.
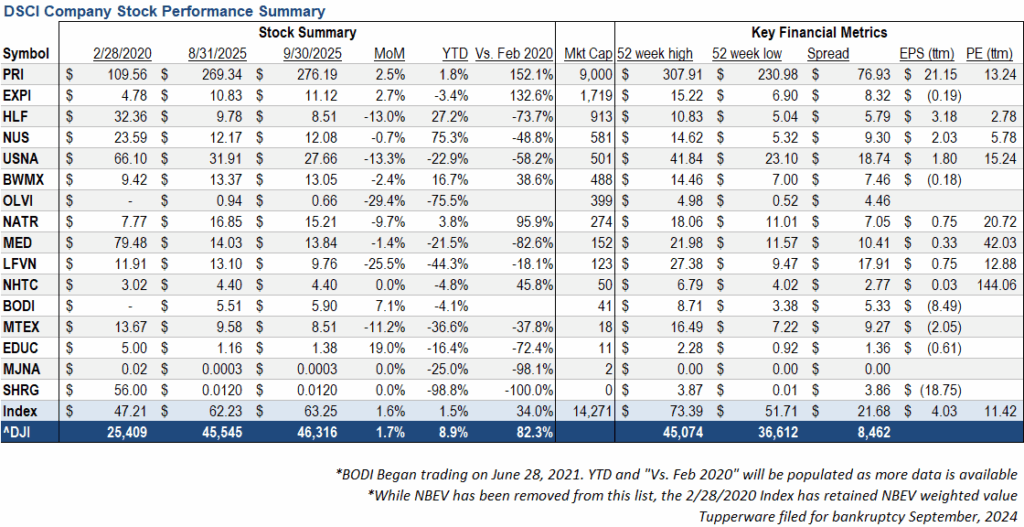

Industry Overview
The latter part of 2025 continued to test the resilience of the direct selling channel. While macroeconomic uncertainty remains a factor, companies within the sector are increasingly demonstrating adaptability, strategic growth and selective opportunity.
Key Industry Developments
- M&A Activity: Several companies expanded through strategic acquisitions, including distributor networks and intellectual property assets. These moves are aimed at strengthening market positioning, increasing product portfolios and enhancing operational efficiency.
- Regulatory Update: The Federal Trade Commission signaled a shift in enforcement of non-compete rules, moving from a blanket approach to case-by-case evaluations. This provides companies with clearer guidance on contractor and distributor agreements.
- Digital Transformation: Firms continue to leverage technology to optimize distributor engagement. Key initiatives include gamification, personalized incentives, real-time training and integrated digital platforms to improve motivation, retention and overall sales performance.
- Distributor Engagement: Strengthening distributor networks through targeted training programs, incentive systems and support mechanisms remains a key priority. Companies focusing on high-quality engagement are better positioned to retain top performers and maintain sales momentum.
- International Opportunities: Beyond the US, global markets continue to offer growth potential. Developed regions such as Germany are projected to see continued expansion, supported by favorable consumer trends, innovation and a stable legal framework.
Outlook
The direct selling channel faces both opportunities and challenges:
- Omnichannel Integration: Companies blending traditional distributor networks with digital direct-to-consumer channels are likely to gain a competitive advantage.
- Operational Efficiency: Rising costs in logistics, technology and marketing favor firms capable of scaling efficiently.
- Strategic Growth: M&A activity and international expansion provide pathways for market share growth.
- Enhanced Engagement: Investment in distributor support and digital tools remains essential for sustained performance and brand loyalty.
DSCI Methodology
The Direct Selling Capital Advisors Index (DSCI) is a market capitalization-weighted index of all US. publicly traded direct selling companies with a market capitalization of at least $25 million. The index is rebalanced monthly, and no single issue is permitted to represent more than 20% of its total value; excess weight is redistributed among remaining constituents.
For more insights, read these articles: Pivots, Pressures and the Path Ahead, AI: The Other Opportunity, FTC Dismisses Federal Non-Compete Ban, DSEF Research Shows Rise in Consumer Trust
Large Cap
Note: For the purposes of this report, Direct Selling Capital considers companies with a market capitalization in excess of $1 billion “Large Cap.”
Betterware de Mexico (NASDAQ: BWMX), founded in 1995, is the leading direct-to-consumer company in Mexico specializing in household organization, practicality, space-saving and hygiene products. Through the acquisition of JAFRA in April 2022, the company expanded into the beauty market in Mexico and the United States, offering fragrances, color cosmetics, skincare and toiletries. Betterware operates an asset-light business model with low capital expenditure requirements and has a track record of strong profitability, double-digit revenue growth and free cash flow generation. The company distributes its products in Mexico and the US.
In September 2025, Betterware’s stock price declined by 2.4% compared to August. Year-to-date, the shares are up 16.7%, and since the establishment of the DSCI on February 1, 2020, the stock has gained 38.6%.
The modest pullback in September follows a strong summer performance and comes amid broader market volatility in Mexico and the US. Analysts continue to view Betterware’s fundamentals positively, citing steady revenue growth and disciplined cost management.
However, some continue to highlight challenges around profit margins and interest coverage, factors that investors should monitor closely when evaluating BWMX, especially given the company’s exposure to consumer spending trends and currency fluctuations.
Despite short-term price weakness, Betterware de México declared a special dividend of MXN 200 million (approximately USD 11 million) in August 2025, payable on August 28, 2025, with a record date of August 11, 2025, according to the company’s official press release. This, along with its strong free cash flow and asset-light model, underscores its robust financial position and commitment to shareholder returns, following consistent profitability and stable cash flow generation throughout 2025.
Nu Skin Enterprises, Inc. (NYSE: NUS), together with its subsidiaries, engages in the development and distribution of various beauty and wellness products worldwide. It offers skincare devices, cosmetics and other personal care products, including ageLOC LumiSpa and ageLOC LumiSpa iO; and nutricentials skincare products. The company also provides wellness products, such as LifePak nutritional supplements, ageLOC TR90 weight management system and Beauty Focus Collagen+. In addition, it is involved in the research and product development of skincare products and nutritional supplements. The company sells its products under the Nu Skin, Pharmanex and ageLOC brands through retail stores, website, digital platforms and independent direct sellers and marketers, as well as a service center. Nu Skin Enterprises, Inc. was founded in 1984 and is headquartered in Provo, Utah.
In September 2025, Nu Skin’s stock declined by 0.7% compared to August. Year-to-date, the shares are up 75.3%, and since the establishment of the Direct Selling Capital Advisors Index (DSCI) on February 1, 2020, the stock has declined 48.8%. The stock traded in a 52-week range of $5.32 to $14.62 as of the end of September. Analysts maintain a 23.25% growth estimate for 2025.
The modest decline in September follows an exceptional August rally driven by strong Q2 results and heightened investor optimism. Analysts view the slight pullback as a natural market correction after significant summer gains. Despite the dip, Nu Skin continues to benefit from improving profitability metrics and growing institutional interest.
The company maintained its quarterly dividend of $0.06 per share, consistent with its ongoing shareholder return strategy. Governance remains a focus area, as ISS continues to assign a QualityScore of 3/10, reflecting ongoing scrutiny around board structure and shareholder rights.
Looking ahead, analysts remain cautiously optimistic, emphasizing Nu Skin’s progress in product innovation—including the Prysm iO launch—and its efforts to strengthen distributor engagement and incentives. These initiatives, coupled with robust demand in core markets, are expected to support sustained growth momentum through the second half of 2025.
Herbalife Nutrition, Inc. (NYSE: HLF), together with its subsidiaries, provides health and wellness products across North America, Mexico, South and Central America, Europe, the Middle East, Africa, China and Asia Pacific. The company offers products in the areas of weight management; targeted nutrition; energy, sports and fitness; outer nutrition; and literature, promotional and other materials. Herbalife’s offerings include protein shakes, meal replacements, healthy snacks, metabolism-boosting teas, dietary supplements with natural ingredients, skincare and body care products and energy drinks. These are sold through sales representatives, independent service providers and company-operated retail stores and platforms. Founded in 1980 and headquartered in Los Angeles, California, the company changed its name from Herbalife Nutrition Ltd. to Herbalife Ltd. in April 2023.
In September 2025, Herbalife’s stock declined by 13% compared to August, moderating its earlier summer momentum. Year-to-date, the shares are up 27.2%, while since the launch of the Direct Selling Capital Advisors Index (DSCI) on February 1, 2020, the stock remains down 73.7%.
The decline reflects a period of market consolidation following a strong August (+6.3%), when sentiment improved on earnings outperformance and debt-reduction progress. According to Yahoo Finance and other analyst coverage, investors remain focused on Herbalife’s ability to sustain profitability amid slowing global demand and higher financing costs. Analysts maintain that the company’s valuation remains attractive, trading at roughly 3.5× forward earnings, though near-term volatility may persist.
During September, Direct Selling News highlighted Herbalife’s ongoing progress in sustainability and ESG initiatives. On September 3, 2025, DSN reported that Herbalife India was honored with the Sustainable Supply Chain Award at the BIGBOX India 2025 Summit, recognizing its commitment to responsible sourcing and operational efficiency. This recognition underscores the company’s efforts to enhance its global reputation and align its strategy with long-term sustainability goals.
Analysts continue to monitor the transition under CEO Stephan Gratziani, the first distributor to lead the company since its founder, while Executive Chairman Michael O. Johnson provides continuity at the board level. Management’s focus remains on digital engagement initiatives (e.g., Pro2col App and MultiBurn Subscription), aimed at strengthening distributor productivity and recurring revenue streams.
While September marked a setback in share performance, Herbalife’s improving fundamentals, disciplined balance-sheet management and growing ESG profile provide a constructive long-term outlook.
For more insights, read the article: Herbalife India Honored with Sustainable Supply Chain Award
Medifast, Inc. (NYSE: MED), through its subsidiaries, operates as a health and wellness company offering habit-based, coach-guided lifestyle solutions focused on weight management and obesity support in the United States. The company’s flagship brand, OPTAVIA, delivers clinically-supported weight loss programs, GLP-1 support plans, and a wide variety of food products—such as bars, shakes, soups, cereals and snacks—complemented by one-on-one coaching, digital tools and community support. Medifast was founded in 1980 and is headquartered in Baltimore, Maryland. Its products are sold via point-of-sale transactions and ecommerce.
In September 2025, Medifast shares declined by 1.4% compared to August, extending the company’s recent volatility following a modest rebound in the prior month. Year-to-date, the stock is down 21.5%, and since the DSCI’s inception, it has fallen 82.6%.
During the month, Direct Selling News highlighted new clinical data showing that participants in Medifast’s OPTAVIA 5 & 1 Plan maintained 98% lean body mass after 16 weeks, reinforcing the brand’s emphasis on metabolic health beyond traditional weight loss. The company also promoted its annual “Healthy Habits for All Week” initiative, engaging the OPTAVIA community and more than 30,000 independent coaches to promote healthy lifestyle habits in local communities.
Operationally, Medifast continues to advance initiatives such as the Premier Plus autoship program and Edge incentive program to enhance coach engagement and productivity. Financially, the company maintains its Q3 2025 guidance of $70–90 million in revenue and EPS between $0.00 and –$0.60, reflecting ongoing volume challenges compared to prior years.
Focus remains on stabilizing the coach network, improving operational efficiency, and expanding digital tools to support client retention and program scalability. Investors continue to monitor management’s progress in executing its metabolic health strategy, particularly in the evolving landscape shaped by GLP-1 medications.
For more insights, read the article: New Data Shows Medifast 5 & 1 Plan Improves Metabolic Health Outcomes
USANA Health Sciences, Inc. (NYSE: USNA) develops, manufactures and sells science-based nutritional, personal care and skincare products across the Asia Pacific, the Americas and Europe. The company operates through two segments: Direct Selling and Hiya Direct-To-Consumer. Its product lineup includes USANA Nutritional Optimizers for cardiovascular, skeletal and digestive health; Essentials/CellSentials—vitamin and mineral supplements for all ages beginning at 13 months; and food products such as meal replacement shakes and snack bars for healthy weight management, digestive health and hydration. USANA also offers the Celavive skincare line tailored for various skin types and ethnicities, as well as online tools and business materials for associates. Products are sold through retail, subscription-based models and direct selling. The company holds research collaboration agreements with the Beijing University of Chinese Medicine and the National Sports Training Bureau. USANA was founded in 1992 and is headquartered in Salt Lake City, Utah.
In September 2025, USANA’s stock declined by 13.3% compared to August, reversing part of the previous month’s rebound. Year-to-date, shares are down 22.9%, and since the DSCI’s inception, the stock has fallen 58.2%.
The decline followed mixed investor sentiment as the company continued to navigate challenging market conditions across several key regions. Following its August Global Convention, where USANA introduced new products such as Circulate+, Core Aminos and Marine Collagen Peptides, as well as additions to its Celavive skincare line, September trading reflected consolidation after strong short-term gains.
Operationally, the company remains focused on strengthening its global field engagement and implementing enhancements to its compensation plan, aiming to increase associate activity and customer retention. Meanwhile, efforts to modernize brand messaging and expand direct-to-consumer initiatives continue to support long-term positioning.
While Q2 2025 results showed revenue of $235.9 million (+10.8% YoY) and net income of $10.4 million (EPS $0.52), market expectations for Q3 remain cautious due to ongoing macroeconomic headwinds and competitive pressures within the nutrition and wellness category. USANA’s debt-free balance sheet and $151 million in cash provide financial stability as the company executes its growth strategy and adapts to evolving consumer trends.
eXp World Holdings, Inc. (NASDAQ: EXPI), together with its subsidiaries, provides cloud-based real estate brokerage services for residential homeowners and homebuyers. The company operates through three segments: North American Realty, International Realty, and Other Affiliated Services. It acts as a licensed broker for processing residential and commercial real estate transactions and provides other real estate support services. In addition, the company offers FrameVR.io, a web-accessible proprietary technology providing immersive 3D platforms; SUCCESS Magazine and its related media properties, which offer training, classes, resources and tools under the SUCCESS brand; and SUCCESS Space, a co-working solution that provides rental workspaces, professional development coaching, media production services, virtual-world communications technology, and full-service cafes.The company operates primarily in North America, Canada, the United Kingdom, Australia, South Africa, India, Mexico, Portugal, France, Brazil, Italy, Hong Kong, Colombia, Spain, Israel, Panama, Germany, the Dominican Republic, Greece, New Zealand, Chile, Poland, Dubai and recently expanded into Japan, with additional international markets across Europe and Asia. eXp World Holdings, Inc. was formerly known as eXp Realty International Corporation and changed its name in May 2016. The company was incorporated in 2008 and is headquartered in Bellingham, Washington.
In September 2025, eXp’s stock increased by 2.7% compared to August, marking its second consecutive monthly gain. For the first nine months of 2025, the stock is down 3.4%, while since the DSCI’s inception, shares have appreciated 132.6%, maintaining one of the strongest long-term performances among index constituents.
Following a steady August, September trading reflected cautious optimism as investors continued to digest mixed Q2 2025 results. The company previously reported revenue of $1.3 billion, up 1% year-over-year, supported by stable transaction volume and moderate growth in real estate sales volume to $52.5 billion. Profitability, however, remained under pressure, with a net loss of $2.3 million (–$0.01 EPS) and adjusted EBITDA of $11.2 million, though operating cash flow of $36.1 million underscored solid liquidity and consistent cash generation.
Operationally, the company continued to face agent count headwinds, with a 5% decline to 82,704 agents, while closed transactions fell 2% to 118,612. Liquidity remained strong at $94.6 million in cash and equivalents, and capital returns continued, totaling $32.6 million in Q2, including $24.9 million in share repurchases and $7.7 million in dividends. A Q3 cash dividend of $0.05 per share was declared and paid in late August.
Strategically, eXp advanced its long-term growth initiatives, investing in global expansion, platform enhancements and new agent engagement programs such as the co-sponsor initiative, aimed at improving collaboration and recruitment efficiency. The company continues to leverage its scalable, cloud-based model and revenue-sharing structure to support global growth while addressing challenges from agent attrition and competitive market dynamics.
Investor sentiment in September remained constructive, supported by strong long-term fundamentals, recurring cash generation, and disciplined shareholder distributions. Key watchpoints moving forward include agent retention trends, international expansion performance, and monetization of affiliated ventures such as SUCCESS and FrameVR.io as eXp positions for growth into late 2025.
Primerica, Inc. (NYSE: PRI), together with its subsidiaries, provides financial products and services to middle-income households in the United States and Canada. The company operates in three segments: Term Life Insurance; Investment and Savings Products; Senior Health; and Corporate and Other Distributed Products. The Term Life Insurance segment underwrites individual term life insurance products. The Investment and Savings Products segment provides mutual funds and various retirement plans, managed investments, variable and fixed annuities and fixed indexed annuities; and offers segregated funds. The Corporate and Other Distributed Products segment provides mortgage loans; prepaid legal services that assist subscribers with legal matters, such as drafting wills, living wills and powers of attorney, trial defense and motor vehicle-related matters; ID theft defense services; auto and homeowners’ insurance; home automation solutions; and insurance products, including supplemental and accidental death and disability insurance. It distributes and sells its products through licensed sales representatives. Primerica, Inc. was founded in 1927 and is headquartered in Duluth, Georgia.
In September 2025, Primerica’s stock price increased by 2.5% compared to August, extending its upward trend and outperforming the broader DSCI. For the first nine months of 2025, the stock rose 1.8%. Since the inception of the DSCI on February 1, 2020, PRI has appreciated 152.1%, marking the strongest long-term performance among all index constituents.September’s performance reflected continued investor confidence in Primerica’s stable business model, strong underwriting discipline and the resilience of its middle-income client base. The company continued to benefit from its diversified financial services platform, particularly the Term Life Insurance and Investment & Savings Products segments, which remained the primary growth drivers.
Operationally, the company built upon the positive momentum of its Q2 2025 results released earlier in the year, which exceeded analyst expectations for both revenue and earnings. Revenue reached approximately $793 million, while adjusted earnings per share came in over 5% above consensus. Year-over-year, life-licensed sales representatives grew by 5%, term life adjusted direct premiums increased by 5%, and net premiums rose 4%, underscoring the continued strength of Primerica’s core insurance business.
Primerica’s Investment & Savings Products (ISP) segment maintained double-digit growth in client asset values, supported by improved market conditions and steady inflows from long-term savings plans. The firm’s conservative underwriting standards and robust capital reserves continue to serve as a buffer against macroeconomic headwinds, positioning Primerica favorably within the financial services sector.
The company also released its latest Household Budget Index™ (HBI™) update in late September, reflecting a stable purchasing power among middle-income families despite persistent cost-of-living pressures. The August HBI reading showed households maintaining spending capacity as wage growth offset inflationary pressures, particularly in categories such as food, energy and healthcare.
Analysts remain constructive on the stock. Zacks continues to rate Primerica Rank #2 (Buy), citing its disciplined financial management, consistent earnings delivery and durable demand across product lines. While inflation and interest rate uncertainty remain potential constraints on short-term growth, Primerica’s consistent profitability and expanding client base support a favorable long-term outlook.
Overall, September reinforced Primerica’s reputation as a stable, well-managed and long-term outperforming company within the DSCI, reflecting the enduring strength of its brand, its focus on middle-income families, and its commitment to conservative growth.
Oliveda International, Inc. (OTC: OLVI) was founded in 2003 and leverages over 20 years of experience in: (1) the management and organic certification of mountain olive trees; (2) extracting award-winning extra virgin olive oils; (3) extracting hydroxytyrosol, a bioactive compound with antioxidant, anti-inflammatory, anticancer and skin/eye protective properties; and (4) producing and distributing cosmetic and holistic waterless products derived from the olive tree.
Oliveda and its subsidiaries—Olive Tree People Inc., Olive Tree People Europe AG, Oliveda Deutschland GmbH, and Olive Tree Farmers SL—were established by German real estate investor Thomas Lommel. The group has created a distinctive market position through innovations such as its Olive Tree Therapy “10 Years in 14 Days,” olive matcha (from ground olive leaves), and a hydroxytyrosol-based coffee alternative. Beyond product lines, Lommel is active in mindfulness via olive tree sound bath meditations and broadcasting olive tree frequencies globally.
Oliveda’s distribution includes strong online sales and a broad European retail network. In Germany, Oliveda Deutschland GmbH operates flagship stores in Berlin and Düsseldorf. Its brand portfolio includes Oliveda, LA Dope, Re:connected to Nature, The Intuition of Nature, and Olive Mush. Via the Thomas Lommel Foundation, unused water from its waterless beauty production is donated to communities in Africa through onsite well construction.
In September 2025, Oliveda’s stock price declined by 29.4% compared to August. Over the first nine months of 2025, the cumulative decline reached 75.5%.
While no public figures for full-month September operations were announced, the company continued its prior strategic trajectory. During the first half of 2025, Olive Tree People (OLVI’s waterless beauty subsidiary) reported 70% growth, building on its extraordinary 3,000% growth in 2024 and surpassing $100 million in US sales.
In early September, Oliveda announced that its Olive Rose NO MAKEUP line would debut at New York Fashion Week (Sept 12–15), with its hydroxytyrosol-based products applied by 75 makeup artists on more than 150 models. Following this appearance, the full Olive Rose collection—including Skin Tint Serum, Blush, Contour, Concealer, Mascara, Eye Shadow, Lip Butter, Primer and Setting Spray—was scheduled for presentation to nearly 70,000 waterless beauty consultants in the US and Canada at the North American Convention in Los Angeles in early October.
Oliveda also reaffirmed its longer-term investments in infrastructure. The company confirmed continued acquisition of olive groves and the construction of a modern processing mill in partnership with the municipality of Arroyomolinos de León.
In terms of sentiment and outlook, the sharp decline in September suggests increased volatility and investor risk perception. Nonetheless, the company’s prior growth in its beauty arm and its pipeline of launches and global expansion remain central pillars of its narrative. The participation in New York Fashion Week and the Olive Rose rollout may help restore market confidence, but near-term pressure on the stock remains significant.
Analyst coverage is limited given the OTC status of OLVI, but the fundamentals and strategic positioning continue to attract attention from investors seeking exposure to innovative beauty and wellness companies with integrated agritech origins.
Overall, September marked a challenging month for Oliveda, with pronounced downward pressure on its share price. However, underlying initiatives in brand launches, infrastructure investment and continued global expansion continue to frame its long-term growth story.
For more insights, read these articles: Oliveda Cosmetics Line to Appear at New York Fashion Week, Oliveda International Hosts Olive Tree Art Installation in LA
The Beachbody Company, Inc. (NYSE: BODI) operates as a fitness and nutrition company in the United States and internationally. The company offers Beachbody on Demand, a subscription streaming service providing fitness programs such as P90X, Insanity and 21 Day Fix; nutrition programs including Portion Fix and 2B Mindset; and nutritional products like Shakeology shakes and Beachbody Performance supplements.
The company also faces legal challenges in California, where efforts are underway to reclassify independent consultants as employees, which may impact its direct selling model.
In September 2025, the stock price increased by 7.1% compared to August 2025. For the first nine months of 2025, the stock price declined by 4.1%, indicating moderate recovery momentum following the strong August rebound.Throughout September, investor sentiment toward Beachbody remained cautiously optimistic, supported by continued progress in the company’s transformation strategy. Following its decision to transfer stock listing from the NYSE to NASDAQ, Beachbody emphasized that the move aligns with its efforts to enhance visibility, streamline operations and attract new investors. The transition is also seen as part of the company’s broader restructuring plan focused on achieving positive free cash flow for the full year 2025, a milestone not reached since 2020.
According to Yahoo Finance, analysts have highlighted the company’s improved cost discipline and its success in lowering the breakeven point through significant operating expense reductions. Beachbody’s focus on digital growth and the relaunch of its flagship Shakeology brand continue to underpin its long-term strategy.
Meanwhile, Direct Selling News noted that the company’s renewed emphasis on product innovation, simplified compensation structure and technology-driven community engagement reflects a broader industry trend toward hybrid fitness and wellness models. Beachbody’s management continues to position the company as a “modern wellness platform,” combining fitness, nutrition and personal development tools to strengthen customer retention and distributor engagement.
Overall, September performance demonstrated steady investor confidence and stabilization following prior months of volatility. The company’s improved cash flow outlook, reduced expenses and strategic repositioning within the digital wellness space contributed to a more positive market tone, though challenges related to declining revenue and regulatory scrutiny remain key factors to monitor going into Q4 2025.
The Real Brokerage Inc. (NASDAQ: REAX) was Founded in 2014, The Real Brokerage is a technology-driven, asset-light real estate brokerage that empowers agents through a cloud-based platform, AI tools and fintech solutions. Operating across the U.S. and Canada, the company combines commission-based revenue, innovative agent incentives, and strategic acquisitions to disrupt traditional brokerage models and drive scalable growth.
In September 2025, The Real Brokerage’s stock remained relatively stable compared to August, consolidating the strong gains achieved earlier in the year. Year-to-date, the shares continued to reflect solid performance momentum following the company’s first-ever quarterly net profit in Q2 2025. Since its inclusion in the DSCI on February 1, 2020, the stock has delivered robust relative growth, supported by ongoing expansion and profitability improvements.
During the month, The Real Brokerage surpassed the milestone of 30,000 agents across the United States and Canada, underscoring the scalability of its asset-light business model. The company also announced the addition of The Collective Group, a top-producing real estate team from Washington with over $575 million in lifetime sales, and the Landmark Group, an award-winning team of approximately 250 agents in the Mid-Atlantic region. These partnerships reinforced Real’s growing presence in both luxury and regional markets, while enhancing agent productivity and engagement across its cloud-based platform.
Operationally, the company maintained a strong pace of agent recruitment and digital adoption, building on its record Q2 results, which included $540.7 million in revenue (+59% YoY), $47.9 million in gross profit (+50% YoY) and adjusted EBITDA of $20.0 million. Analysts noted that Real’s focus on technology integration and strategic team acquisitions continues to differentiate its model from traditional brokerages, driving network effects and sustained earnings potential.
While September did not bring major share price movements, the company’s operational updates highlighted continued strength in fundamentals. Analysts remain constructive on Real’s long-term outlook, emphasizing the combination of profitability, scalability and innovation as key drivers for future performance.
Below are two summary diagrams on the direct selling large cap companies.
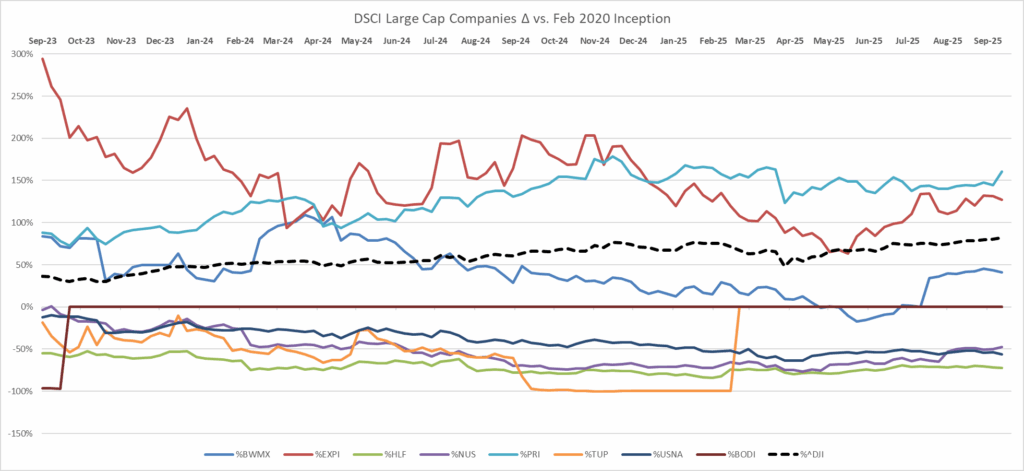
Small Cap
Below are the September information for the two largest small cap companies, Nature’s Sunshine and LifeVantage.
Nature’s Sunshine Products, Inc. (NASDAQ: NATR), a natural health and wellness company, manufactures and sells nutritional and personal care products in Asia, Europe, North America, Latin America and other international markets. The company provides general health products related to blood sugar support, bone health, cellular health, cognitive function, joint health, mood, sexual health, sleep, sports and energy and vision; immune products; cardiovascular products; and digestive products. It also offers personal care items including oils and lotions, aloe vera gel, herbal shampoo, herbal skin treatment, toothpaste and skin cleansers, as well as weight management products. The company markets its products under the Nature’s Sunshine Products and Synergy WorldWide brands directly to customers and through a sales force of independent consultants. Nature’s Sunshine Products, Inc. was founded in 1972 and is headquartered in Lehi, Utah.
In September, NATR’s stock price declined by 9.7% compared to August 2025, partially reversing the strong 20.3% gain recorded the prior month. For the first nine months of 2025, the stock increased by 3.8%, marking a modest recovery from earlier-year weakness. Since the inception of the DSCI, NATR has gained 95.9%, maintaining one of the stronger long-term performances among small-cap direct selling companies.
While no new quarterly earnings were released in September, the company’s Q2 2025 financial results (reported in August) remain the most recent benchmark of performance. NATR reported net sales of $114.8 million, up 4% year-over-year, and adjusted EBITDA of $11.3 million, an 8% increase compared to Q2 2024. GAAP net income rose sharply to $5.3 million ($0.28 per diluted share), compared to $1.3 million ($0.07) in the prior-year quarter. Gross profit margin improved slightly to 71.7% from 71.4%, while operating income declined to $4.3 million from $5.6 million due to higher SG&A expenses associated with expanded digital marketing, compensation and one-time costs.
The company continued to demonstrate strong financial discipline, ending Q2 with $81.3 million in cash and no debt, and having repurchased over 1 million shares for approximately $12.4 million in the first half of 2025. Management reaffirmed confidence in full-year prospects, maintaining raised guidance for net sales between $460 million and $475 million and adjusted EBITDA between $41 million and $45 million.
Operationally, momentum remained solid across Japan and Central Europe, with continued strength in digital channels and autoship programs. No major insider transactions were reported in September, following the sale of roughly 9,700 shares by EVP Bryant Yates in late August.
The September decline is viewed largely as a market correction following the sharp rebound in August, reflecting profit-taking and sector-wide volatility among small-cap consumer stocks. Despite short-term pressure, Nature’s Sunshine’s improved margins, strong cash position, share repurchases and reaffirmed full-year guidance support continued investor confidence. Analysts continue to highlight the company’s undervalued status and solid fundamentals, maintaining a generally bullish long-term outlook on NATR’s growth trajectory and profitability.
LifeVantage Corporation (NASDAQ: LFVN) engages in the identification, research, development, formulation and sale of advanced nutrigenomic activators, dietary supplements, nootropics, pre- and pro-biotics, weight management and skin and hair care products. It offers Protandim, a dietary supplement; LifeVantage Omega+, a dietary supplement that combines DHA and EPA Omega-3 fatty acids, Omega-7 fatty acids and vitamin D3; LifeVantage ProBio, a dietary supplement to support gut health; LifeVantage IC Bright, a supplement to support eye and brain health, reduce eye fatigue and strain, support cognitive functions and support normal sleep patterns; LifeVantage Daily Wellness, a dietary supplement designed to strengthen immune health; LifeVantage Rise AM & Reset PM System that provides the body with the right nutrients; LifeVantage D3+, a dietary supplement that provides vitamin D3, vitamin K2, magnesium, calcium and other trace minerals to support a balanced immune system, strong bones and cardiovascular health; PhysIQ Fat Burn to support weight management; PhysIQ Prebiotic is a dietary supplement designed to support the good bacteria in the gut and a healthy microbiome; Petandim for Dogs, a supplement to combat oxidative stress in dogs; and Axio, a nootropic energy drink mix. The company also provides anti-aging skincare products, including liquid collagen, facial cleansers, eye cream, moisturizing cream, sunscreen, perfecting lotions, hand creams as well as hair care products, such as invigorating shampoos, nourishing conditioners and scalp serums under the TrueScience brand name. It sells its products through its website and network of independent consultants in the United States, Mexico, Japan, Australia, Hong Kong, Canada, Thailand, the United Kingdom, the Netherlands, Germany, Taiwan, Austria, Spain, Ireland, Belgium, New Zealand, Singapore and the Philippines. The company also launched Evolve Compensation Plan and other LV360 initiatives into the Philippines, Taiwan, Hong Kong and Singapore. The company is based in Lehi, Utah.
In September, LifeVantage’s stock price declined by 25.2% compared to August 2025, marking a significant reversal from the previous month’s modest gain. For the first nine months of 2025, the stock price has declined 44.3% year-to-date. Since the February 1, 2020 establishment of the DSCI, LFVN has decreased by 18.1%.
Recent developments include the company’s release of fiscal Q4 2025 results in early September, reporting net sales of $55.1 million, an increase of 12.6% year-over-year. Gross margin improved slightly to 79.9%, while adjusted EBITDA remained stable at $4.8 million. Earnings per share (EPS) came in at $0.17, slightly above analyst expectations of $0.16. The company ended the quarter with $20.2 million in cash and no debt and returned $18.6 million to shareholders through dividends and share repurchases, including a $0.045 per share dividend declared in August.
Operationally, LifeVantage continued to pursue international growth through the rollout of its MindBody GLP-1 System in Japan, Australia and Europe. The company also acquired assets from LoveBiome, a microbiome wellness company, further strengthening its leadership position in gut health and expanding its nutrigenomic product portfolio. The integration of LoveBiome aligns with LifeVantage’s strategic shift toward holistic wellness and its “Activate Wellness” philosophy, enhancing its product diversification and scientific credibility within the direct selling space.
The steep stock decline in September followed a period of investor optimism in August and likely reflects broader market volatility, profit-taking after recent gains and cautious sentiment toward small-cap wellness and direct selling stocks. While revenue and EPS results exceeded prior-year levels, top-line growth modestly lagged consensus expectations, potentially tempering investor enthusiasm.
Despite these short-term pressures, LifeVantage remains financially sound, supported by strong margins, a debt-free balance sheet and disciplined capital allocation. The company’s continued innovation in gut health, expanding international presence and focus on operational efficiency provide a foundation for long-term growth. However, sustained improvement in investor sentiment will depend on consistent revenue execution, successful integration of LoveBiome assets and resilience in a competitive and evolving global wellness market.
For more insights, read the article: LifeVantage Reports Fiscal Q4 Financial Results, LifeVantage Acquires LoveBiome
Below are two summary diagrams on the direct selling small cap companies.

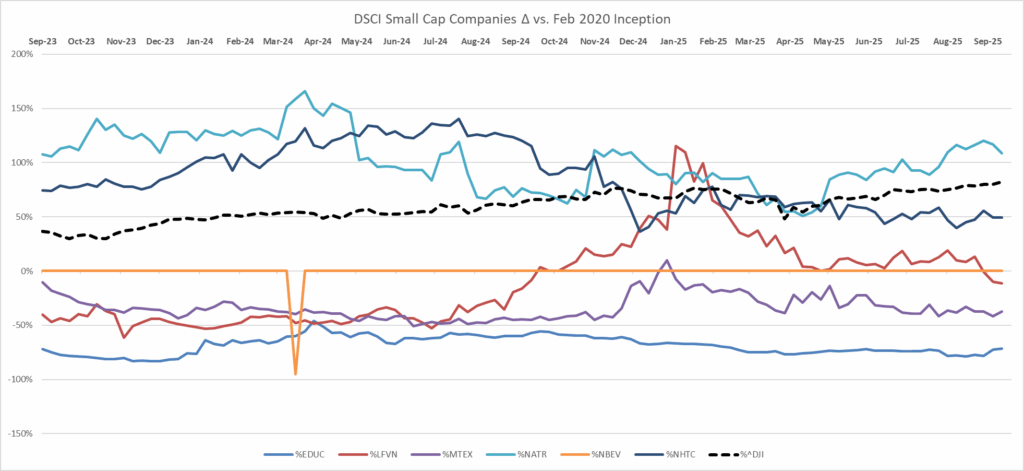
Short Interest Data & Analysis
The following chart is an aggregate index of “days to cover” among the entire tracking set. Days to cover (DTC) is a measurement determined by dividing the total outstanding short interest by average daily trading volume.
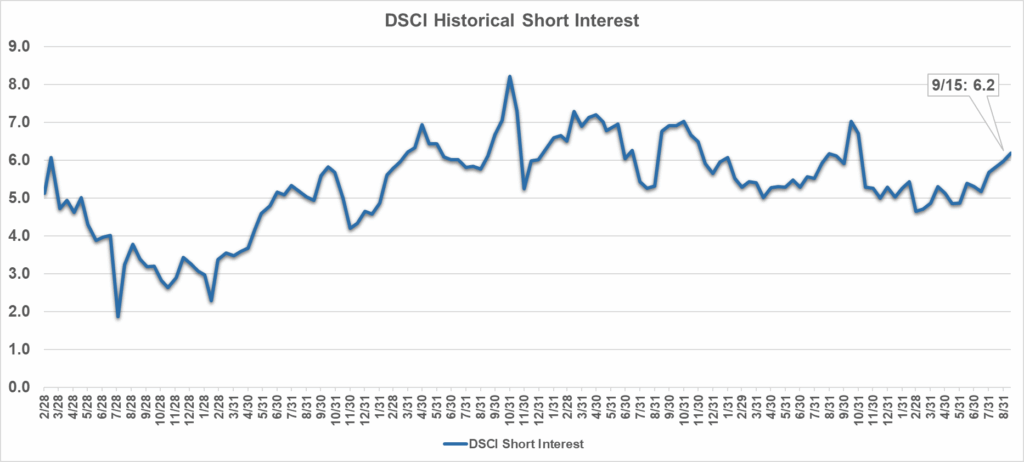
As indicated in the chart, short interest in DSCI stocks was 6.2 days as of September 15, 2025. Short interest can be a difficult indicator to analyze. On the one hand, an increase in short interest can be a bearish sign in that it indicates an increased view among investors that a stock is likely to decline based on any number of factors, such as a belief that the company’s fundamentals are deteriorating or that it has run too far, too fast. On the other hand, as a stock moves higher, a significant short interest can serve as extra fuel on the fire as investors scramble to “buy to cover” their short positions and mitigate losses.
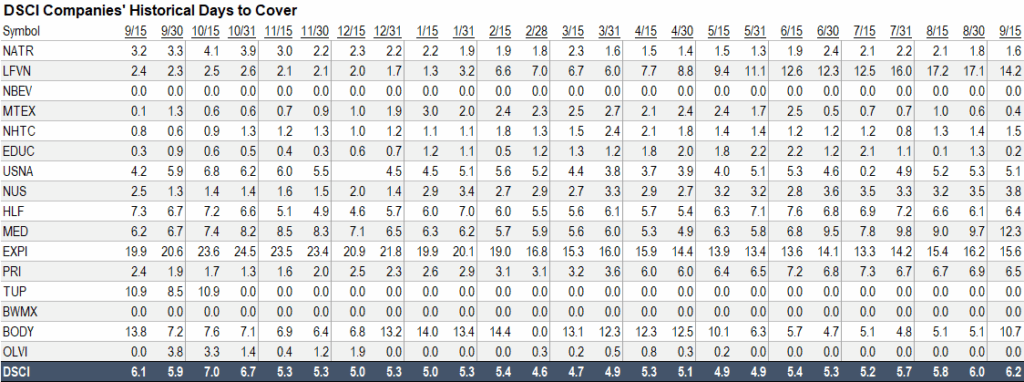
Analyst Sentiment Index
The DSCA Analyst Sentiment Index is a consensus tracking tool that aggregates and averages the recommendations of all covering analysts across all public direct selling companies.
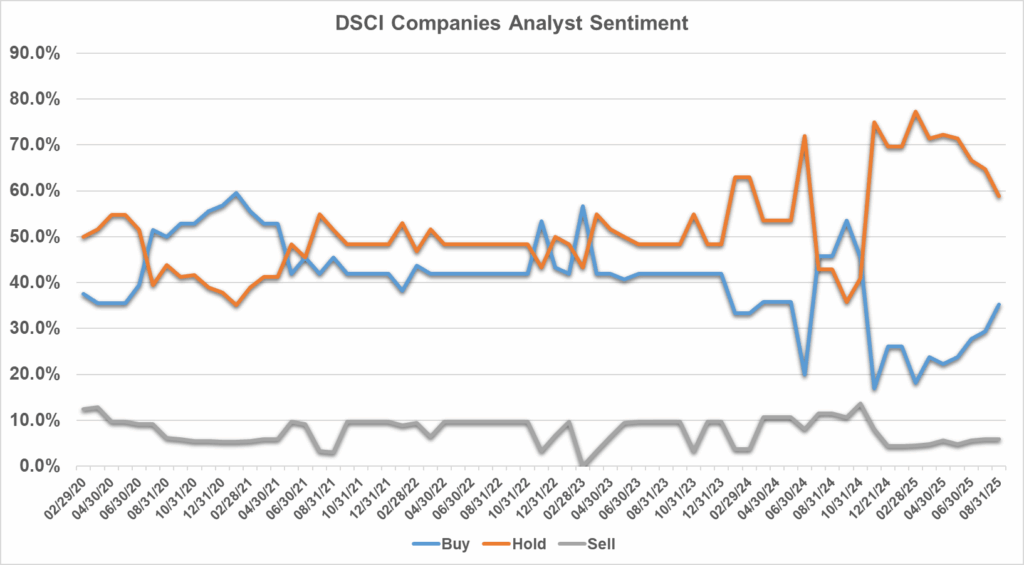
-
August 2025
Brought to you by Direct Selling Capital Advisors
Direct Selling Index mirrors the DJIA for the month of August 2025
The Direct Selling Capital Advisors Direct Selling Index (DSCI) rose 3.2% in August compared to July 2025, underperforming the Dow Jones Industrial Average (DJIA), which gained 4.0% over the same period.
Year-to-date, the DSCI has advanced 7.1% in the first eight months of 2025. Since its inception, the index has delivered a cumulative return of 79.2%, underscoring the sustained strength and resilience of the direct selling channel over time.


Market and Economic Environment
Consumer sentiment weakened in August. A New York Fed survey showed that the probability of finding a new job dropped to 44.9%, the lowest since 2013. Payroll growth slowed to just 22,000 jobs, while the unemployment rate ticked up to 4.3%, its highest level in four years.
Tariff-related inflation concerns resurfaced mid-month. Core producer prices rose 0.9% month-over-month, the sharpest increase in over three years, briefly unsettling equity markets and pushing bond yields higher.
Bond markets saw notable moves as well. The 10-year US Treasury yield ended August at 4.22%, down 14 basis points from July. Credit markets remained strong, with corporate bond spreads tightening to historically low levels of about 0.78 percentage points, reflecting investor confidence in corporate creditworthiness.
The Federal Reserve kept rates unchanged at its early August meeting. However, at the Jackson Hole Symposium, Chair Jerome Powell signaled that conditions “may warrant” interest-rate cuts later in the year. Markets are now pricing in two 0.25% cuts, with the first expected as soon as September.
Equity markets posted broad gains in August. The S&P 500 rose 1.9%, the DJIA gained 4.03% and the Nasdaq added 1.6%. International developed markets rose 4.1%, while emerging markets gained 1.2%.
Direct Selling Industry Developments
A study released in late August by the Direct Selling Association (DSA) highlighted the industry’s continued relevance:
- US retail sales in direct selling totaled $34.7 billion in 2024.
- 34.3 million individuals participated as preferred customers or discount buyers.
- Industry perception improved by 21% since 2019, with 70% of consumers expressing favorable views toward supporting local business owners.
Companies are increasingly leveraging mobile loyalty apps to strengthen customer retention, with personalized rewards and experiences driving deeper brand engagement.
Beyond the US, international opportunities remain strong. Germany, for example, is projected to see 4.8% growth in direct selling in 2025, supported by AI-driven innovation, favorable consumer trends and a stable legal framework.
Looking Forward
The direct selling channel continues to face both challenges and opportunities.
- Labor market softness may pressure discretionary spending.
- Potential Fed rate cuts could support both equities and consumer confidence.
- Tariff-driven inflation risks remain a key watchpoint.
- Positive consumer sentiment and the growth of omnichannel strategies suggest that well-positioned companies in the sector can continue to deliver strong performance.
- International expansion, particularly in Germany and other developed markets, provides additional growth avenues.
- Companies integrating mobile loyalty programs are likely to strengthen customer retention and brand engagement.
The Direct Selling Capital Advisors Index (DSCI) is a market capitalization weighted index of all domestic public direct selling companies with a market capitalization of at least $25 million. The index is rebalanced monthly, and no single issue is permitted to represent more than 20% of its total value. In such an event, the excess weighting would be redistributed among the other index components.
For more insights, read the articles: DSA Releases 2025 Growth & Outlook Study Results, Brand Loyalty in Your Pocket and Why Direct Selling Companies Should Consider Entering the German Market
Large Cap
Note: For the purposes of this report, Direct Selling Capital considers companies with a market capitalization in excess of $1 billion “Large Cap.”
Betterware de Mexico (NASDAQ: BWMX), founded in 1995, is the leading direct-to-consumer company in Mexico focused on innovative products related to household organization, practicality, space-saving and hygiene. Through the acquisition of JAFRA on April 7, 2022, the company expanded into the beauty market in Mexico and the US, offering fragrances, color cosmetics, skincare and toiletries. The combined business operates an asset-light model with low capital expenditure, consistent profitability, double-digit revenue growth and strong free cash flow generation. Today, Betterware distributes its products in both Mexico and the United States.
In August 2025, Betterware’s stock price rose 1.7% versus July. Year-to-date, the shares are up 19.6%, and since the establishment of the DSCI on February 1, 2020, the stock has gained 42.0%.
On August 1, the company declared a special dividend of $200 million, underscoring its strong financial position and commitment to shareholder returns.
While stock performance has been positive, analysts continue to highlight challenges around profit margins and interest coverage, factors that investors should monitor closely when evaluating BWMX.
Nu Skin Enterprises, Inc. (NYSE: NUS), together with its subsidiaries, engages in the development and distribution of various beauty and wellness products worldwide. It offers skincare devices, cosmetics and other personal care products, including ageLOC LumiSpa and ageLOC LumiSpa iO; and nutrition skincare products. The company also provides wellness products, such as LifePak nutritional supplements, ageLOC TR90 weight management system and Beauty Focus Collagen+. In addition, it is involved in the research and product development of skincare products and nutritional supplements. The company sells its products under the Nu Skin, Pharmanex and ageLOC brands through retail stores, website, digital platforms and independent direct sellers and marketers, as well as a service center. Nu Skin Enterprises, Inc. was founded in 1984 and is headquartered in Provo, Utah.
In August 2025, Nu Skin’s stock surged 45.2% versus July, lifting its year-to-date performance to +76.6%. Since the launch of the DSCI in February 2020, however, the shares have declined 64.5%. The stock traded in a 52-week range of $5.32–$12.41 as of the end of August. Analysts project a 23.25% growth estimate for 2025.
Momentum in August followed stronger-than-expected Q2 earnings, with EPS and margins exceeding forecasts. Institutional interest also grew after Stonegate Capital Partners initiated coverage, citing profitability improvements and the potential of Rhyz Manufacturing.
Nu Skin maintained its quarterly dividend of $0.06 per share, payable in September. However, insider selling by Director Daniel W. Campbell (over 32,000 shares) created questions about insider confidence, even as institutional ownership remains robust at ~75%.Governance remains under scrutiny: ISS continues to assign Nu Skin a QualityScore of 3/10, suggesting room for improvement in shareholder rights and board structure. Analysts remain cautiously constructive, focusing on sustaining momentum in H2 2025, with management highlighting product innovation (e.g., Prysm iO launch) and enhanced distributor incentives as key growth drivers.
Herbalife Ltd. (NYSE: HLF) (formerly Herbalife Nutrition, Inc.) provides health and wellness products across North America, Latin America, EMEA, China and the Asia Pacific. The company offers products in the areas of weight management; targeted nutrition; energy, sports and fitness; outer nutrition; and literature, promotional and other items. It also provides weight management products, including meal replacement products, protein shakes, drink mixes, weight loss supplements, healthy snacks and metabolism boosting teas; targeted nutrition products, which comprise functional beverages and dietary and nutritional supplements that contain herbs, vitamins, minerals and other natural ingredients; outer nutrition products, such as facial skin, body and hair care products; and energy, sports and fitness products, including N-R-G tea and energy drink products. In addition, it offers literature, promotional and other materials that comprise start-up kits, sales tools and educational materials. The company sells its products through sales representatives, independent service providers and company-operated retail stores and platforms. The company was formerly known as Herbalife Nutrition Ltd. and changed its name to Herbalife Ltd. in April 2023. Herbalife Ltd. was founded in 1980 and is headquartered in Los Angeles, California.
In August 2025, Herbalife’s stock rose 6.3% compared to July, extending year-to-date gains to +46.2%. Since the creation of the DSCI in February 2020, however, shares have declined 69.8%.
Q2 2025 results showed net sales of $1.3 billion (–1.7% YoY), but EPS of $0.59 beat consensus, reflecting an improved operating margin of 10.5%. Management emphasized debt reduction, with $55 million repaid in the quarter.Strategically, the company advanced its digital initiatives, including the Pro2col app and MultiBurn subscription, aimed at boosting distributor engagement and recurring revenues. Analysts remain cautious on the monetization timeline.
Institutional investors increased positions in August, and Mizuho raised its price target to $9, citing attractive valuation at just 3.5x earnings. Herbalife also strengthened its ESG profile, with Herbalife India winning the Sustainable Supply Chain Award at the BIGBOX India 2025 summit.
Leadership remains a focus: new CEO Stephan Gratziani is the first distributor to lead since the founder, while former CEO Michael O. Johnson continues as Executive Chairman, providing continuity.For more insights, read the article: Herbalife India Honored with Sustainable Supply Chain Award
Medifast, Inc. (NYSE: MED), through its subsidiaries, operates as a health and wellness company offering habit-based, coach-guided lifestyle solutions focused on weight management and obesity support in the United States. The company’s flagship brand, OPTAVIA, delivers clinically supported weight loss programs, GLP-1 support plans and a wide variety of food products, such as bars, shakes, soups, cereals and snacks, complemented by one-on-one coaching, digital tools and community support. Medifast was founded in 1980 and is headquartered in Baltimore, Maryland. Its products are sold via point-of-sale transactions and ecommerce.
In August 2025, Medifast shares gained 1.9% compared to July, a modest rebound after July’s decline. Year-to-date, the stock remains down 20.4%, and since the DSCI’s inception, it has lost 82.3%.
The company is rolling out initiatives such as the Premier Plus auto-ship program and Edge incentive program to drive coach productivity. Focus remains on metabolic health solutions, particularly support for clients using GLP-1 medications.
For Q3 2025, management projects revenue of $70–90 million and EPS in the range of $0.00 to –$0.60, reflecting ongoing challenges versus prior years’ volumes. Stabilizing coach numbers, managing operational efficiency and executing digital strategies remain key investor watchpoints.
USANA Health Sciences, Inc. (NYSE: USNA) develops, manufactures and sells science-based nutritional, personal care and skincare products across the Asia Pacific, the Americas and Europe. The company operates in two segments: direct selling and direct-to-consumer. Its product lineup includes USANA Nutritional Optimizers, including supplements for cardiovascular, skeletal/structural and digestive health; Essentials/CellSentials, including vitamin and mineral supplements for all ages starting from 13 months; and food products, such as meal replacement shakes, snack bars and other related products for healthy weight management, digestive health and energy and hydration. USANA also offers Celavive, a skincare regimen tailored for various skin types and ethnicities and other products, including materials and online tools that support associates in building their business and marketing the company’s products. The company sells its products through retail, subscription-based models, direct selling and online platforms. It maintains research collaboration agreements with the Beijing University of Chinese Medicine and the National Sports Training Bureau. USANA Health Sciences, Inc. was founded in 1992 and is headquartered in Salt Lake City, Utah.
In August 2025, USANA’s stock increased 8.6% from July, partly recovering from earlier weakness. Year-to-date, shares are down 11.1%, and since the DSCI’s inception, they have fallen 51.7%.
Q2 2025 earnings supported the rebound: revenue of $235.9 million (+10.8% YoY) and net income of $10.4 million, with EPS of $0.52, slightly below the prior year but above internal forecasts. The balance sheet remains debt-free, with $151 million cash on hand.
At its August Global Convention, USANA unveiled new products including Circulate+, Core Aminos, Marine Collagen Peptides, and additions to Celavive, while also reformulating legacy items. The launch of a Health Professional Advisory Council further bolstered credibility.
From a technical perspective, August trading showed volatility, with bearish signals such as widening Bollinger Bands and a Marubozu candlestick pattern. Insider selling by Director Gilbert Fuller (~$30,800 worth of shares) also added to caution.For more insights, read the article: USANA Introduces Health Professional Advisory Council
eXp World Holdings, Inc. (NASDAQ: EXPI), together with its subsidiaries, provides cloud-based real estate brokerage services for residential homeowners and homebuyers. The company operates through three segments: North American Realty, International Realty and Other Affiliated Services. It acts as a licensed broker for processing residential and commercial real estate transactions and provides other real estate support services. In addition, the company offers FrameVR.io, a web-accessible proprietary technology providing immersive 3D platforms; SUCCESS magazine and its related media properties, which offer training, classes, resources and tools under the SUCCESS brand; and SUCCESS Space, a coworking solution that provides rental workspaces, professional development coaching, media production services, virtual-world communications technology and full-service cafes.
The company operates primarily in North America, Canada, the United Kingdom, Australia, South Africa, India, Mexico, Portugal, France, Brazil, Italy, Hong Kong, Colombia, Spain, Israel, Panama, Germany, the Dominican Republic, Greece, New Zealand, Chile, Poland, Dubai and recently expanded into Japan, with additional international markets across Europe and Asia. eXp World Holdings, Inc. was formerly known as eXp Realty International Corporation and changed its name in May 2016. The company was incorporated in 2008 and is headquartered in Bellingham, Washington.
In August 2025, EXPI’s stock increased by 0.5% compared to July, easing the year-to-date decline to 5.9%. Since the establishment of the DSCI on February 1, 2020, shares of eXp have appreciated 126.6%, maintaining one of the strongest long-term performances among index constituents.
August trading was relatively muted compared to July’s sharp gains, with investors weighing the company’s Q2 2025 earnings report released on August 1. Revenue rose 1% year-over-year to $1.3 billion, supported by stable transaction volume and a modest uptick in total real estate sales volume to $52.5 billion. However, profitability metrics lagged: the company reported a net loss of $2.3 million, or –$0.01 EPS, missing consensus expectations of +$0.09. Adjusted EBITDA was $11.2 million, and operating cash flow totaled $36.1 million, highlighting continued cash generation despite margin pressures.
Operationally, headwinds were visible. Agent count declined 5% to 82,704, while closed transactions fell 2% to 118,612. Liquidity remained solid at $94.6 million in cash and equivalents, though lower than the prior year due to a $17 million antitrust settlement. The company continued its capital return program, distributing $32.6 million to shareholders during the quarter, including $24.9 million in share repurchases and $7.7 million in dividends. A Q3 cash dividend of $0.05 per share was declared, payable on August 29.
Strategically, eXp reinforced its long-term growth plan by investing in global expansion, platform enhancements, and agent support tools. Management emphasized the scalability of its cloud-based model and its differentiated revenue-sharing incentives, while acknowledging challenges from agent attrition and rising competitive pressures.
From a technical perspective, despite the modest stock gain in August, sentiment remained mixed. Strong five-year returns, positive cash flow and disciplined shareholder distributions underpin long-term optimism, while near-term risks include agent retention, margin compression and earnings volatility. The ability of eXp to stabilize its agent base and translate platform investments into higher transaction growth will be key for regaining momentum into late 2025.
Primerica, Inc. (NYSE: PRI), together with its subsidiaries, provides financial products and services to middle-income households in the United States and Canada. The company operates through three segments: Term Life Insurance; Investment and Savings Products; and Corporate and Other Distributed Products. The Term Life Insurance segment underwrites individual term life insurance products. The Investment and Savings Products segment offers mutual funds, various retirement plans, managed investments, variable and fixed annuities, fixed indexed annuities and segregated funds. The Corporate and Other Distributed Products segment provides mortgage loans; prepaid legal services assisting subscribers with matters such as drafting wills, living wills and powers of attorney; trial defense and motor vehicle-related matters; ID theft defense services; auto and homeowners’ insurance; home automation solutions; and supplemental, accidental death and disability insurance. The company distributes and sells its products through licensed sales representatives. Primerica, Inc. was founded in 1927 and is headquartered in Duluth, Georgia.
In August 2025, the stock price increased by 1.4% compared to July, while year-to-date performance shows a decline of 0.8%. Since the inception of the DSCI on February 1, 2020, PRI has appreciated 145.8%, the strongest long-term performance among index constituents.
August performance was supported by resilience in Primerica’s core middle-income client base and solid Q2 2025 results released earlier in the month. Revenue and earnings both exceeded analyst expectations, with EPS surprising to the upside by over 5% and revenue modestly above consensus. Operationally, the company reported 5% year-over-year growth in its life-licensed sales force, a 5% increase in term life adjusted direct premiums and a 4% increase in net premiums, underscoring the strength of its insurance business. Analysts continue to highlight the firm’s conservative underwriting standards and strong capital reserves as ongoing sources of stability.Primerica also released its latest Household Budget Index™ (HBI) in late August, showing a July reading of 100.1%, up slightly from June and 1% higher than the prior year. According to consulting economist Amy Crews Cutts, wage growth continues to offset rising costs of essentials, though inflation for middle-income households remains above headline CPI levels. This indicates that families remain resilient but continue to face cost-of-living pressures in food, energy and healthcare.
Analyst sentiment remains constructive, with Zacks maintaining a Rank #2 (Buy) rating, placing Primerica in the top tier of its industry. The combination of disciplined financial management, strong underwriting performance and resilient client demand continues to support a favorable long-term outlook, even amid near-term macroeconomic uncertainty.
Overall, August highlighted Primerica’s ability to deliver consistent results and maintain investor confidence despite ongoing economic headwinds, reinforcing its position as a stable, long-term performer within the DSCI.
Oliveda International, Inc. (OTC: OLVI) was founded in 2003 and has more than 20 years of experience in: 1) the management and organic certification of mountain olive trees; 2) the extraction of international award-winning extra virgin olive oils; 3) the extraction of hydroxytyrosol, a compound with antioxidant, anti-inflammatory, anticancer and skin- and eye-protective effects; and 4) the production and distribution of cosmetic and holistic waterless products derived from the olive tree.
Oliveda International, Inc. and its subsidiaries, including Olive Tree People Inc., Olive Tree People Europe AG, Oliveda Deutschland GmbH and Olive Tree Farmers SL, were founded by German real estate investor Thomas Lommel. The group has established a unique market position through innovations such as Olive Tree Therapy “10 years in 14 days,” olive matcha (made from ground olive leaves) and a coffee alternative based on olive leaves and hydroxytyrosol. Lommel is also active in the mindfulness sector with his olive tree sound bath meditations and the broadcast of olive tree frequencies globally.
In addition to online sales and a broad retail network across Europe, Oliveda Deutschland GmbH operates flagship stores in Berlin and Düsseldorf. Its brand portfolio includes Oliveda, LA Dope, Re:connected to Nature, The Intuition of Nature and Olive Mush. Through the Thomas Lommel Foundation, the company donates unused water from its waterless beauty production to communities in Africa by building wells on-site.
Comparing August 2025 to July 2025, the stock price increased by 5.1%. For the first eight months of 2025, the stock declined by 65.2%.
Olive Tree People, OLVI’s waterless beauty subsidiary, continued to build on its 70% growth in the first half of 2025, following extraordinary 3,000% growth in 2024 and surpassing $100 million in US sales. While no new major announcements were made in August, the company remained focused on its expansion strategy: Canadian operations launched in July, European market entry was confirmed for October and preparations are underway for several high-profile initiatives. These include the unveiling of a surprise new brand at the Los Angeles flagship store in October, the launch of a hydroxytyrosol-based pet care brand, “Is that Matty,” in November, and participation in New York Fashion Week in September, where Olive Rose products will be featured by 75 makeup artists on over 150 models.
OLVI also confirmed ongoing investment in its supply chain through the acquisition of additional olive groves and the construction of a modern mill in partnership with the municipality of Arroyomolinos de León. CEO Thomas Lommel reiterated that the direct selling industry is not in decline but is evolving, driven by innovation, sustainable practices and premium product experiences—principles that continue to shape OLVI’s strategy and market leadership.
The Beachbody Company, Inc. (NYSE: BODI) operates as a fitness and nutrition company in the United States and internationally. The company offers Beachbody on Demand, a subscription streaming service providing fitness programs such as P90X, Insanity and 21 Day Fix; nutrition programs including Portion Fix and 2B Mindset; and nutritional products like Shakeology shakes and Beachbody Performance supplements. The company also faces legal challenges in California, where efforts are underway to reclassify independent consultants as employees, which may impact its direct selling model.
In August, the stock price increased by 26.7% compared to July 2025. For the first eight months of 2025, the stock price declined by 10.4%. Recent developments include Q2 2025 financial results showing revenue of $63.9 million, down from $110.2 million in Q2 2024. Digital revenue reached $39.7 million, Nutrition and Other contributed $24.2 million, while Connected Fitness fell to $0.1 million following the discontinuation of bike sales. Operating expenses were reduced to $50.2 million from $85.9 million a year earlier, leading to an improved operating loss of $5.5 million year-over-year. Adjusted EBITDA was $4.6 million, with operating cash flow of $6.6 million in the first half. The company emphasized that results were “better than expected” and reaffirmed its goal of achieving positive free cash flow for full-year 2025 for the first time since 2020.
In addition, Beachbody presented at the Canaccord Genuity Growth Conference in August, where management outlined its strategic turnaround, including further cost reductions, a lower breakeven point and improving financial flexibility. The company also announced that it will transfer its stock listing from the NYSE to Nasdaq, underscoring its transformation efforts and future growth initiatives, including the relaunch of Shakeology.
The strong stock price recovery in August, coupled with narrowing losses, improved cash flow, and corporate restructuring initiatives, reflects renewed investor confidence, although revenue declines and legal challenges remain potential headwinds.
Below are two summary diagrams on the direct selling large cap companies.
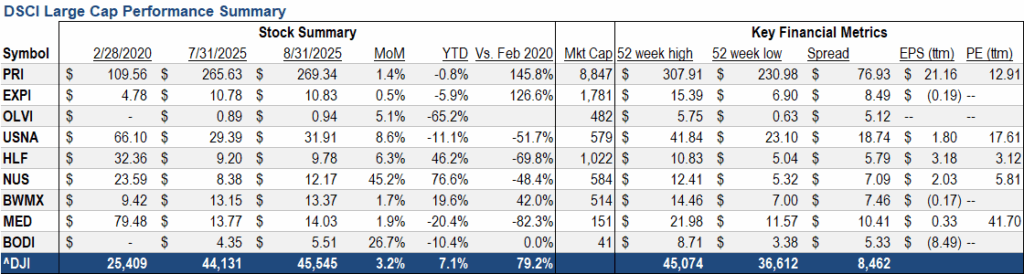

The Real Brokerage Inc. (NASDAQ: REAX) was founded in 2014, The Real Brokerage is a technology-driven, asset-light real estate brokerage that empowers agents through a cloud-based platform, AI tools, and fintech solutions. Operating across the U.S. and Canada, the company combines commission-based revenue, innovative agent incentives, and strategic acquisitions to disrupt traditional brokerage models and drive scalable growth.
Comparing August 2025 to July 2025, The Real Brokerage maintained strong operating momentum, building on its record Q2 results while advancing several growth initiatives. Following the August 7 earnings release (revenue $540.7 million, +59% YoY; gross profit $47.9 million, +50% YoY; first-ever quarterly net income of $1.5 million; adjusted EBITDA $20.0 million), Real highlighted continued agent expansion and platform engagement.
Operational updates in August included: the launch of Agent BreakThru, a free 8-week coaching experience aimed at boosting agent productivity; a Real Luxury assignment to lead sales and marketing for Bozeman Yards, a new high-end condo project; publication of the July Agent Survey, which showed agent optimism at a four-month high and signs of improving transaction activity; and the formation of Benson Crew, now Real’s largest team in Canada, through the merger of three top Ontario teams with $6 billion in lifetime sales. Collectively, these initiatives support productivity, brand elevation in luxury and deeper network effects in recruiting and retention.
Management also noted that agent count surpassed ~29,200 by early August, underscoring the company’s ability to scale its asset-light model across the U.S. and Canada while sustaining profitability.
Small Cap
Below is the July information for the two largest small cap companies, Nature’s Sunshine and LifeVantage.
Nature’s Sunshine Products, Inc. (NASDAQ: NATR), a natural health and wellness company, manufactures and sells nutritional and personal care products in Asia, Europe, North America, Latin America and internationally. The company provides general health products related to blood sugar support, bone health, cellular health, cognitive function, joint health, mood, sexual health, sleep, sports and energy and vision; immune products; cardiovascular products; and digestive products. It also offers personal care products, including oils and lotions, aloe vera gel, herbal shampoo, herbal skin treatment, toothpaste and skin cleanser products, as well as weight management products. The company provides its products under the Nature’s Sunshine Products and Synergy WorldWide brands directly to customers and to a sales force of independent consultants. Nature’s Sunshine Products, Inc. was founded in 1972 and is headquartered in Lehi, Utah.
In August, their stock price increased by 20.3% compared to July 2025, the largest gain among the small cap direct selling companies. For the first eight months of 2025, the stock declined by 14.9%. Since the inception of the DSCI, NATR has gained 117.0%.
Recent developments include Q2 2025 financial results showing net sales of $114.8 million, up 4% year-over-year, and adjusted EBITDA of $11.3 million, up 8% year-over-year. GAAP net income increased significantly to $5.3 million ($0.28 per diluted share), compared to $1.3 million ($0.07 per diluted share) in Q2 2024. Gross profit margin improved slightly to 71.7% from 71.4%. Operating income, however, declined to $4.3 million from $5.6 million in the prior-year period due to higher SG&A expenses, reflecting increased digital marketing investments, compensation and one-time costs.
The company strengthened its balance sheet, ending the quarter with $81.3 million in cash and no debt, while also repurchasing over 1 million shares for $12.4 million in the first half of 2025. Management raised its full-year 2025 guidance, now expecting net sales between $460 million and $475 million, and adjusted EBITDA between $41 million and $45 million.
Operational performance highlights include strong sales momentum in Japan and Central Europe and continued strength in digital channels and autoship programs. Notably, insider activity included the sale of approximately 9,700 shares by EVP Bryant Yates in late August, though analysts continue to rate the stock as a “Strong Buy,” citing potential undervaluation.
The sharp rebound in August, following July’s decline, reflects renewed investor confidence in Nature’s Sunshine’s growth trajectory and profitability outlook. Despite elevated operating expenses, improved margins, a strong cash position, share repurchases and raised full-year guidance underscore management’s confidence and provide a foundation for cautious optimism going forward.
LifeVantage Corporation (NASDAQ: LFVN) engages in the identification, research, development, formulation and sale of advanced nutrigenomic activators, dietary supplements, nootropics, pre- and probiotics, weight management and skin and hair care products. It offers Protandim, a dietary supplement; LifeVantage Omega+, a dietary supplement that combines DHA and EPA Omega-3 fatty acids, Omega-7 fatty acids, and vitamin D3; LifeVantage ProBio, a dietary supplement to support gut health; LifeVantage IC Bright, a supplement to support eye and brain health, reduce eye fatigue and strain, supports cognitive functions and support normal sleep patterns; LifeVantage Daily Wellness, a dietary supplement designed to strengthen immune health; LifeVantage Rise AM & Reset PM System that provides the body with the right nutrients; LifeVantage D3+, a dietary supplement that provides vitamin D3, vitamin K2, magnesium, calcium and other trace minerals to support a balanced immune system, strong bones and cardiovascular health; PhysIQ Fat Burn to support weight management; PhysIQ Prebiotic is a dietary supplement designed to support the good bacteria in the gut and a healthy microbiome; Petandim for Dogs, a supplement to combat oxidative stress in dogs; and Axio, a nootropic energy drink mix. The company also provides anti-aging skincare products, including liquid collagen, facial cleansers, eye cream, moisturizing cream, sunscreen, perfecting lotions, hand creams as well as hair care products, such as invigorating shampoos, nourishing conditioners and scalp serums under the TrueScience brand name. It sells its products through its website and network of independent consultants in the United States, Mexico, Japan, Australia, Hong Kong, Canada, Thailand, the United Kingdom, the Netherlands, Germany, Taiwan, Austria, Spain, Ireland, Belgium, New Zealand, Singapore and the Philippines. The company also launched Evolve Compensation Plan and other LV360 initiatives into the Philippines, Taiwan, Hong Kong and Singapore. The company is based in Lehi, Utah.
In August, LifeVantage’s stock price increased by 4.4% compared to July 2025, narrowing the company’s year-to-date losses to 25.3%. Since the February 1, 2020 establishment of the DSCI, LFVN has gained 10.0%.
Recent developments include Q4 FY 2025 financial results showing net sales of $55.1 million, up 12.6% year-over-year, and gross margin improving slightly to 79.9%. Adjusted EBITDA remained flat at $4.8 million, and EPS came in at $0.17, beating analyst expectations of $0.16. The company ended the quarter with $20.2 million in cash and no debt and returned $18.6 million to shareholders through buybacks and dividends, including a $0.045 per share dividend declared in August.
Operational highlights include continued international growth through the rollout of the MindBody GLP‑1 System in key markets such as Japan, Australia and Europe. The company also acquired assets from LoveBiome, a microbiome wellness company, strengthening LifeVantage’s position in gut health and complementing its existing nutrigenomic product portfolio.
The modest stock price gain in August, following July’s decline, reflects renewed investor confidence driven by strong financial results, strategic acquisitions and international expansion. While market volatility and cost pressures remain considerations, the company’s solid balance sheet, product innovation and global initiatives support cautious optimism for future growth.
For more insights, read the article: LifeVantage Acquires LoveBiome and LifeVantage Reports Fiscal Q4 Financial Results.
Below are two summary diagrams on the direct selling small cap companies.

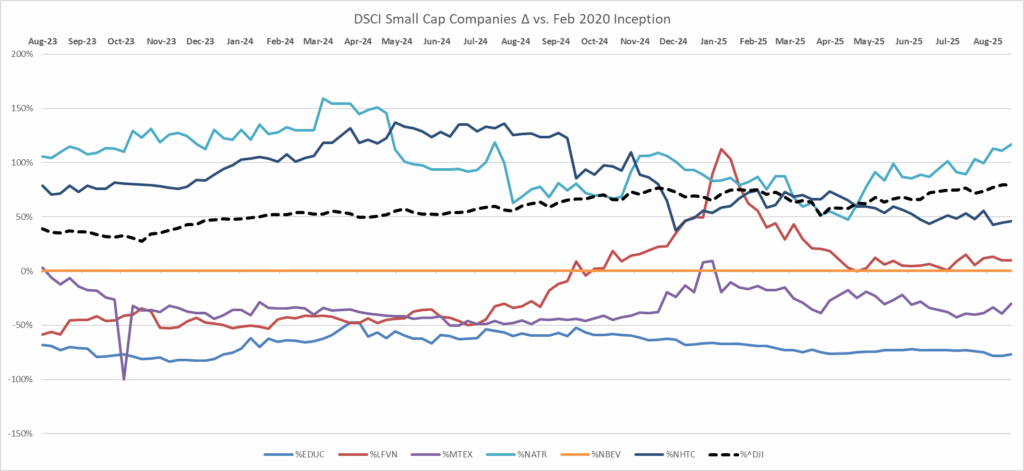
Short Interest Data & Analysis
The following chart is an aggregate index of “days to cover” among the entire tracking set. Days to cover (DTC) is a measurement determined by dividing the total outstanding short interest by average daily trading volume.
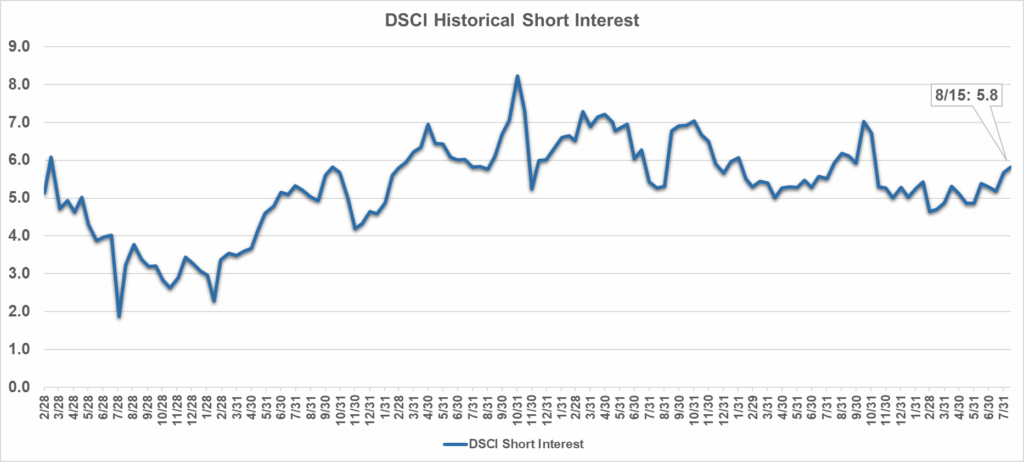
As indicated in the chart, short interest in DSCI stocks was 5.8 days as of August 15, 2025. Short interest can be a difficult indicator to analyze. On the one hand, an increase in short interest can be a bearish sign in that it indicates an increased view among investors that a stock is likely to decline based on any number of factors, such as a belief that the company’s fundamentals are deteriorating or that it has run too far, too fast. On the other hand, as a stock moves higher, a significant short interest can serve as extra fuel on the fire as investors scramble to “buy to cover” their short positions and mitigate losses.
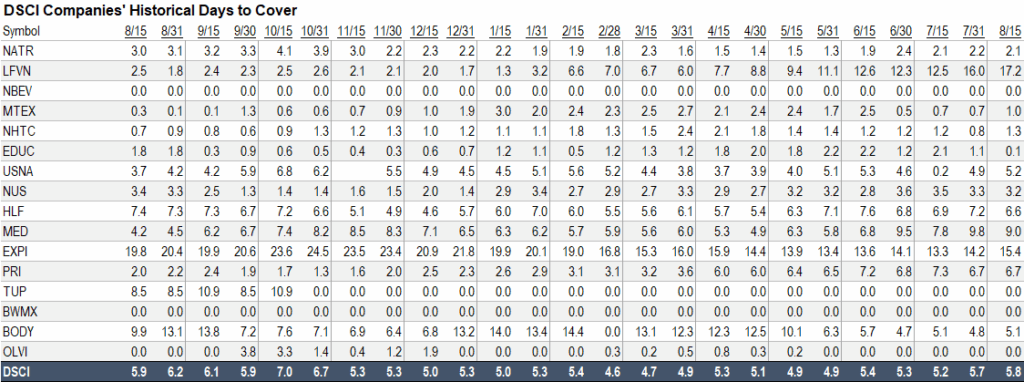
Analyst Sentiment Index
The DSCA Analyst Sentiment Index is a consensus tracking tool that aggregates and averages the recommendations of all covering analysts across all public direct selling companies.

-
July 2025
Brought to you by Direct Selling Capital Advisors
The Direct Selling Capital Advisors Direct Selling Index (DSCI) increased by 0.1% in July vs June 2025. The DJIA increased by 0.08% in July vs. June. Over the first seven months of 2025, the DSCI has a small increase of 3.7%. Since inception, the DSCI has delivered a return of 73.7%, underscoring the sustained strength and stability of our channel over time.
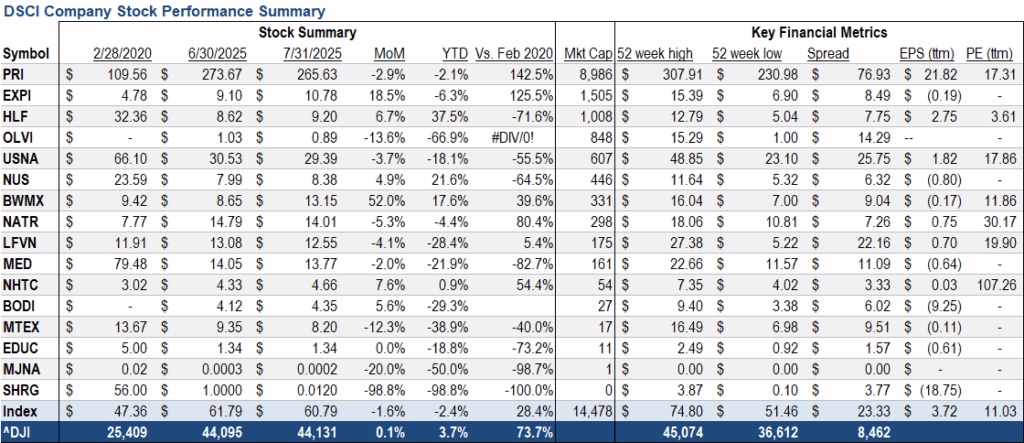
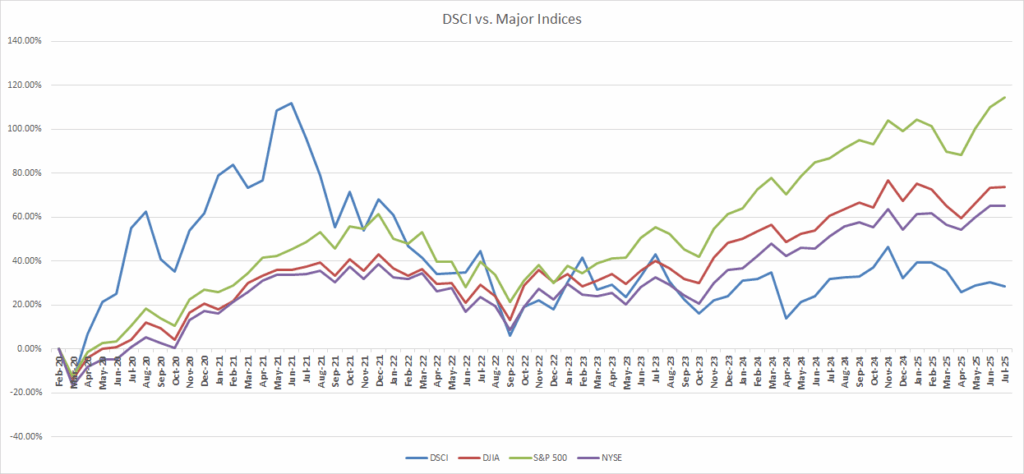
July’s broader market backdrop was mixed, with equity gains slowing after the strong rebound in Q2. During the first half of 2025, 50% of surveyed companies achieved at least 2% year-over-year revenue growth, while 22.5% grew more than 20%. However, 37.5% experienced declines of 2% or more, reflecting uneven performance across the channel.
Key trends shaping the month included moderate consumer spending, continued strength in top-performing companies embracing omnichannel strategies, and resilience among those committed to the MLM model. At the same time, macroeconomic uncertainty, driven by trade policy risks, interest rate speculation and geopolitical tensions, remained a headwind. The channel is not in decline but is evolving, with innovation and diversification emerging as critical growth drivers.
The Direct Selling Capital Advisors Index (DSCI) is a market capitalization-weighted index of all domestic public direct selling companies with a market capitalization of at least $25 million. The index is rebalanced monthly, and no single issue may represent more than 20% of its total value. Any excess weighting is redistributed among the remaining components.
Looking Forward
The channel enters the second half of the year navigating both growth opportunities and persistent challenges. While July’s DSCI performance was modest, underlying trends suggest a cautiously optimistic outlook for the remainder of 2025. Companies that continue to diversify their sales channels, strengthen digital engagement and innovate their product offerings are best positioned to capture growth opportunities. At the same time, uneven revenue performance across the channel highlights the need for agility in responding to shifting consumer behavior and macroeconomic uncertainty. External factors, including potential policy changes, global trade developments and evolving competitive dynamics, will remain influential. The direct selling channel’s ability to adapt and evolve will be a critical determinant of sustained momentum in the months ahead.
For more insights, read the articles: Direct Selling Channel Sees Growth in the First Half of 2025 and Direct Selling Isn’t Declining—It’s Evolving.
Large Cap
Note: For the purposes of this report, Direct Selling Capital considers companies with a market capitalization in excess of $1 billion “Large Cap.”
Betterware de Mexico (NASDAQ: BWMX), founded in 1995, Betterware de Mexico is the leading direct-to-consumer company in Mexico focused on offering innovative products that solve specific needs related to household organization, practicality, space-saving and hygiene. Through the acquisition of JAFRA on April 7, 2022, the Company now offers a leading brand of direct-to-consumer in the Beauty market in Mexico and the United States where it offers fragrances, color & cosmetics, skincare, and toiletries. The combined company possesses an asset-light business model with low capital expenditure requirements and a track record of strong profitability, double digit rates of revenue growth and free cash flow generation. Today, the Company distributes its products in Mexico and the US.
In July 2025, Betterware’s stock price increased by 52.0% compared to June. Year to date, the stock’s performance turned positive, showing a gain of 17.6%. Since the establishment of the DSCI on February 1, 2020, BWMX has increased by 39.6%.
In its Q2 2025 financial results, the company reported net revenue of MXN 1.46 billion, down 1.2% year-over-year, and an EBITDA margin of 19.9%, reflecting stable profitability despite a 4.5% decline in EBITDA. Betterware’s associate base grew for the first time since Q1 2021, reaching 670,349 by quarter-end, driven by new product innovations, enhanced incentives and seasonal promotions. JAFRA Mexico delivered strong performance with 10.9% revenue growth and a 21.2% EBITDA margin, supported by product rebranding, improved salesforce productivity and strategic pricing adjustments.
July also marked a milestone year for the company, celebrating 30 years of Betterware Mexico, five years as a public company, and one year since the creation of BeFra following the JAFRA acquisition. The group reaffirmed its long-term ambition to reach USD 1 billion in net revenue and advance its international expansion, including recent launches in Ecuador and Guatemala. Despite ongoing operational challenges, Betterware’s strong July rally and solid Q2 performance signaled renewed investor confidence in its growth strategy.
For more insights, read the articles: BeFra Reports Q2 2025 Financial Results and BeFra: Betterware and Jafra’s Visionary New Home
Nu Skin Enterprises, Inc. (NYSE: NUS), together with its subsidiaries, engages in the development and distribution of various beauty and wellness products worldwide. It offers skincare devices, cosmetics and other personal care products, including ageLOC LumiSpa and ageLOC LumiSpa iO; and nutrition skincare products. The company also provides wellness products, such as LifePak nutritional supplements, ageLOC TR90 weight management system and Beauty Focus Collagen+. In addition, it is involved in the research and product development of skincare products and nutritional supplements. The company sells its products under the Nu Skin, Pharmanex and ageLOC brands through retail stores, website, digital platforms and independent direct sellers and marketers, as well as a service center. Nu Skin Enterprises, Inc. was founded in 1984 and is headquartered in Provo, Utah.
In July 2025, Nu Skin’s stock price increased by 4.9% compared to June. Year-to-date, the stock is up 21.6%. Since the establishment of the DSCI on February 1, 2020, Nu Skin’s stock has declined by 64.5%. The stock’s 52-week high is $11.64, and the low is $5.32. Analysts continue to forecast a 23.25% growth estimate for 2025.
Nu Skin reported Q2 2025 financial results showing total revenue of $386.1 million, a 12.1% decline year-over-year. Gross margin for the Nu Skin business improved slightly to 77.5%, although overall gross margin fell nearly 2% compared to Q2 2024. The company posted EPS of $0.43, reflecting strong operational management despite top-line pressures. Other income resulted in a loss of $0.8 million, compared to income of $0.6 million in Q2 2024.
Operational metrics indicated a contraction in the direct-selling network: customers decreased 14% to 771,407, paid affiliates fell 16% to 130,799, and sales leaders declined 23% to 29,593. However, growth pockets were evident: Rhyz Manufacturing revenue grew 17% YoY, and Latin America revenue surged 107% YoY.
The company emphasized strategic initiatives to drive future growth, including a mid-Q4 limited preview of the Prysm iO intelligent wellness device, expected to stimulate the nutritional supplements business with personalized product recommendations and subscriptions. Expansion into new markets continues, with pre-opening activities in India on track for a formal mid-2026 launch.
Nu Skin’s updated 2025 guidance projects revenue of $1.48B–$1.55B, EPS of $3.05–$3.25, and adjusted EPS of $1.15–$1.35. For Q3 2025, the company expects revenue of $360M–$390M and EPS of $0.25–$0.35.Management highlighted continued operational optimization, resulting in an 8% operating margin, and progress in aligning sales leaders with key initiatives for late 2025 and 2026. Analysts remain cautiously constructive, noting that while revenue pressures persist, strategic investments in product innovation, emerging market expansion, and customer engagement offer potential upside for sustained growth.
For more insights, read the article: Nu Skin Reports Q2 2025 Financial Results
Herbalife Nutrition, Inc. (NYSE: HLF), together with its subsidiaries, provides health and wellness products in North America, Mexico, South and Central America, Europe, the Middle East, Africa, China and the Asia Pacific region. The company offers products in the areas of weight management; targeted nutrition; energy, sports and fitness; outer nutrition; and literature, promotional and other items. It also provides weight management products, including meal replacement products, protein shakes, drink mixes, weight loss supplements, healthy snacks and metabolism-boosting teas; targeted nutrition products, which comprise functional beverages, and dietary and nutritional supplements that contain herbs, vitamins, minerals and other natural ingredients; outer nutrition products, such as facial skin, body and hair care products; and energy, sports and fitness products, including N-R-G tea and energy drink products. In addition, it offers literature, promotional and other materials that comprise start-up kits, sales tools and educational materials. The company sells its products through sales representatives, independent service providers and company-operated retail stores and platforms. The company was formerly known as Herbalife Nutrition Ltd. and changed its name to Herbalife Ltd. in April 2023. Herbalife Ltd. was founded in 1980 and is headquartered in Los Angeles, California.
For the month of July 2025, Herbalife’s stock rose by 6.7% compared to June, continuing its positive momentum. Year-to-date, the stock has increased by 37.5%, making it the only large-cap stock to post a positive return in the first seven months of 2025. However, HLF remains down 71.6% since the establishment of the DSCI on February 1, 2020.
In July, the stock’s Relative Strength Rating increased from 87 to 92, reflecting strong technical performance compared to other stocks. The share price moved more than 5% above the $9.23 entry point from a cup-without-handle technical pattern, indicating it was outside the optimal buying range. Analysts note that investors may watch for new entry setups such as a three-weeks-tight pattern or a pullback to the 50-day or 10-week moving average. Earnings in the last quarter rose 20% year-over-year, while sales declined by 3%.
On August 6, 2025, Herbalife reported its Q2 2025 financial results, showing net sales near the midpoint of guidance, adjusted EBITDA above expectations and stronger full-year guidance. In July, the company also launched MultiBurn, a multifunctional weight-loss supplement supporting metabolic health and introduced the beta version of its AI-assisted Pro2col app, which engaged more than 7,000 distributors.
Herbalife continues to trade at a discount to fair value estimates, suggesting potential upside if current trends persist. While earnings forecasts point to an average annual decline of 9.2% over the next three years, operational improvements, product innovation, and technical strength could support recovery.
With continued momentum in stock performance, stronger distributor engagement and new product launches, Herbalife enters the second half of 2025 positioned for potential growth, making upcoming quarters important for confirming this trajectory.
For more insights, read the article: Herbalife Reports Q2 2025 Financial Results
Medifast, Inc. (NYSE: MED), through its subsidiaries, operates as a health and wellness company offering habit-based, coach-guided lifestyle solutions focused on weight management and obesity support in the United States. The company’s flagship brand, OPTAVIA, delivers clinically supported weight loss programs, GLP-1 support plans and a wide variety of food products, such as bars, shakes, soups, cereals and snacks, complemented by one-on-one coaching, digital tools and community support. Medifast was founded in 1980 and is headquartered in Baltimore, Maryland. Its products are sold via point-of-sale transactions and ecommerce.
For the month of July 2025, shares of Medifast declined by 2.0% compared to June. Year to date, the stock is down 21.9%, and since the establishment of the DSCI on February 1, 2020, the stock has declined by 82.7%, making it the worst-performing large-cap DSCI member over the long term.
In Q2 2025, the company reported revenue of $105.6 million, a 37.4% decrease compared to the same period in 2024. Despite this decline, Medifast achieved net income of $2.5 million, or $0.22 per diluted share, reversing a loss of $0.75 per share a year earlier. Gross profit fell 37.9% to $76.6 million, with a gross margin of 72.6%. The number of active OPTAVIA coaches dropped by 32.7% to 22,800, while SG&A expenses decreased by 40.8% to $77.7 million, primarily due to lower coach compensation and cost reductions. The company ended the quarter with $162.7 million in cash and investments and no debt.
During the quarter, Medifast launched the Premier Plus auto-ship program and the Edge incentive program to increase coach engagement and productivity. The company also continued to emphasize metabolic health solutions, including support for clients using GLP-1 medications. For Q3 2025, Medifast expects revenue between $70 million and $90 million, with earnings per share projected in the range of $0.00 to –$0.60.
Following the Q2 earnings release, Medifast’s shares experienced a modest decline despite exceeding earnings expectations, as investors focused on the steep drop in revenue and cautious forward guidance.
For more insights, read the article: Medifast Reports Q2 2025 Financial Results
USANA Health Sciences, Inc. (NYSE: USNA) develops, manufactures and sells science-based nutritional, personal care and skincare products across the Asia Pacific, the Americas and Europe. The company operates through two segments: Direct Selling and Hiya Direct-To-Consumer. Its product lineup includes USANA Nutritional Optimizers for cardiovascular, skeletal, and digestive health; Essentials/CellSentials. vitamin and mineral supplements for all ages beginning at 13 months; and food products such as meal replacement shakes and snack bars for healthy weight management, digestive health and hydration. USANA also offers the Celavive skincare line tailored for various skin types and ethnicities, as well as online tools and business materials for associates. Products are sold through retail, subscription-based models and direct selling. The company holds research collaboration agreements with the Beijing University of Chinese Medicine and the National Sports Training Bureau. USANA was founded in 1992 and is headquartered in Salt Lake City, Utah.
For the month of July 2025, USANA’s stock declined by 3.7% compared to June, breaking the modest upward trend observed earlier in the year. Year to date, the stock is down 18.1%, reflecting underperformance relative to broader markets and peers. Since the establishment of the DSCI on February 1, 2020, USANA shares have lost 55.5%.
July was marked by significant volatility. On July 22, USANA reported Q2 2025 results that exceeded analyst expectations: EPS of $0.74 (37% above consensus) and revenue of $236 million (+11% year-over-year), triggering a pre-market stock surge of nearly 19%. Despite the initial rally, the stock retreated later in the month, pressured by macroeconomic uncertainties and cautious investor sentiment. Short interest spiked dramatically, rising 2,787% from mid-June levels to 796,800 shares, representing approximately 7.2% of the company’s outstanding shares, suggesting heightened bearish positioning.
Operationally, USANA maintained solid gross margins and a debt-free balance sheet, but revenue pressures persisted amid challenging global demand trends. The company continued to invest in R&D and digital tools for its associates, reinforcing its long-term innovation strategy. On the leadership front, analyst sentiment improved, with Zacks upgrading the stock to a Rank #2 (Buy), citing favorable earnings momentum and operational discipline.
However, challenges remain. Elevated short interest, ongoing revenue headwinds, and cautious consumer spending in key Asia-Pacific markets temper the near-term outlook. While USANA’s valuation remains fair and its fundamentals sound, the absence of a dividend yield limits its attractiveness to income-focused investors.
With strong quarterly results but a net monthly decline in share price, July underscored the push-pull dynamic between bullish earnings reactions and broader market caution. As the second half of 2025 unfolds, USANA’s ability to convert its operational strengths into sustained top-line growth will be critical to regaining investor confidence.
For more insights, read the article: USANA Reports Q2 2025 Financial Results
eXp World Holdings, Inc. (NASDAQ: EXPI), together with its subsidiaries, provides cloud-based real estate brokerage services for residential homeowners and homebuyers. It operates through three segments: North American Realty, International Realty and Other Affiliated Services. The company acts as a licensed broker for processing residential and commercial real estate transactions; and provides other real estate support services. It also offers FrameVR.io, a web-accessible proprietary technology offering immersive 3D platforms; magazine and its related media properties which provide training, classes, resources and tools under the SUCCESS brand; SUCCESS Space, a coworking solution offering rental workspaces for individual and group use, access to professional development coaching, media production services, virtual-world communications technology and full-service cafes.
It operates in North America, Canada, the United Kingdom, Australia, South Africa, India, Mexico, Portugal, France, Puerto Rico, Brazil, Italy, Hong Kong, Colombia, Spain, Israel, Panama, Germany, the Dominican Republic, Greece, New Zealand, Chile, Poland, Dubai and recently expanded into Japan. The company was formerly known as eXp Realty International Corporation and changed its name to eXp World Holdings, Inc. in May 2016. eXp World Holdings, Inc. was incorporated in 2008 and is headquartered in Bellingham, Washington.
The stock price increased 18.5% in July vs. June 2025. For the first seven months of 2025, their stock price has declined by 6.3%. More constructively, EXPI shares have appreciated an aggregate 125.5% over the five years the DSCI has been computed, the third best long-term mark for any DSCI member. Additional financial data is at the end of this report.
On August 1, the company reported its Q2 2025 financial results. Revenue grew 1% year-over-year to $1.3 billion, driven by stable transaction volume and a modest increase in real estate sales volume, which reached $52.5 billion (+1% YoY). However, agent count declined 5% to 82,704, and closed transactions fell 2% to 118,612. Adjusted EBITDA came in at $11.2 million, while net cash provided by operating activities totaled $36.1 million. EPS for the quarter was
–$0.01, missing analyst expectations of +$0.09, which pressured sentiment despite revenue stability.
Operationally, eXp maintained a strong liquidity position and continued investing in platform enhancements, agent tools and global expansion initiatives. The revenue-sharing model and stock-based incentives remain key differentiators in attracting and retaining agents, though the year-over-year decline in agent count suggests competitive pressures in the real estate brokerage market.
While July’s sharp price gain reflected renewed investor optimism—likely tied to the company’s long-term growth track record and relative strength compared to the sector—headwinds remain. Lower agent retention, modest transaction softness and EPS misses may challenge near-term momentum. Nonetheless, eXp’s strong five-year stock performance, scalable cloud-based model and disciplined financial management position it for potential recovery if real estate market conditions stabilize in late 2025.
With a blend of strong historical returns, short-term operational challenges and solid platform fundamentals, July highlighted the market’s confidence in eXp’s long-term growth story despite immediate profitability pressures.
For more insights, read the article: eXp World Holdings Reports Q2 2025 Financial Results
Primerica, Inc. (NYSE: PRI), together with its subsidiaries, provides financial products and services to middle-income households in the United States and Canada. The company operates in three segments: Term Life Insurance; Investment and Savings Products; Senior Health; and Corporate and Other Distributed Products. The Term Life Insurance segment underwrites individual term life insurance products. The Investment and Savings Products segment provides mutual funds and various retirement plans, managed investments, variable and fixed annuities and fixed indexed annuities; and offers segregated funds. The Corporate and Other Distributed Products segment provides mortgage loans; prepaid legal services that assist subscribers with legal matters, such as drafting wills, living wills and powers of attorney, trial defense and motor vehicle-related matters; ID theft defense services; auto and homeowners’ insurance; home automation solutions; and insurance products, including supplemental and accidental death and disability insurance. It distributes and sells its products through licensed sales representatives. Primerica, Inc. was founded in 1927 and is headquartered in Duluth, Georgia.
In July, the stock price declined by 2.9% vs. June 2025. For the first seven months of 2025, the stock has declined 2.1%. PRI has appreciated 142.5% since February 1, 2020, the best long-term performance for any DSCI member.
Primerica shares slipped in July after modest gains in the prior month, as investors awaited the company’s second quarter earnings report and monitored broader consumer spending trends. Despite the pullback, Primerica remains among the strongest long-term performers within DSCI, underpinned by a resilient client base and disciplined financial management.The Primerica Household Budget Index™ (HBI™) for June 2025, released in July, came in at 100%, down 0.1 percentage points from May’s 100.1%, according to Primerica’s consulting economist, Amy Crews Cutts. She noted, “The continued stability of the HBI suggests that wage growth remains sufficient to offset rising costs of essentials, though many families are still exposed to volatility in food and energy prices.” This signals that the company’s core middle-income customer base continues to face inflationary pressures but is managing to maintain relative financial stability.
Management continues to prioritize the expansion of its licensed representative force and the development of additional financial wellness offerings tailored to its core demographic. Analysts emphasize the company’s conservative underwriting standards and strong capital reserves as important factors supporting ongoing profitability and stability, even as economic conditions remain uncertain.
Oliveda International, Inc. (OTC: OLVI). was founded in 2003 and has more than 20 years of experience in: 1) the management and organic certification of mountain olive trees; 2) the extraction of international award-winning extra virgin olive oils; 3) the extraction of hydroxytyrosol, a compound with antioxidant, anti-inflammatory, anticancer and skin- and eye-protective effects; and 4) the production and distribution of cosmetic and holistic waterless products derived from the olive tree.
Oliveda International, Inc. and its subsidiaries, including Olive Tree People Inc., Olive Tree People Europe AG, Oliveda Deutschland GmbH, and Olive Tree Farmers SL, were founded by German real estate investor Thomas Lommel. The group has established a unique market position through innovations such as Olive Tree Therapy “10 years in 14 days,” olive matcha (made from ground olive leaves), and a coffee alternative based on olive leaves and hydroxytyrosol. Lommel is also active in the mindfulness sector with his olive tree sound bath meditations and the broadcast of olive tree frequencies globally.
In addition to online sales and a broad retail network across Europe, Oliveda Deutschland GmbH operates flagship stores in Berlin and Düsseldorf. Its brand portfolio includes Oliveda, LA Dope, Re:connected to Nature, The Intuition of Nature, and Olive Mush. Through the Thomas Lommel Foundation, the company donates unused water from its waterless beauty production to communities in Africa by building wells on-site.
Comparing July 2025 to June 2025, the stock price declined by 13.6%. For the first seven months of 2025, the stock declined by 66.9%.
Olive Tree People, OLVI’s waterless beauty subsidiary, reported 70% growth in the first half of 2025, following an extraordinary 3,000% growth in 2024 and surpassing $100 million in US sales. The company launched operations in Canada in July 2025, expanding its North American presence, and confirmed plans to enter the European market in October 2025. OLVI also announced several upcoming initiatives: the unveiling of a surprise new brand at the Los Angeles flagship store in October; the launch of a hydroxytyrosol-based pet care brand, “Is that Matty,” in November; participation in New York Fashion Week in September, where Olive Rose products will be featured by 75 makeup artists on over 150 models; and the acquisition of additional olive groves along with construction of a modern mill in partnership with the municipality of Arroyomolinos de León.
CEO Thomas Lommel emphasized that the direct selling industry is not in decline but is evolving, driven by innovation, sustainable practices and premium product experiences—principles that continue to shape OLVI’s strategy and market leadership.
For more insights, read the articles: Olive Tree People Sees 70% Growth in First Half of 2025 and Olive Tree People Launches in Canada
The Beachbody Company, Inc. (NYSE: BODI) operates as a fitness and nutrition company in the United States and internationally. The company offers Beachbody on Demand, a subscription streaming service providing fitness programs such as P90X, Insanity, and 21 Day Fix; nutrition programs including Portion Fix and 2B Mindset; and nutritional products like Shakeology shakes and Beachbody Performance supplements. The company also faces legal challenges in California, where efforts are underway to reclassify independent consultants as employees, which may impact its direct selling model.
In July, the stock price increased by 5.6% compared to June 2025. For the first seven months of 2025, the stock price declined by 29.3%. Recent developments include Q2 2025 financial results showing revenue of $103.1 million, down 16% year-over-year, and a net loss of $15.5 million, compared to a $45.7 million loss in the same quarter last year. The company highlighted progress in cost reduction efforts and growth in its subscription base, with digital subscriptions reaching 1.4 million.
The moderate stock price recovery in July, alongside narrowing losses and a growing subscription base, indicates cautious optimism, though revenue declines and ongoing legal challenges remain potential headwinds.
For more insights, read the article: Beachbody Reports Q2 2025 Financial Results
Below are two summary diagrams on the direct selling large cap companies.


The Real Brokerage Inc. (NASDAQ: REAX) was founded in 2014 and is a technology-driven, asset-light real estate brokerage that empowers agents through a cloud-based platform, AI tools and fintech solutions. Operating across the US and Canada, the company combines commission-based revenue, innovative agent incentives and strategic acquisitions to disrupt traditional brokerage moels and drive scalable growth.
In Q2 2025, Real reported revenue of $5490.7 million (59% YoY) and gross profit of $47.9 million (+5% Y0Y). Adjusted EBITDA rose to $20 million, up from $14 million a year earlier, while net income reached $1.5 million, marking the company’s first-ever quarterly profit compared to a $1.1 million loss in Q2 2024. Closed transactions totaled 49,282 (+62% YoY) with a transaction value of $20.1 billion (+60% YoY). Agent count grew 43% TO 28,034 at quarter-end, surpassing ~29,200 by early August and operating cash flow reached $41 million. The company ended the quarter with $54.8 million in cash and short-term investments and no debt.
Strategic highlights included the acquisition of Flyhomes; AI-powered home search portal, the expansion of the Real Wallet fintech platform to 3.600 agents and enhancements to its revenue share model. Real remains focused on leveraging technology, agent growth and platform innovation to expand its market share and sustain profitability.
For more insights, read the article: The Real Brokerage Inc. Reports Q2 2025 Financial Results
Small Cap
Below are the July summaries for the two largest small cap companies, Nature’s Sunshine and LifeVantage.
Nature’s Sunshine Products, Inc. (NASDAQ: NATR), a natural health and wellness company, manufactures and sells nutritional and personal care products in Asia, Europe, North America, Latin America and other markets internationally. The company provides general health products related to blood sugar support, bone health, cellular health, cognitive function, joint health, mood, sexual health, sleep, sports and energy and vision; immune products; cardiovascular products; and digestive products. It also offers personal care products, including oils and lotions, aloe vera gel, herbal shampoo, herbal skin treatment, toothpaste, and skin cleanser products, as well as weight management products. The company provides its products under the Nature’s Sunshine Products and Synergy WorldWide brands directly to customers and to a sales force of independent consultants. Nature’s Sunshine Products, Inc. was founded in 1972 and is headquartered in Lehi, Utah.
In July, their stock price declined by 5.3% compared to June 2025, the largest decline among the small cap direct selling companies. For the first seven months of 2025, the stock declined by 4.4%. Since the inception of the DSCI, NATR has gained 80.4%.
Recent developments include Q2 2025 financial results showing net sales of $114.8 million, up 4% year-over-year, and adjusted EBITDA of $11.3 million, up 8% year-over-year. Gross profit margin improved slightly to 71.7% from 71.4%. The company raised its full-year 2025 guidance, now expecting net sales between $460 million and $475 million, and adjusted EBITDA between $41 million and $45 million.
Operational performance highlights include strong momentum in key international markets such as Japan and Central Europe and continued strength in digital sales and auto ship programs. The company ended the quarter with $81.3 million in cash and no debt.
The sharp stock price drop in July, despite solid Q2 operational performance and raised full-year guidance, suggests that investor sentiment may have been affected by broader market dynamics or near-term uncertainties. Nonetheless, improved margins, strong cash position and strategic focus on digital and international channels indicate resilience and cautious optimism in the company’s outlook.
For more insights, read the article: Nature’s Sunshine Reports Q2 2025 Financial Results
LifeVantage Corporation (NASDAQ: LFVN) engages in the identification, research, development, formulation and sale of advanced nutrigenomic activators, dietary supplements, nootropics, pre- and probiotics, weight management and skin and hair care products.
It offers Protandim, a dietary supplement; LifeVantage Omega+, a dietary supplement that combines DHA and EPA Omega-3 fatty acids, Omega-7 fatty acids and vitamin D3; LifeVantage ProBio, a dietary supplement to support gut health; LifeVantage IC Bright, a supplement to support eye and brain health, reduce eye fatigue and strain, supports cognitive functions and supports normal sleep patterns; LifeVantage Daily Wellness, a dietary supplement designed to strengthen immune health; LifeVantage Rise AM & Reset PM System that provides the body with the right nutrients; LifeVantage D3+, a dietary supplement that provides vitamin D3, vitamin K2, magnesium, calcium and other trace minerals to support a balanced immune system, strong bones and cardiovascular health; PhysIQ Fat Burn to support weight management; PhysIQ Prebiotic is a dietary supplement designed to support the good bacteria in the gut and a healthy microbiome; Petandim for Dogs, a supplement to combat oxidative stress in dogs; and Axio, a nootropic energy drink mix.
The company also provides anti-aging skincare products, including liquid collagen, facial cleansers, eye cream, moisturizing cream, sunscreen, perfecting lotions, hand creams as well as hair care products, such as invigorating shampoos, nourishing conditioners and scalp serums under the TrueScience brand name.
It sells its products through its website and network of independent consultants in the United States, Mexico, Japan, Australia, Hong Kong, Canada, Thailand, the United Kingdom, the Netherlands, Germany, Taiwan, Austria, Spain, Ireland, Belgium, New Zealand, Singapore and the Philippines. The company also launched Evolve Compensation Plan and other LV360 initiatives into the Philippines, Taiwan, Hong Kong and Singapore. The company is based in Lehi, Utah.
LifeVantage shares continued their downward trend in July, declining 4.1% and extending the company’s year-to-date losses to 28.4%, as market uncertainty and volatility persist. Since the February 1, 2020 establishment of the DSCI, LFVN has gained 5.4%.
July brought continued share price pressure for LifeVantage, reflecting persistent market uncertainty and volatility. Despite the challenging stock performance, the company remained active on the strategic front. It celebrated innovation at its annual Activate 2025 event, highlighting product advancements and brand momentum. LifeVantage also established operations in Iceland, expanding its European presence and announced promising results from a clinical trial showing a 200% increase in natural GLP-1 production, a hormone linked to appetite regulation and metabolic health.
While near-term stock movements remain negative, these strategic initiatives underscore LifeVantage’s commitment to innovation, scientific validation and international growth, laying the groundwork for potential long-term value creation.
For more insights, read the articles: LifeVantage Celebrates Innovation at Activate 2025, LifeVantage Clinical Trial Shows 200% Increase in Natural GLP-1 Production and LifeVantage Establishes Iceland Operations
Below are two summary diagrams on the direct selling small cap companies.
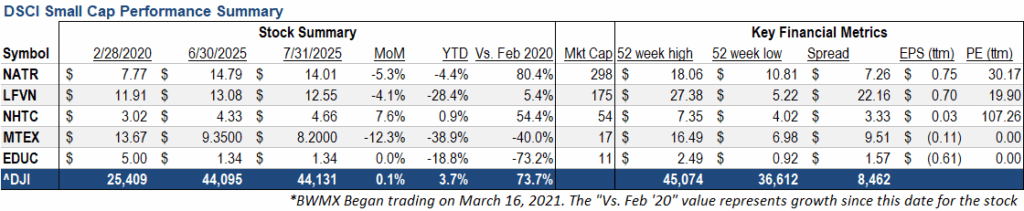
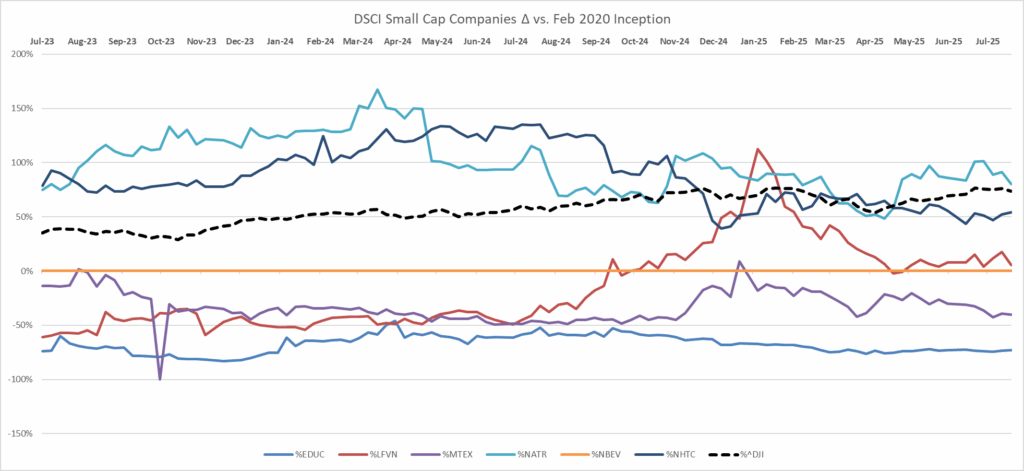
Short Interest Data & Analysis
The following chart is an aggregate index of “days to cover” among the entire tracking set. Days to cover (DTC) is a measurement determined by dividing the total outstanding short interest by average daily trading volume.
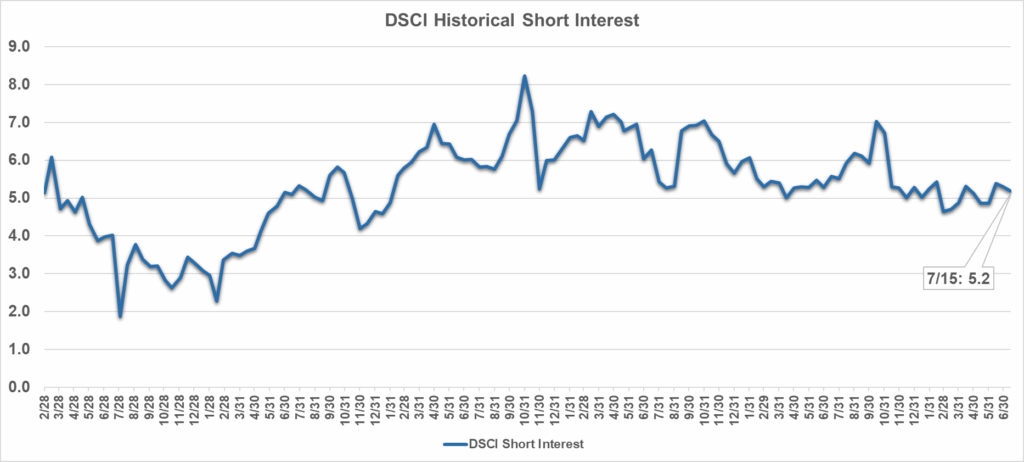
As indicated in the chart, short interest in DSCI stocks was 5.2 days as of July 15, 2025. Short interest can be a difficult indicator to analyze. On the one hand, an increase in short interest can be a bearish sign in that it indicates an increased view among investors that a stock is likely to decline based on any number of factors, such as a belief that the company’s fundamentals are deteriorating or that it has run too far, too fast. On the other hand, as a stock moves higher, a significant short interest can serve as extra fuel on the fire as investors scramble to “buy to cover” their short positions and mitigate losses.
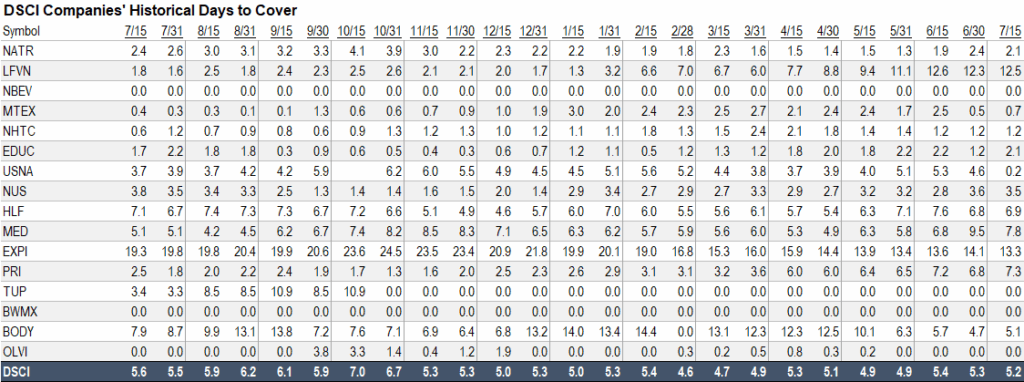
Analyst Sentiment Index
The DSCA Analyst Sentiment Index is a consensus tracking tool that aggregates and averages the recommendations of all covering analysts across all public direct selling companies.

-
June 2025
Brought to you by Direct Selling Capital Advisors
Direct Selling Index mirrors the DJIA for the month of June 2025
The Direct Selling Capital Advisors Direct Selling Index (DSCI) increased by 4.3% in June vs. May 2025. The DJIA increased by 3.9% in June vs. May. Over the first six months of 2025, the DSCI has a small increase of 3.6%. Comparing the DSCI vs. the DJIA since the inception of the DSCI, the DSCJ return is 73.5%. This demonstrates the long-term resilience of our channel.

 The first half of 2025 presented a mixed bag for investors, characterized by volatility and a significant recovery from early market corrections. While the first quarter saw a downturn, with some indexes even flirting with bear market territory, a strong rebound in the second quarter led to record highs for major indices like the S&P 500 and Nasdaq. Despite facing challenges like potential trade wars, geopolitical tensions and even recession fears, the market ultimately displayed resilience, with positive returns for the first half of the year.
 Key Trends and Events
Volatility and RecoveryThe market experienced a significant sell-off in the first quarter, with the S&P 500 declining as much as 17.8% in April. However, a strong recovery in the second quarter led to a positive return for the first half of the year, with the S&P 500 and Nasdaq reaching record highs.
“Magnificent 7” Outperformance
The “Magnificent 7” stocks, which include tech giants, significantly outperformed the rest of the S&P 500, delivering a 18.6% price return in the second quarter.
Dollar Weakness
The US dollar experienced weakness, which boosted returns for international investors and benefited emerging market equities.
Geopolitical Tensions
The war between Iran and Israel caused some market volatility, but its impact on markets was relatively muted.
Shifting Investor Sentiment
While initial concerns about tariffs and recession led to market downturns, investor sentiment improved as the market recovered, with some indicators reaching “extreme optimism” territory.
Emerging Markets Resilience
Emerging markets demonstrated resilience, with strong domestic demand and central bank credibility mitigating the impact of trade uncertainties.
There was a notable rotation in market leadership, with value stocks and certain sectors like basic materials, healthcare and energy outperforming growth stocks and technology.
Factors Contributing to the Recovery
Strong Earnings
A robust first quarter earnings season, with strong year-over-year growth and positive earnings surprises, contributed to the market’s recovery.
Resilient Economy
The US and global economies showed resilience, expanding at a near-trend pace despite facing policy surprises and geopolitical tensions.
Policy Easing
Easing trade tensions between the US and China, as well as the anticipation of potential rate cuts, also contributed to the positive market sentiment.
Investor Confidence
The market’s ability to recover from the April lows and reach new highs fueled investor confidence and optimism.
Potential Challenges and Risks
Tariffs and Trade Disputes
Ongoing trade tensions and the potential for further tariffs remain a concern for the market.
Geopolitical Instability
The war between Iran and Israel, along with other geopolitical risks, could continue to create market volatility.
Inflation and Interest Rates
The potential for continued inflation and interest rate hikes could pose challenges for the market.
Economic Slowdown
Concerns about a potential economic slowdown, particularly in the Eurozone, could impact market performance.
Looking Forward
The direct selling channel has some significant headwinds soon due to a lot of uncertainty in the global marketplace. We are seeing more companies moving away from a sole dependency for distributors to drive revenue through an omnichannel strategy. At the same time, we are seeing companies committed to the MLM business model showing growth.
The Direct Selling Capital Advisors Index (DSCI) is a market capitalization weighted index of all domestic public direct selling companies with a market capitalization of at least $25 million. The index is rebalanced monthly, and no single issue is permitted to represent more than 20% of its total value. In such an event, the excess weighting would be redistributed among the other index components.Large Cap
Note: For the purposes of this report, Direct Selling Capital considers companies with a market capitalization more than $1 billion “Large Cap.”
Betterware de Mexico (NASDAQ: BWMX), founded in 1995, is the leading direct-to-consumer company in Mexico specializing in household organization, practicality, space-saving, and hygiene products. Through the acquisition of JAFRA in April 2022, the company expanded into the beauty market in Mexico and the United States, offering fragrances, color cosmetics, skincare and toiletries. Betterware operates an asset-light business model with low capital expenditure requirements and has a track record of strong profitability, double-digit revenue growth and free cash flow generation. The company distributes its products in Mexico and the US.
In June 2025, Betterware’s stock price increased by 9.2% compared to May. Year-to-date, the stock’s decline narrowed to –22.6%. Since the establishment of the DSCI on February 1, 2020, BWMX has declined by 8.2%.
After a significant drop in May, Betterware showed a positive rebound in June, supported by an upgrade to a Zacks Rank #1 (Strong Buy) and rising earnings estimates, reflecting improving analyst sentiment. However, the company continues to face challenges including a 51% drop in EPS over the last year, weak interest coverage, shrinking profit margins (down from 8.7% to 4.1%) and a high dividend yield of approximately 17.5% that is not well covered by earnings. These financial risks temper the recent optimism.
Betterware’s upcoming Q2 earnings report will be important to assess if the recent positive momentum can be sustained amid ongoing operational and financial challenges.
Nu Skin Enterprises, Inc. (NYSE: NUS), together with its subsidiaries, engages in the development and distribution of various beauty and wellness products worldwide. It offers skincare devices, cosmetics and other personal care products, including ageLOC LumiSpa and ageLOC LumiSpa iO; and nutricentials skincare products. The company also provides wellness products, such as LifePak nutritional supplements, ageLOC TR90 weight management system and Beauty Focus Collagen+. In addition, it is involved in the research and product development of skincare products and nutritional supplements. The company sells its products under the Nu Skin, Pharmanex and ageLOC brands through retail stores, website, digital platforms and independent direct sellers and marketers, as well as a service center. Nu Skin Enterprises, Inc. was founded in 1984 and is headquartered in Provo, Utah.
In June, the stock declined by 7.4% compared to May 2025. For the year, the stock is up 16%. Since the direct selling index was established in February 2020, their stock has declined 66.1%. The stock’s 52-week high is $11.64 and the low was $5.32. Analysts predict a growth estimate of 23.25% for 2025. Additional financial data is at the end of this report.
Nu Skin’s stock remains under pressure after a short-term rebound earlier this year, with valuation still attractive relative to cash flow and growth prospects, making it a potential value play.
In June, Nu Skin announced the appointment of James Winett to its Board of Directors, strengthening governance and signaling a renewed focus on operational strategy in a competitive direct-selling environment. Institutional ownership remains high at approximately 75%, while insider ownership is low, indicating confidence from large investors but limited internal equity exposure.
The company continues to face challenges with revenue momentum, as highlighted by some analysts, but margin improvements and cash on hand from the Mavely sale provide room to invest in product innovation and distributor incentives.
Nu Skin’s ISS Governance QualityScore in June was reported as 3 out of 10, with room for improvement particularly in shareholder rights and board structure. The recent addition of Winett is expected to improve board oversight. Analysts maintain a cautious but constructive outlook, reiterating the importance of delivering stronger sales trends and sustaining margins.
The company’s next earnings report for Q2 2025 is expected to provide further insight into the progress of its growth initiatives, especially in emerging markets and with new products like Prysm iO. Management continues to emphasize the value of combining innovative products with a competitive compensation plan for distributors as the key to long-term success.
Herbalife Ltd. (NYSE: HLF), together with its subsidiaries, provides health and wellness products across North America, Mexico, South and Central America, Europe, the Middle East, Africa, China and Asia Pacific. The company offers products in the areas of weight management; targeted nutrition; energy, sports, and fitness; outer nutrition; and literature, promotional and other materials. Herbalife’s offerings include protein shakes, meal replacements, healthy snacks, metabolism-boosting teas, dietary supplements with natural ingredients, skincare and body care products and energy drinks. These are sold through sales representatives, independent service providers and company-operated retail stores and platforms. Founded in 1980 and headquartered in Los Angeles, California, the company changed its name from Herbalife Nutrition Ltd. to Herbalife Ltd. in April 2023.
For the month of June 2025, Herbalife’s stock rose by 10.45%, continuing its positive momentum. Year-to-date, the stock has increased by 28.8%, making it the only large-cap stock to post a positive return in the first six months of 2025. However, HLF remains down 73.4% since the establishment of the DSCI on February 1, 2020.
Herbalife continues to trade at 16.3% below estimates of its fair value, suggesting potential upside if momentum sustains. The company saw earnings grow by 104.4% over the past year and currently trades at a better value compared to its industry peers. Despite this, earnings are forecast to decline by an average of 9.2% annually over the next three years. Interest payments remain poorly covered by earnings, and the company continues to operate with negative shareholder equity, alongside large one-off items that distort its core financial performance.
In June, Herbalife was recognized by U.S. News & World Report as one of the Best Companies to Work For (2025–2026), highlighting the company’s focus on internal culture and employee satisfaction. Additionally, the company received a Scientific Achievement Award from AOAC International for developing an analytical method to identify aloin content in Aloe Vera products, underscoring Herbalife’s commitment to product quality and safety.
With recent management changes, ongoing product innovation and stronger-than-expected stock performance in 2025, Herbalife is a company worth monitoring closely in the coming months—especially with its Q2 earnings report scheduled for August 6, 2025.
Medifast, Inc. (NYSE: MED), through its subsidiaries, operates as a health and wellness company offering habit-based, coach-guided lifestyle solutions focused on weight management and obesity support in the United States. The company’s flagship brand, OPTAVIA, delivers clinically-supported weight loss programs, GLP-1 support plans and a wide variety of food products—such as bars, shakes, soups, cereals and snacks—complemented by one-on-one coaching, digital tools, and community support. Medifast was founded in 1980 and is headquartered in Baltimore, Maryland. Its products are sold via point-of-sale transactions and ecommerce.
For the month of June 2025, shares of Medifast declined by 0.1% compared to May. Year-to-date, the stock is down 20.3%, and since the establishment of the DSCI on February 1, 2020, the stock has declined by 82.3%, making it the worst-performing large-cap DSCI member over the long term.
Medifast continues to navigate a major business transition, most notably through its strategic pivot toward GLP-1 integration, including the rollout of OPTAVIA ASCEND™, a high-protein product line designed for individuals using GLP-1 medications or seeking medically-guided weight management support. While this direction reflects an attempt to remain competitive in a changing health and nutrition landscape, the market response has been measured.
The company maintains a debt-free balance sheet and strong liquidity, but revenue pressures and growing competition in the weight-loss sector, especially from prescription GLP-1 drugs, continue to weigh on performance. Analysts remain neutral overall, citing Medifast’s stable fundamentals but uncertain growth outlook. The company’s upcoming earnings report, expected later in July, will be a critical moment for evaluating the progress of its transformation strategy.
Despite modest product momentum and a solid financial base, investor sentiment remains cautious amid broader uncertainty in the direct selling and weight-loss industries.
USANA Health Sciences, Inc. (NYSE: USNA) develops, manufactures and sells science-based nutritional, personal care and skincare products across Asia Pacific, the Americas, and Europe. The company operates through two segments: direct selling and Hiya direct-to-consumer. Its product lineup includes USANA Nutritional Optimizers for cardiovascular, skeletal and digestive health; Essentials/CellSentials—vitamin and mineral supplements for all ages beginning at 13 months; and food products such as meal replacement shakes and snack bars for healthy weight management, digestive health and hydration. USANA also offers the Celavive skincare line tailored for various skin types and ethnicities, as well as online tools and business materials for associates. Products are sold through retail, subscription-based models and direct selling. The company holds research collaboration agreements with the Beijing University of Chinese Medicine and the National Sports Training Bureau. USANA was founded in 1992 and is headquartered in Salt Lake City, Utah.
For the month of June 2025, USANA’s stock rose by 2.2% compared to May, continuing a modest upward trend. Year-to-date, the stock is down 14.9%, reflecting underperformance relative to broader markets and peers. Since the establishment of the DSCI on February 1, 2020, USANA shares have lost 53.8%, while the Direct Selling Index and the DJIA have gained 66.4% over the same period.
USANA continues to benefit from strong financial fundamentals, including solid gross margins and a stable balance sheet. Technical indicators show positive momentum, with the stock reaching a 2025 high in early July. However, several challenges persist, including declining revenues, cautious consumer sentiment and global trade uncertainties. The company’s valuation is considered fair, but the lack of a dividend yield may limit its appeal to income-focused investors.
In June, USANA was recognized with five Best-of-State awards, including accolades for its CellSentials supplement line, Celavive skincare products, R&D efforts, and community programs. The company also gained industry visibility when CEO Jim Brown was elected to the Board of the Direct Selling Association (DSA). On a more cautious note, Director John T. Fleming sold 500 shares in early June, a potential signal of limited short-term confidence from inside the company.
With its next earnings report scheduled for July 22, 2025 and a steady stream of both operational progress and ongoing challenges, USANA remains a stock to watch as it navigates the remainder of the year.
eXp World Holdings, Inc. (NASDAQ: EXPI), together with its subsidiaries, provides cloud-based real estate brokerage services for residential homeowners and homebuyers. It operates through three segments: North American Realty, International Realty and Other Affiliated Services. The company acts as a licensed broker for processing residential and commercial real estate transactions and provides other real estate support services. It also offers FrameVR.io, a web-accessible proprietary technology offering immersive 3D platforms; magazine and its related media properties which provide training, classes, resources and tools under the SUCCESS brand; SUCCESS Space, a coworking solution offering rental workspaces for individual and group use, access to professional development coaching, media production services, virtual-world communications technology and full-service cafes. It operates in North America, Canada, the United Kingdom, Australia, South Africa, India, Mexico, Portugal, France, Puerto Rico, Brazil, Italy, Hong Kong, Colombia, Spain, Israel, Panama, Germany, the Dominican Republic, Greece, New Zealand, Chile, Poland and Dubai. The company was formerly known as eXp Realty International Corporation and changed its name to eXp World Holdings, Inc. in May 2016. eXp World Holdings, Inc. was incorporated in 2008 and is headquartered in Bellingham, Washington.
The stock price increased 6.8% in June vs. May 2025. For the first six months of 2025, their stock price has declined by 20.9%. More constructively, EXPI shares have appreciated an aggregate 90.4% over the five years the DSCI has been computed, the third best long-term mark for any DSCI member. Additional financial data is at the end of this report.
eXp shares rebounded in June after several months of declines, helped by positive sentiment ahead of the company’s Q2 earnings report and strength in international segment revenue. However, the company continues to face challenges with agent and broker growth, which remains flat at approximately 81,900. This stagnation points to increasing market competition and potential saturation, which could weigh on long-term transaction volume growth and profitability.
The company reported in its most recent earnings release that Q1 2025 revenue rose slightly to $954.9 million, while net loss widened to $11 million or $0.07 per share. Adjusted EBITDA was positive at $2.2 million, but operating margins remain thin. Management highlighted strong sales growth internationally, with revenue more than doubling in several markets outside North America.
eXp’s five-year average return on invested capital (ROIC) remains negative at -24.4%, indicating challenges in translating expansion into profitability. Operating expenses and an inefficient cost structure have been cited as key areas for improvement.
The company’s ISS Governance QualityScore for June was 6 out of 10, with strengths in shareholder rights but weaknesses in board composition and compensation practices. Institutional ownership remains high, while insider ownership is minimal, reflecting stable but limited internal alignment.
Management reiterated its focus on global expansion, technology innovation and improving its agent value proposition as the core strategies to reignite growth and enhance long-term shareholder value. Investors are expected to closely watch the upcoming Q2 earnings report in July for further signs of improving trends in agent count, profitability and international momentum.
Primerica, Inc. (NYSE: PRI), together with its subsidiaries, provides financial products and services to middle-income households in the United States and Canada. The company operates in three segments: Term Life Insurance; Investment and Savings Products; Senior Health; and Corporate and Other Distributed Products. The Term Life Insurance segment underwrites individual term life insurance products. The Investment and Savings Products segment provides mutual funds and various retirement plans, managed investments, variable and fixed annuities and fixed indexed annuities and offers segregated funds. The Corporate and Other Distributed Products segment provides mortgage loans; prepaid legal services that assist subscribers with legal matters, such as drafting wills, living wills and powers of attorney, trial defense and motor vehicle-related matters; ID theft defense services; auto and homeowners’ insurance; home automation solutions; and insurance products, including supplemental and accidental death and disability insurance. It distributes and sells its products through licensed sales representatives. Primerica, Inc. was founded in 1927 and is headquartered in Duluth, Georgia.
In June, the stock price increased by 1.1% vs. May 2025. For the first six months of 2025, the stock has a slight decline of 0.8%. PRI has appreciated 149.8% since February 1, 2020, the best long-term performance for any DSCI member. Additional financial data is at the end of this report.
Primerica shares posted modest gains in June, continuing their steady performance despite ongoing pressures from rising costs of living among its client base. The company remains the strongest long-term performer among DSCI members, reflecting its ability to maintain market leadership and generate consistent cash flows.
The Primerica Household Budget Index™ (HBI) for May 2025, released in June, came in at 99.7%, up slightly from April’s 99.6%, suggesting that middle-income households continue to see their purchasing power largely stable amid mixed inflation signals. According to Primerica’s consulting economist Amy Crews Cutts, “The steady HBI readings show that wage growth is keeping pace with increases in essential expenses, although families remain vulnerable to spikes in volatile food and energy prices.”
Management continues to focus on expanding its licensed representative base and enhancing its suite of financial wellness products to better serve middle-income families coping with inflationary pressures. Analysts view the company’s disciplined underwriting standards and strong capital position as key to sustaining profitability even if household budgets tighten further.
The company is expected to report Q2 earnings in late July, with analysts looking for evidence of continued stability in term life sales and positive trends in investment product flows.
Founded in 2003, Oliveda International, Inc. (OTC: OLVI) has more than 20 years of experience in: 1) the management and organic certification of mountain olive trees; 2) the extraction of international award-winning extra virgin olive oils; 3) the extraction of hydroxytyrosol, a substance which has several beneficial effects such as antioxidant, anti-inflammatory and as a protector of skin and eyes; and 4) the production and distribution of cosmetic and holistic waterless products related to the olive tree.
Oliveda International, Inc. and its subsidiary, Olive Tree People Inc., as well as the European companies, Olive Tree People Europe AG and Oliveda Deutschland GmbH, and Olive Tree Farmers SL, were founded by the German real estate investor Thomas Lommel and have more than 20 years of experience in the management and organic certification of growing mountain olive trees, the extraction of first-class, internationally award-winning extra virgin olive oils, the extraction of hydroxytyrosol, and in the production and distribution of cosmetic and holistic waterless products related to the olive tree. Lommel is the inventor of the Olive Tree Therapy 10 years in 14 days as well as the inventor of olive matcha, which is based on the ground olive leaf. Also unique is the coffee replacement developed by Lommel, which is based on olive leaf and hydroxytyrosol. In addition, Lommel is successfully active in the rapidly growing mindfulness industry with the olive tree sound bath meditation he developed and the frequencies of his olive trees, which he makes available worldwide.
In addition to the registered beauty brands Oliveda and LA Dope, as well as Re:connected to Nature, The Intuition of Nature and Olive Mush, to name just a few, Lommel is the region’s largest conservationist and protector of over 30,000 one-hundred-year-old mountain olive trees, and, with his Thomas Lommel Foundation, he brings the water that he does not use in his waterless beauty products to the people of Africa by building water wells on site.
In addition to online sales and a Europe-wide branch network of thousands of retail stores, Oliveda Deutschland GmbH operates its own flagship stores in Berlin and Düsseldorf.
Comparing June 2025 to May 2025, the stock price declined by 47.2%. For the first six months of 2025, the stock declined by 61.7%.
Despite the sharp stock price decline, OLVI announced the launch of its leading “waterless beauty” product line in Canada, marking a significant step in its international expansion strategy. This move is expected to diversify the company’s revenue streams and increase its global footprint.
CEO Thomas Lommel commented, “It wasn’t my goal to achieve a valuation of over $1 billion, but rather to bring the magic of our trees to the world. I had no idea about waterless beauty and developed it intuitively in the treehouse, simply because it makes so much more sense. For me, trees cannot be measured in money, as we wouldn’t exist without them. The magic emanating from our mountain olive trees cannot be measured in dollars, as they enable us humans to become healed and whole every day.”
The company has confirmed a valuation of over $1 billion after just two years, reflecting strong investor confidence despite recent stock volatility.The Beachbody Company, Inc. (NYSE: BODI) operates as a fitness and nutrition company in the United States and internationally. The company offers Beachbody on Demand, a subscription streaming service providing fitness programs such as P90X, Insanity and 21 Day Fix; nutrition programs including Portion Fix and 2B Mindset; and nutritional products like Shakeology shakes and Beachbody Performance supplements. The company also faces legal challenges in California, where efforts are underway to reclassify independent consultants as employees, which may impact its direct selling model.
In June, the stock price increased by 11.7% compared to May 2025. For the first six months of 2025, the stock price declined by 33%. Recent developments include the launch of the new BODi program, focused on digital fitness and nutrition and a $35 million funding round from Tiger Capital Group to support growth initiatives.
The stock’s recovery in June suggests potential stabilization after previous declines, with new product launches and financial backing providing optimism for future growth.
Below are two summary diagrams on the direct selling large cap companies.


Small Cap
Below are two charts on the small companies as well as June information for the two largest small cap companies, Natures Sunshine and LifeVantage.
Nature’s Sunshine Products, Inc. (NASDAQ: NATR), a natural health and wellness company, manufactures and sells nutritional and personal care products in Asia, Europe, North America, Latin America and other international markets. The company provides general health products related to blood sugar support, bone health, cellular health, cognitive function, joint health, mood, sexual health, sleep, sports and energy and vision; immune products; cardiovascular products; and digestive products. It also offers personal care products, including oils and lotions, aloe vera gel, herbal shampoo, herbal skin treatment, toothpaste, and skin cleanser products, as well as weight management products. The company provides its products under the Nature’s Sunshine Products and Synergy WorldWide brands directly to customers and to a sales force of independent consultants. Nature’s Sunshine Products, Inc. was founded in 1972 and is headquartered in Lehi, Utah.
In June, their stock price declined by 4.3% vs. May 2025, the largest decline among the small cap direct selling companies. For the first six months of 2025, the stock increased by 0.9%. Since the inception of the DSCI, NATR has gained 90.4%, the largest of any small cap stock and the second largest of any company in the DSCI.
During the month, the company announced that CEO Terrence Moorehead would step down from his role upon the appointment of a successor, while reaffirming its full-year financial outlook. Following this announcement, the stock fell approximately 7–8% in the morning session, indicating that the market views the leadership change as significant but not fundamentally altering the company’s outlook.Later in June, Fosun Pharma USA, previously the company’s largest shareholder, sold nearly all of its stake (about 2.85 million shares) in a secondary public offering at a price of $11.46 per share, putting additional pressure on the stock during the month.
Nature’s Sunshine’s shares remain volatile, with 17 moves greater than 5% over the last year. In that context, June’s move reflects investor concerns about leadership transition and shareholder changes, while the long-term fundamentals of the business remain intact.
LifeVantage Corporation (NASDAQ: LFVN) engages in the identification, research, development, formulation and sale of advanced nutrigenomic activators, dietary supplements, nootropics, pre- and pro-biotics, weight management and skincare and hair care products. It offers Protandim, a dietary supplement; LifeVantage Omega+, a dietary supplement that combines DHA and EPA Omega-3 fatty acids, Omega-7 fatty acids and vitamin D3; LifeVantage ProBio, a dietary supplement to support gut health; LifeVantage IC Bright, a supplement to support eye and brain health, reduce eye fatigue and strain, supports cognitive functions, and support normal sleep patterns; LifeVantage Daily Wellness, a dietary supplement designed to strengthen immune health; LifeVantage Rise AM & Reset PM System that provides the body with the right nutrients; LifeVantage D3+, a dietary supplement that provides vitamin D3, vitamin K2, magnesium, calcium and other trace minerals to support a balanced immune system, strong bones, and cardiovascular health; PhysIQ Fat Burn to support weight management; PhysIQ Prebiotic is a dietary supplement designed to support the good bacteria in the gut and a healthy microbiome; Petandim for Dogs, a supplement to combat oxidative stress in dogs; and Axio, a nootropic energy drink mix. The company also provides anti-aging skincare products, including liquid collagen, facial cleansers, eye cream, moisturizing cream, sunscreen, perfecting lotions, hand creams as well as hair care products, such as invigorating shampoos, nourishing conditioners and scalp serums under the TrueScience brand name. It sells its products through its website and network of independent consultants in the United States, Mexico, Japan, Australia, Hong Kong, Canada, Thailand, the United Kingdom, the Netherlands, Germany, Taiwan, Austria, Spain, Ireland, Belgium, New Zealand, Singapore and the Philippines. The company also launched Evolve Compensation Plan and other LV360 initiatives into the Philippines, Taiwan, Hong Kong and Singapore. The company is based in Lehi, Utah.
In June, their stock price increased by 0.2% vs. May 2025. For the first six months of 2025, the stock price has declined 25.4%. Since the February 1, 2020 establishment of the DSCI, LFVN has gained 9.8%.
LifeVantage delivered modest stock price gains in June, showing signs of stabilization after a steep year-to-date decline. The company’s underlying fundamentals remain solid, supported by strong free cash flow generation and impressive EPS growth over the past year. In mid-June, institutional investors, including Millennium Management, increased their positions in the stock, signaling cautious optimism. While LFVN briefly traded below its 200-day moving average during the month, the late-month rebound suggests investors still have confidence in the company’s long-term growth prospects as it expands its global footprint.
LifeVantage’s shares remain volatile, and June’s muted move reflects a market still assessing the company’s trajectory amid ongoing global expansion and operational improvements.
Below are two summary diagrams on the direct selling small cap companies.


Short Interest Data & AnalysisThe following chart is an aggregate index of “days to cover” among the entire tracking set. Days to cover (DTC) is a measurement determined by dividing the total outstanding short interest by average daily trading volume.

As indicated in the chart, short interest in DSCI stocks was 5.4 days as of June 15, 2025. Short interest can be a difficult indicator to analyze. On the one hand, an increase in short interest can be a bearish sign in that it indicates an increased view among investors that a stock is likely to decline based on any number of factors, such as a belief that the company’s fundamentals are deteriorating or that it has run too far, too fast. On the other hand, as a stock moves higher, a significant short interest can serve as extra fuel on the fire as investors scramble to “buy to cover” their short positions and mitigate losses.

Analyst Sentiment IndexThe DSCA Analyst Sentiment Index is a consensus tracking tool that aggregates and averages the recommendations of all covering analysts across all public direct selling companies.

-
May 2025
Brought to you by Direct Selling Capital Advisors
Direct Selling Index Mirrors the DJIA for the Month of May 2025
The Direct Selling Capital Advisors Direct Selling Index (DSCI) increased by 4.3% in May vs. April 2025. The DJIA increase by 4.1% in May vs. April. Over the first five months of 2025, the DSCI has a small increase of 0.086%. There seems to be an ongoing challenge with tariffs and the geopolitical landscape. Comparing the DSCI vs. the DJIA since the inception of the DSCI, the DSCJ return is 68.4%. This demonstrates the long-term resilience of the our channel.


Tariff concerns had already abated by the time May began, and investors seemed to grow more comfortable with the economic uncertainty as the month wore on. Investor sentiment surveys had shown more bears than bulls for 15 consecutive weeks dating back to mid-February. Those surveys flipped in favor of optimism by late May.
Some formal trade deals certainly helped. On May 8, the US and the UK announced a trade agreement that will exempt key British industries (cars, steel and beef among them) from President Donald Trump’s reciprocal tariffs.
On May 12, the US and China agreed to a temporary truce that reduced tariffs on US goods to 10% (down from 125%) and tariffs on Chinese goods to 30% (down from 145%). These reductions will remain in place for 90 days (until mid-August) while the two nations continue dialogue on a more permanent trade deal. Stocks soared on the US-China news, with the S&P 500 rising 3.3%.
Bond yields also increased following the positive US-China developments. Ten-year US Treasury yields climbed as high as 4.63% on May 22 (their highest mark since February) and ended the month at 4.42%. We foresee several reasons why yields are likely to fall in the coming months. Investors who have favored money market funds for their conservative dollars would be wise to consider bonds instead.
The Federal Reserve announced no changes to interest rates following its May 6-7 meeting and consensus projections now suggest two 0.25% rate cuts by year-end. The first of those is likely to come in either July or September. To its credit, the Fed has remained patient with regards to monetary policy and potential rate cuts.
With first-quarter earnings season nearly complete, S&P 500 companies have grown earnings by 13.3% compared to a year earlier. That is nearly twice the consensus of 7.1% growth projected as of March 31. It’s also the second consecutive quarter with earnings growth greater than 10% (following 18% year-over-year growth in Q4 2024).
First quarter GDP was revised in May to show a 0.2% contraction (read: “negative growth”), slightly better than initial reports suggesting -0.3%. We will find out in late July whether the US economy is in a recession, and it will be interesting to quantify some of the economic impact from tariffs.
Some have speculated that tariffs could actually boost GDP in the short-term since consumers may have purchased more goods in an attempt to avoid higher prices once tariffs are implemented. So far, US consumer spending has remained steady, increasing 0.2% month-over-month based on the most recent data.
International stocks lagged US equities in May but their year-to-date performance remains superior. Non-US-developed equities gained 4.8% last month and are up 17.5% so far this year. Emerging markets rose 4% in May and have increased 8.9% year-to-date.
A Republican-led tax bill passed the US House of Representatives in late May but still faces hurdles in the US Senate. If eventually signed into law, the bill would make permanent most of the 2017 income tax and estate tax cuts originally passed during Trump’s first term as president. In doing so, it would add roughly $4 trillion to the US debt, according to the Congressional Budget Office.
The US inflation rate continues to moderate with the April Consumer Price Index (CPI) falling to 2.31%. This was the lowest reading for the headline number since prior to the post-COVID spike that began in 2021. The Core Inflation Rate that strips out the more volatile food and energy prices also continues to trend in the right direction, coming in at 2.78%, which was roughly unchanged from the previous month.
Highlights
- Inflation continues to moderate
- Stocks had one of their best months since November of 2023
- The S&P is now up for 2025 and back near all-time highs
- Fixed income returns were impacted by rising rates
Looking Forward
The direct selling channel has some significant headwinds in near future due to a lot of uncertainty in the global marketplace. We are seeing more companies moving away from a sole dependency for distributors to drive revenue through an omnichannel strategy. At the same time, we are seeing companies committed to the MLM business model showing growth.
The Direct Selling Capital Advisors Index (DSCI) is a market capitalization weighted index of all domestic public direct selling companies with a market capitalization of at least $25 million. The index is rebalanced monthly, and no single issue is permitted to represent more than 20% of its total value. In such an event, the excess weighting would be redistributed among the other index components.
Large Cap
Note: For the purposes of this report, Direct Selling Capital considers companies with a market capitalization in excess of $1 billion “Large Cap.”
Betterware de Mexico (NASDAQ: BWMX) Founded in 1995, Betterware de Mexico is the leading direct-to-consumer company in Mexico focused on offering innovative products that solve specific needs related to household organization, practicality, space-saving and hygiene. Through the acquisition of JAFRA on April 7, 2022, the Company now offers a leading brand of direct-to-consumer in the beauty market in Mexico and the United States where it offers fragrances, color & cosmetics, skincare and toiletries. The combined company possesses an asset-light business model with low capital expenditure requirements and a track record of strong profitability, double digit rates of revenue growth and free cash flow generation. Today, the Company distributes its products in Mexico and in the United States of America.
Their stock price declined by 20% in May, bringing its YTD decline to -29.2%. Since the March 1, 2020 inception of the DSCI, BWMX has declined by 15.9%. Additional financial data is at the end of this report.
Active investors aim to buy stocks that vastly outperform the market but, in the process, they risk under-performance. That downside risk was realized by Betterware. Shareholders over the last year, as the share price declined 44%. That’s disappointing when you consider the market returned 13%. Longer term shareholders haven’t suffered as badly, since the stock is down a comparatively less painful 27% in three years. Furthermore, it’s down 25% in about a quarter. This could be related to the recent financial results; you can catch up on the most recent data by reading our company report.
Unfortunately, Betterware reported an EPS drop of 51% for the last year. We note that the 44% share price drop is very close to the EPS drop. So, it seems that the market sentiment has not changed much, despite the weak results. Rather, the share price remains a similar multiple of the EPS, suggesting the outlook remains the same.
Analysist have noted a few key risks with the future stock performance. First, their interest payments are not well covered by earnings. We have seen how problematic that has been for direct selling companies that have excessive debt. Second, profit margins (4.1%) are lower than last year (8.7%). Third, dividends of 17.51% are not well covered by earning.
Nu Skin Enterprises, Inc. (NYSE: NUS), together with its subsidiaries, engages in the development and distribution of various beauty and wellness products worldwide. It offers skincare devices, cosmetics and other personal care products, including ageLOC LumiSpa and ageLOC LumiSpa iO; and nutricentials skincare products. The company also provides wellness products, such as LifePak nutritional supplements, ageLOC TR90 weight management system and Beauty Focus Collagen+. In addition, it is involved in the research and product development of skincare products and nutritional supplements. The company sells its products under the Nu Skin, Pharmanex and ageLOC brands through retail stores, website, digital platforms and independent direct sellers and marketers, as well as a service center. Nu Skin Enterprises, Inc. was founded in 1984 and is headquartered in Provo, Utah.
In May, the stock increased by 42.4% compared to April 2025. For the year, the stock is up 25.3%. Since the direct selling index was established in March 2020, their stock has declined 63.4%. The stock’s 52-week high is $14 and the low was $5.32. Analysts predict a growth estimate of 23.25% for 2025. Additional financial data is at the end of this report.
Nu Skin’s stock has found long-term technical support after a steep decline, with an attractive valuation and improving free cash flow, making it a potential value play.
Q1 2025 earnings beat expectations, with margin improvements and strong growth prospects in Latin America and India, plus a cash boost from the Mavely sale.
Innovative products like Prysm iO aim to drive customer engagement and recurring revenue, but stronger revenue growth is needed to offset compensation costs.
The recent sale of Mavely for a $176 million cash gain has boosted Nu Skin’s cash position and reduced outstanding debt to $155 million. The boost in liquidity is encouraging, given management’s plan to double down on what has been working for the company. To this point, the CEO knows full well that the best lineup of products combined with an excellent compensation plan (where leaders are rewarded generously) is the only way to succeed in a highly competitive direct selling environment.
Herbalife Nutrition, Inc. (NYSE: HLF), together with its subsidiaries, provides health and wellness products in North America, Mexico, South and Central America, Europe, the Middle East, Africa, China and the Asia Pacific. The company offers products in the areas of weight management; targeted nutrition; energy, sports and fitness; outer nutrition; and literature, promotional and other items. It also provides weight management products, including meal replacement products, protein shakes, drink mixes, weight loss supplements, healthy snacks and metabolism boosting teas; targeted nutrition products, which comprise functional beverages; and dietary and nutritional supplements that contain herbs, vitamins, minerals and other natural ingredients; outer nutrition products, such as facial skin, body and hair care products; and energy, sports and fitness products, including N-R-G tea and energy drink products. In addition, it offers literature, promotional and other materials that comprise start-up kits, sales tools and educational materials. The company sells its products through sales representatives, independent service providers and company-operated retail stores and platforms. The company was formerly known as Herbalife Nutrition Ltd. and changed its name to Herbalife Ltd. in April 2023. Herbalife Ltd. was founded in 1980 and is headquartered in Los Angeles, California.
For the month of May, their stock increased by 10.5%. Year-to-date, their stock has increased by 16.7%, the only large cap stock that has had a positive return for the first four months of 2025. Conversely, HLF is down 75.9% since the establishment of the DSCI on March 1, 2020.
Their stock is trading at 16.3% below estimates of its fair value. Earnings grew by 104.4% over the past year. Trading at good value compared to peers and industry. However, earnings are forecast to decline by an average of 9.2% per year for the next 3 years. Interest payments are not well covered by earnings. The company has negative shareholder equity and large one-off items impacting their financial success. With recent acquisition and management changes, Herbalife is worth keep an eye on in the coming months.
Medifast, Inc. (NYSE: MED), through its subsidiaries, operates as a health and wellness company that provides habit-based and coach-guided lifestyle solutions to address obesity and support a healthy life in the United States. The company offers weight loss and weight management plans; and GLP-1 support plans that provide access to GLP-1 medications where clinically appropriate under the OPTAVIA brand name. It also provides bars, puffs, cereal, crunchers, drinks, hearty choices, oatmeal, pancakes, pudding, soft serve, shakes, smoothies, soft bakes and soups, as well as provides coaching support along with community, nutrition and healthy habits, and helps people in their weight loss journey. It markets its products through point-of-sale transactions, as well as through ecommerce platform. Medifast, Inc. was founded in 1980 and is headquartered in Baltimore, Maryland.
In May, shares increased by 12.6% compared to April 2025. For the first five months of 2025, their stock price declined by 20.1%. MED is the worst performing DSCI large cap member on a long-term basis; since the March 1, 2020 establishment of the DSCI, the stock has declined 82.3%. As Medifast continues to transition the company, most analyst are neutral on the company.
USANA Health Sciences, Inc. (NYSE: USNA). develops, manufactures and sells science-based nutritional, personal care and skincare products in the Asia Pacific, the Americas and Europe. It operates in two segments, direct selling and Hiya Direct-To-Consumer. The company offers USANA nutritional optimizers, including supplements for cardiovascular health, skeletal/structural health and digestive health; Essentials/CellSentials, such as vitamin and mineral supplements for age groups beginning with children 13 months of age; and food products that include meal replacement shakes, snack bars and other related products for healthy weight management, digestive health and energy and hydration. It also provides Celavive, a skincare regimen for various skincare types and ethnicities; and all other products comprising materials and online tools for associates to build business and marketing of products. The company sells its products through retail customers, a subscription model and direct selling, as well as online. The company has a research collaboration agreement with Beijing University of Chinese Medicine and National Sports Training Bureau. USANA Health Sciences, Inc. was founded in 1992 and is headquartered in Salt Lake City, Utah.
In May, their stock value increased by 7.1% vs. April 2025. For the first five months of 2025, the stock declined by 16.8%%. Since the creation of the DSCI on March 1, 2020, USANA shares have lost 54.8% compared with gains of 66.4% for the direct selling index and the DJIA, respectively.
USANA Health’s stock is supported by strong financial fundamentals, with robust gross margins and a solid balance sheet. The positive momentum in technical indicators and promising growth trajectory from recent earnings calls are significant positives. However, challenges like declining revenues, cautious consumer sentiment and trade uncertainties slightly temper the overall outlook. The stock’s valuation is fair, but the lack of dividend yield may not appeal to all investors.
eXp World Holdings, Inc. (NASDAQ: EXPI), together with its subsidiaries, provides cloud-based real estate brokerage services for residential homeowners and homebuyers. It operates through three segments: North American Realty, International Realty and Other Affiliated Services. The company acts as a licensed broker for processing residential and commercial real estate transactions; and provides other real estate support services. It also offers FrameVR.io, a web-accessible proprietary technology offering immersive 3D platforms; magazine and its related media properties which provide training, classes, resources and tools under the SUCCESS brand; SUCCESS Space, a coworking solution offering rental workspaces for individual and group use, access to professional development coaching, media production services, virtual-world communications technology and full-service cafes. It operates in North America, Canada, the United Kingdom, Australia, South Africa, India, Mexico, Portugal, France, Puerto Rico, Brazil, Italy, Hong Kong, Colombia, Spain, Israel, Panama, Germany, the Dominican Republic, Greece, New Zealand, Chile, Poland and Dubai. The company was formerly known as eXp Realty International Corporation and changed its name to eXp World Holdings, Inc. in May 2016. eXp World Holdings, Inc. was incorporated in 2008 and is headquartered in Bellingham, Washington.
The stock price declined 5.0% in May vs. April 2025. For the first four months of 2025, their stock prices has declined by 26.0%. More constructively, EXPI shares have appreciated an aggregate 78.2% over the five years the DSCI has been computed, the third best long-term mark for any DSCI member. Below is the first quarter consolidated financial highlights as compared to the same time a year-ago period. As noted below, the company has some headwinds at this time
- Inability to Grow Agents and Brokers Points to Weak Demand
Revenue growth can be broken down into changes in price and volume (for companies like eXp World, our preferred volume metric is agents and brokers). While both are important, the latter is the most critical to analyze because prices have a ceiling.
Over the last two years, eXp World failed to grow its agents and brokers, which came in at 81,904 in the latest quarter. This performance was underwhelming and implies there may be increasing competition or market saturation. It also suggests eXp World might have to lower prices or invest in product improvements to accelerate growth, factors that can hinder near-term profitability.
- Operating margin is a key measure of profitability. Think of it as net income—the bottom line—excluding the impact of taxes and interest on debt, which are less connected to business fundamentals. eXp World’s operating margin might have fluctuated slightly over the last 12 months but has generally stayed the same. The company broke even over the last two years, inadequate for a consumer discretionary business. Its large expense base and inefficient cost structure were the main culprits behind this performance.
- Growth gives us insight into a company’s long-term potential, but how capital-efficient was that growth? A company’s ROIC explains this by showing how much operating profit it makes compared to the money it has raised (debt and equity). eXp World’s five-year average ROIC was negative 24.4%, meaning management lost money while trying to expand the business. Its returns were among the worst in the consumer discretionary sector.
Primerica, Inc. (NYSE: PRI), together with its subsidiaries, provides financial products and services to middle-income households in the United States and Canada. The company operates in three segments: Term Life Insurance; Investment and Savings Products; Senior Health; and Corporate and Other Distributed Products. The Term Life Insurance segment underwrites individual term life insurance products. The Investment and Savings Products segment provides mutual funds and various retirement plans, managed investments, variable and fixed annuities and fixed indexed annuities; and offers segregated funds. The Corporate and Other Distributed Products segment provides mortgage loans; prepaid legal services that assist subscribers with legal matters, such as drafting wills, living wills and powers of attorney, trial defense and motor vehicle-related matters; ID theft defense services; auto and homeowners’ insurance; home automation solutions; and insurance products, including supplemental and accidental death and disability insurance. It distributes and sells its products through licensed sales representatives. Primerica, Inc. was founded in 1927 and is headquartered in Duluth, Georgia.
In May, the stock price increased by 2.2% vs. April 2025. For the first five months of 2025, the stock has a slight decline of 0.3% for the first four months of 2025. PRI has appreciated 147.0% since March 1, 2020, the best long-term performance for any DSCI member.
The latest Primerica Household Budget Index™ (HBI™) data, a monthly economic metric that examines how inflation and wage trends impact the ability of middle-income families to afford life’s everyday necessities, was 99.6% in April, unchanged from a month ago and up 1.7% from a year ago. Purchasing power held steady as the average earned income of middle-income households rose enough to offset the increase in the cost of necessity goods in April.
The cost of necessity goods for middle-income households rose 0.4% in April, double the average inflation rate represented by the Consumer Price Index, which rose 0.2%. “The fact that the costs of necessity goods bought by middle-income households rose two times faster than the overall CPI in April illustrates how volatile food and energy inflation disproportionately impacts middle-income families who have little room in their budgets for unexpected cost increases,” said Amy Crews Cutts, consulting economist at Primerica. “The official CPI inflation measure doesn’t accurately depict this critical inflation narrative to account for the impact on these families’ budgets month-to-month.”
Oliveda International, Inc. (OTC: OLVI), founded in 2003, has more than 20 years of experience in: 1) the management and organic certification of mountain olive trees; 2) the extraction of international award-winning extra virgin olive oils; 3) the extraction of hydroxytyrosol, a substance which has several beneficial effects such as antioxidant, anti-inflammatory, anticancer and as a protector of skin and eyes; and 4) the production and distribution of cosmetic and holistic waterless products related to the olive tree.
Oliveda International, Inc. and its subsidiary, Olive Tree People Inc., as well as the European companies, Olive Tree People Europe AG and Oliveda Deutschland GmbH, as well as Olive Tree Farmers SL, were founded by the German real estate investor Thomas Lommel and have more than 20 years of experience in management and organic certification growing mountain olive trees, in the extraction of first-class, internationally award-winning extra virgin olive oils, the extraction of hydroxytyrosol, and in the production and distribution of cosmetic and holistic waterless products related to the olive tree. Lommel is the inventor of the Olive Tree Therapy 10 years in 14 days as well as the inventor of olive matcha, which is based on the ground olive leaf. Also unique is the coffee replacement developed by Lommel, which is based on olive leaf and hydroxytyrosol. In addition, Lommel is successfully active in the rapidly growing mindfulness industry with the olive tree sound bath meditation he developed and the frequencies of his olive trees, which he makes available worldwide.
In addition to the registered beauty brands, Oliveda and LA Dope, as well as Re:connected to Nature, The Intuition of Nature, and Olive Mush, to name just a few brands, Lommel is the region’s largest conservationist and protector of over 30,000 one-hundred-year-old mountain olive trees, and, with his Thomas Lommel Foundation, he brings the water that he does not use into his waterless beauty products to the people of Africa by building water wells on site.
In addition to online sales and a Europe-wide branch network of thousands of retail stores, Oliveda Deutschland GmbH operates its own flagship stores in Berlin and Düsseldorf.
Comparing May 2025 to April 2025, the stock price increased by 56.0%. For the first five months of 2025, the stock declined by 27.5%. CEO Thomas Lommel noted that “This hypergrowth naturally also had an impact on the price of our OLVI shares. The company was temporarily valued at over $3 billion and has now settled at over $1 billion after just two years.”
When asked about future developments, Mr. Lommel stated, “It wasn’t my goal to achieve a valuation of over $1 billion, but rather to bring the magic of our trees to the world. I had no idea about waterless beauty and developed it intuitively in the treehouse, simply because it makes so much more sense. For me, trees cannot be measured in money, as we wouldn’t exist without them. The magic emanating from our mountain olive trees cannot be measured in dollars, as they enable us humans to become healed and whole every day.”
The Beachbody Company, Inc. (NYSE: BODI). operates as a fitness and nutrition company in the United States and internationally. The company operates Beachbody on Demand, a streaming service through subscription that provides fitness programs, including P90X, Insanity and 21 Day Fix brands; and offers nutrition programs, through subscription to Beachbody On Demand Interactive, such as Portion Fix and 2B Mindset brands. It also provides nutritional products, such as Shakeology, a nutrition shake; Beachbody Performance supplements comprising pre-workout energize, hydrate, post-workout recovery and protein supplement recharge products; BEACHBAR, a low-sugar snack bar; Belle Vitale, a hormone health solution for women to address symptoms of hormone imbalance; and connected fitness products. The Beachbody Company, Inc. was founded in 1998 and is headquartered in El Segundo, California.
Their stock price declined by 13.2% in May vs. April 2025. For the first five months of 2025, their stock price declined by 40.0%. BODI was the first public company to announce a movement away from a multi-tiered compensation model to a single level affiliated model and clearly show the impact of this type of change.
The company is also facing legal issues in the State of California. California is trying to reclassify independent consultants as employees. We are seeing an increase in other states trying to reclassify independent consultants. In California, they are attempting to treat any independent consultant as an employee if they sell the same products and services of the company they represent in the marketplace. Another direct selling company is currently in litigation over this issue and this lawsuit should provide useful guidance from the courts as it relates to this issue.
In conclusion, the direct selling public companies are flat for the year with slight decline of 0.6% vs. the DJIA average for the first five months of 0.51%. With the level of uncertainty in the marketplace, the markets seem flat and are looking for future guidance on the economic and geopolitical landscape. Below are summaries of the large cap stocks.


Small Cap
Below are two charts on the small companies. Below are the April information for the two largest small cap companies, Nature’s Sunshine and LifeVantage.
Nature’s Sunshine Products, Inc. (NASDAQ: NATR), a natural health and wellness company, manufactures and sells nutritional and personal care products in Asia, Europe, North America, Latin America and internationally. The company provides general health products related to blood sugar support, bone health, cellular health, cognitive function, joint health, mood, sexual health, sleep, sports and energy and vision; immune products; cardiovascular products; and digestive products. It also offers personal care products, including oils and lotions, aloe vera gel, herbal shampoo, herbal skin treatment, toothpaste and skin cleanser products, as well as weight management products. The company provides its products under the Nature’s Sunshine Products and Synergy WorldWide brands directly to customers and to a sales force of independent consultants. Nature’s Sunshine Products, Inc. was founded in 1972 and is headquartered in Lehi, Utah.
In May, their stock price increased by 29.2% vs. April 2025, the largest of the small cap direct selling companies. For the first five months of 2025, the stock increased by 5.5%. Since the inception of the DSCI, NATR has gained 99.1%, the largest of any small cap stock and the second largest of any company in the DSCI.
Terrence Moorehead has notified the Company’s Board of Directors (the “Board”) of his decision to step down as President and Chief Executive Officer, effective upon the appointment of a successor. Upon this announcement, the stock fell 7.2% in the morning session after CEO Terrence Moorehead, announced his decision to step down from his role.
Nature’s Sunshine’s shares are quite volatile and have had 17 moves greater than 5% over the last year. In that context, this move indicates the market considers this news meaningful but not something that would fundamentally change its perception of the business.
LifeVantage Corporation (NASDAQ: LFVN), engages in the identification, research, development, formulation and sale of advanced nutrigenomic activators, dietary supplements, nootropics, pre- and pro-biotics, weight management and skin and hair care products. It offers Protandim, a dietary supplement; LifeVantage Omega+, a dietary supplement that combines DHA and EPA Omega-3 fatty acids, Omega-7 fatty acids and vitamin D3; LifeVantage ProBio, a dietary supplement to support gut health; LifeVantage IC Bright, a supplement to support eye and brain health, reduce eye fatigue and strain, supports cognitive functions and support normal sleep patterns; LifeVantage Daily Wellness, a dietary supplement designed to strengthen immune health; LifeVantage Rise AM & Reset PM System that provides the body with the right nutrients; LifeVantage D3+, a dietary supplement that provides vitamin D3, vitamin K2, magnesium, calcium and other trace minerals to support a balanced immune system, strong bones and cardiovascular health; PhysIQ Fat Burn to support weight management; PhysIQ Prebiotic is a dietary supplement designed to support the good bacteria in the gut and a healthy microbiome; Petandim for Dogs, a supplement to combat oxidative stress in dogs; and Axio, a nootropic energy drink mix. The company also provides anti-aging skincare products, including liquid collagen, facial cleansers, eye cream, moisturizing cream, sunscreen, perfecting lotions, hand creams, as well as hair care products, such as invigorating shampoos, nourishing conditioners and scalp serums under the TrueScience brand name. It sells its products through its website and network of independent consultants in the United States, Mexico, Japan, Australia, Hong Kong, Canada, Thailand, the United Kingdom, the Netherlands, Germany, Taiwan, Austria, Spain, Ireland, Belgium, New Zealand, Singapore and the Philippines. The company also launched Evolve Compensation Plan and other LV360 initiatives into the Philippines, Taiwan, Hong Kong and Singapore. The company is based in Lehi, Utah.
Their stock increased in May vs. April by 5.7%. For the first five months of 2025, the stock price has declined 25.6%. Since the March 1, 2020 establishment of the DSCI, LFVN has gained 9.8%.
Happily for shareholders, LifeVantage produced plenty of free cash flow to back up its statutory profit numbers. Because of this, LifeVantage’s underlying earnings potential is as good as, or possibly even better, than the statutory profit makes it seem. And on top of that, its earnings per share have grown at an extremely impressive rate over the last year. As the company expands into new products globally, they should see continued revenue growth.
Below are two summary diagrams on the direct selling small cap companies.
On May 5, 2025, NATR reported on their first quarter 2025 and noted the following.
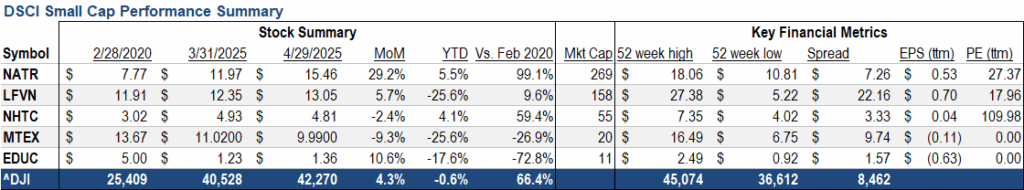

Short Interest Data & Analysis
The following chart is an aggregate index of “days to cover” among the entire tracking set. Days to cover (DTC) is a measurement determined by dividing the total outstanding short interest by average daily trading volume.

As indicated in the chart, short interest in DSCI stocks was 4.9 days as of May 15, 2025. Short interest can be a difficult indicator to analyze. On the one hand, an increase in short interest can be a bearish sign in that it indicates an increased view among investors that a stock is likely to decline based on any number of factors, such as a belief that the company’s fundamentals are deteriorating or that it has run too far, too fast. On the other hand, as a stock moves higher, a significant short interest can serve as extra fuel on the fire as investors scramble to “buy to cover” their short positions and mitigate losses.
Analyst Sentiment Index
The DSCA Analyst Sentiment Index is a consensus tracking tool that aggregates and averages the recommendations of all covering analysts across all public direct selling companies.

-
April 2025
Brought to you by Direct Selling Capital Advisors
Three Consecutive Months of Decline for the Direct Selling Index and the Dow Jones Industrial Average
The Direct Selling Capital Advisors Direct Selling Index (DSCI) declined 3.5% lower in April. The Dow Jones Industrial Average (DJIA) also fell 2.9% in April. Over the first four months of 2025, the DSCI has declined by 4.7%. After a positive increase in January, the DJIA’s has declined for 3 consecutive months, due to a lot of uncertainty in the global tariffs put in place by the Trump administration. We continue to see the DSCI under perform other major indices. However, the DSCI has over performed vs. other indices. As our channel continues to transition, the DSCI should improve vs. other indices.


There continues to be uncertainty in the marketplace due to President Trump’s near daily announcements regarding potential tariffs on Mexico, Canada, China and the European Union, among others, which has created significant policy uncertainty and weighed on investor sentiment. In addition, recent key economic releases, including retail sales, services PMI (a measure of business activity in the sector) and The Conference Board’s widely followed Consumer Confidence Index, have fallen short of analysts’ expectations.
New data from S&P Global showed its flash composite PMI output index, which captures activity in the services and manufacturing sectors, fell to 51.2 in April, hitting its lowest level in 16 months. Manufacturing activity rose to 50.7, up from 50.2 in March, while services activity fell to 51.4 from 54.4. Readings above 50 indicate an expansion in activity in the sector; readings below 50 indicate contraction.
The United States added 177,000 jobs in April, more than analysts had expected, in the face of broader economic uncertainty sparked by President Donald Trump’s tariffs. Last month’s job gains were a bit softer than the revised 185,000 added in March, according to data released by the Bureau of Labor and Statistics, but ahead of forecasts for 133,000 net new roles in April. The annual unemployment rate remained unchanged at 4.2%.

Transportation and warehousing employers added 29,000 roles in April as consumers and businesses went on a pre-tariff buying spree of foreign goods. Federal government head counts, meanwhile, fell by 9,000 and have declined by 26,000 since January, reflecting the impact of sweeping cuts largely driven by multibillionaire Trump adviser Elon Musk’s Department of Government Efficiency (DOGE) initiative.
Despite the job gains, the report showed signs of a slowing economy elsewhere. Average hourly earnings climbed just 0.17% for the month, below the 0.3% forecast by economists. The share of unemployed people out of work for at least 27 weeks also returned to its pandemic-era high of 23.5%. So did the median unemployment duration, which climbed to 10.4 weeks.
Those latter two figures “both suggest that it is taking longer for unemployed workers to find new opportunities and reinforce a growing divide in the market between those out of work and those who are employed,” Cory Stahle, an economist at Indeed Hiring Lab said in a statement. “So far in 2025, the market has been marked by a low firing, low hiring trend that can’t last forever.”
Over the past 12 months, just three sectors have accounted for about 80 percent of all job growth, according to Vanguard financial group: government; health care and social assistance; and leisure and hospitality. The first two face pressure from DOGE cuts, while leisure and hospitality jobs are vulnerable to Trump’s immigration crackdown, according to Vanguard.
Americans’ confidence in the economy slumped for the fifth straight month to the lowest level since the onset of the COVID-19 pandemic as anxiety over the impact of tariffs takes a heavy toll.
The Conference Board noted that its consumer confidence index fell 7.9 points in April to 86, its lowest reading since May 2020. Nearly one-third of consumers expect hiring to slow in the coming months, nearly matching the level reached in April 2009, when the economy was mired in the Great Recession.
The figures reflect a rapidly souring mood among Americans, most of whom expect prices to rise because of the widespread tariffs imposed by President Donald Trump. About half of Americans are also worried about the potential for a recession, according to a survey by The Associated Press-NORC Center.
“Rattled consumers spend less than confident consumers,” said Carl Weinberg, chief economist at High Frequency Economics, in an email. “If confidence sags and consumers retrench, growth will go down.” A measure of Americans’ short-term expectations for their income, business conditions and the job market plunged 12.5 points to 54.4, the lowest level in more than 13 years. The reading is well below 80, which typically signals an impending recession. More Americans are also now worried that the economy could tip into a recession, with the proportion of consumers expecting a downturn in the next 12 months reaching a two-year high.
The PR Newswire provided a breakdown on consumer confidence that provides a useful summary.
Present Situation
Consumers’ assessments of current business conditions were more positive in April.
- 19.2% of consumers said business conditions were “good,” up from 18.3% in March.
- 16.1% said business conditions were “bad,” down from 16.5%.
Consumers’ views of the labor market weakened in April.
- 31.7% of consumers said jobs were “plentiful,” down from 33.6% in March.
- 16.6% of consumers said jobs were “hard to get,” up from 16.1%.

Expectations Six Months Hence
Consumers’ outlook for business conditions fell further in April.
- 15.7% of consumers expected business conditions to improve, down from 17.8% in March.
- 34.8% expected business conditions to worsen, up from 26.1%.
Consumers’ outlook for the labor market outlook also worsened in April.
- 13.7% of consumers expected more jobs to be available, down from 16.7% in March.
- 32.1% anticipated fewer jobs, up from 28.8%.
Consumers turned negative about their income prospects in April.
- 15.0% of consumers expected their incomes to increase, down from 17.1% in March.
- 18.2% expected their income to decrease, up from 14.9%.
Assessment of Family Finances and Recession Risk
- Consumers’ assessments of their Family’s Current Financial Situation deteriorated in April.
- Consumers’ assessments of their Family’s Expected Financial Situation declined to the lowest level since the question was first asked in 2022.
- Consumers’ Perceived Likelihood of a US Recession over the Next 12 Months increased in April.


 The chart below continues to show the declining confidence that has seen significant declines since the Presidential election in November 2024.
Comments on the current Administration and its policies—both positive and negative—dominated consumers’ write-in responses on what is affecting their views of the economy. Write-in responses also showed that inflation is still a major concern for consumers, and that worries about the impact of trade policies and tariffs in particular are on the rise. There were also more references than usual to economic uncertainty.
One factor that impacts spending is the inflation rate. As you can see from the chart below, inflation is historically low from its peak during the COVID period. The annual inflation rate for the United States was 2.4% for the 12 months ending March, compared to the previous rate increase of 2.8%, according to US Labor Department data published on April 10, 2025.

The consensus of the investment community is that 2025 will see lower growth and higher inflation. According to Joe Davis, the Global Chief Economist and Head of Investment Strategy Group, “the potential for further tariff announcements, the average effective US tariff rate could rise above 25%, well above the baseline we had anticipated at the start of the year. The global marketplace was far less integrated the last time tariffs were that high, more than a century ago. Although we don’t expect the rate to remain at that level given the prospect of negotiations, one that settles just below 20% (our baseline) still augurs significant economic ramifications. The effective US rate before the latest tariffs was below 5%.”
He continues, “Under our revised baseline scenario, 2025 US GDP growth would fall below 1%, nearly a percentage point below our previous forecast. That would put the economy at a potential “stall speed” that raises the specter of recession. We also foresee core inflation ending 2025 at nearly 4% year-over-year, more than a percentage point above our previous forecast. Unemployment that we foresee rising to just above 5% by year-end would be the highest in a decade outside the COVID-19 era.”
Davi concludes, “The combination of stagnating activity and rising prices introduces the prospect of stagflation that would be a strong headwind for both stocks and bonds. Given their dual mandate, the Federal Reserve may be challenged to lower rates meaningfully amidst a push and pull of lower growth and higher inflation. In the end, the Federal Reserve is likely to lower rates in the event of the labor market weakening further. Outside the US, we anticipate weakening economic growth, although softening demand will likely temper any inflationary impulses.”
Present Situation and its Impact to Direct Selling
ike all business industries and channels, direct selling faces some significant headwinds. Approximately 70 percent of the US GDP is tied to consumer spending. As discretionary spending decreases, direct sellers will find additional challenges to acquire and retain customers.
In April, US Consumer spending rose as everyday Americans rushed to make purchases before President Donald Trump’s full tariff plan took effect, data released from JPMorgan shows. Spending through the first 15 days in April climbed about 3.8% from the same period a year ago. Spending in March increased about 2.7% from the comparable month a year ago.
The pickup in spending shouldn’t be construed as heralding faster economic growth, however. “April data may reflect a pull forward of discretionary spending on big-ticket items if consumers tried to lock in lower prices before tariffs went into effect,” JPMorgan analysts led by Richard Shane wrote to clients. Much of the April gain came from discretionary spending, which rose by 4.3% in the first 15 days year-over-year, versus 2.9% growth in non-discretionary spending.
Consumers’ assessments of current business conditions were significantly less positive in March.
- 17.7% of consumers said business conditions were “good,” down from 19.1% in February.
- 16.6% said business conditions were “bad,” up from 14.8%.
Consumers’ views of the labor market improved slightly in March.
- 33.6% of consumers said jobs were “plentiful,” unchanged from February.
- 15.7% of consumers said jobs were “hard to get,” down from 16.0%.
The Direct Selling Association did a recent Quick Pulse survey focused on tariffs. Based on the survey, direct sellers are already experiencing the impact from the Trump tariffs.
Is your company experiencing the effects of inflation in the U.S.?

- Yes—largely in line with the consumer price index (2-3%), which is much more modest compared to the inflationary period of 2021-2022.
- Cost of ingredients and shipping increases.
- Cost of shipping and products.
- Remains the same with disposable income being limited impacting sales.
- Lower overall sales.
- It is less but we are still seeing a decline in demand due to higher prices.
- Higher prices, lower margins.
- Continuing to see impacts to overall sales because of tightening budgets.
- Higher costs.
Is your company experiencing the effects of inflation globally?
- Yes—as a global manufacturer, we feel the impact of inflation both locally and through increased input costs when shipping products internationally. On average, inflation has been higher across our markets in Asia.
- The primary areas where we experience inflation are labor and raw material costs related to product manufacturing.
- Shipping.
- Cost of shipping and products.
- Remains the same with disposable income being limited impacting sales lower overall sales needing to raise prices.
- It is less but we are still seeing a decline in demand due to higher prices.
- Continuing to see impacts to overall sales as a result of tightening budgets.
- Higher costs.
Are you impacted by the new tariffs?

- Yes, we are directly and indirectly impacted by the new tariffs. We are a net-exporter out of the US, so the import tariffs into the U.S. are not as significant. Greater exposure exists in foreign governments implementing reciprocal or retaliatory tariffs in response. Manufacturing capabilities exist in China as well (largely for selling product in China), which doesn’t eliminate, but helps mitigate exposure. Indirect exposure exists in the form of various suppliers sourcing product from tariffed countries.
- Our goods will increase in terms of cost, we are in the planning stages of how to overcome any increases in price to consumers. We are also limiting our orders from vendors until we know officially what the final results will be.
- Looking at switching product vendors for seasonal offerings based on high tariffs.
- Many of our product are imported so we will likley see a rise in cost of goods.
- Certain products are made in China and the USA and will now have tariffs added when selling USA products in EU or importing China products to the US.
Is your company taking actions regarding the tariffs?
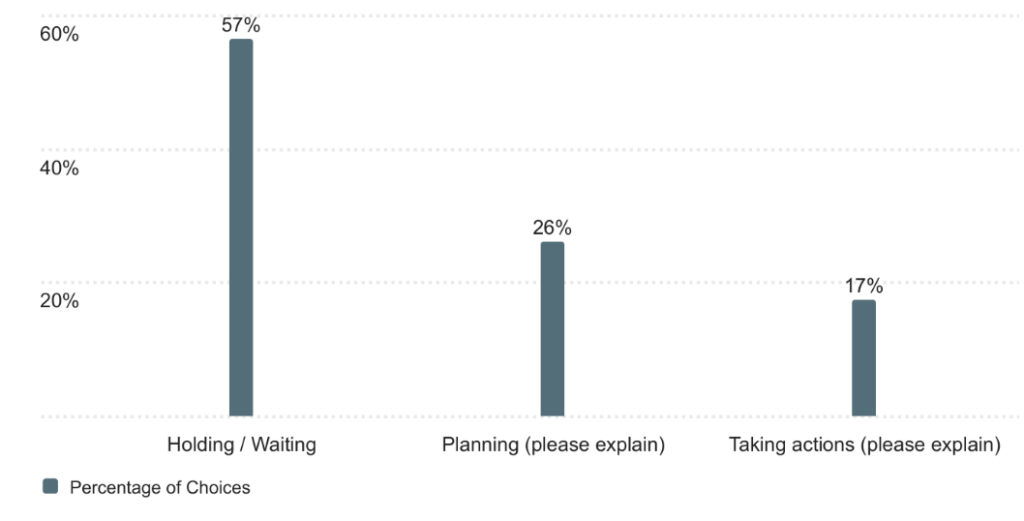
- Planning for higher costs of goods in each market.
- We are evaluating the cost implications from the tariffs to determine future product offerings/pricing.
- We have traced our supply chains to see what raw materials might be impacted, as well as investigated the impacts of distributing from the US to other countries. Now we wait…
- Scenario planning to not have impact on costs.
- A global taskforce is being established with cross-functional representatives. Given the recent pause in US tariffs, we are largely operating under a wait-and-see approach with many scenarios being modeled simultaneously. The exception to this is our North America affiliate, which is feeling the Canada retaliatory tariffs more acutely. Since those remain in place, a surcharge is being passed onto the end consumer to account for this cost. We consider the situation, and our response, as being very fluid.
- Limiting orders from vendors until the official results are in.
- Looking at switching product vendors for seasonal offerings based on high tariffs.
- To mitigate the impact of the recent tariff increases, we have tripled our imports of the finished product from Mexico, securing enough supply for the next 4 to 5 months. Similarly, we have taken the same approach with the import of raw materials from the US to Mexico to ensure continuity in production.
Has your company experienced a change in distributor retention as we moved through Q4 2024 and into Q1 2025?

- Due to our annual renewal cycle (December through January), we always see lowest retention numbers after renewal. We then gain them throughout the year. Compared to the prior year, we saw lower than retention rates from Q4 2024 through Q1 2025.
- Decline.
- We are seeing lower retention in at all levels in NA.
- Lower retention.
- In Oct 2024, we launched a new product and saw a surge in recruiting, followed by a month with larger than normal attrition. In Q1, retention normalized, and we are back to normal retention numbers.
- Stronger Distributor retention.
Has your company experienced a change in recruiting as we moved through Q4 2024 and into Q1 2025?

- We saw a marginal decline in applications as we moved through Q4 2024 and into Q1 2025: -1.2%.
- Decline.
- We are seeing lower recruiting for both US and CA. 6% decrease.
- Increase of 31.84%, this was impacted by recruiting promotion.
- Lower number of recruits.
- Recruiting in Q4 was very high, due to a new product launch. Q1 has dropped back down but are still higher than Q3 2024. -6%.
- We ran a promotion in Q4. The change is reflective of the lack of promotion in Q1. Q1 recruiting is in line with Q3 of the prior year.
- Higher levels of recruiting. Difficult to give a percent change moved through Q4 2024 and into Q1 2025.

Has your company experienced global supply chain issues as we moved through Q4 2024 and into Q1 2025?

- Tariffs has caused us to rethink product strategies.
- Only threats of the tariffs.
Please select the supply chain issue’s you’re experiencing:
- Product/component/raw material production delays outside the US. (49%)
- Product/component/raw material production delays in the US. (29%)
- Warehousing, manufacturing or other supply chain staffing challenges in the US. (14%)
- Higher production or shipping costs. (14%)
In the U.S., what is your company’s biggest ongoing strategic challenge in order fulfillment?
- Offsetting cost increases in home delivery (labor/fuel/supplies) and lower sales to maintain/reduce total distribution expenses as a percentage of sales.
- Associate retention.
- Higher Shipping Costs and shipping times.
- Increasing costs.
- Shifting production of goods from China to other (lower tariff) countries.
- It is increasingly difficult to bring in new distributors. There are so many gig opportunities to compete with now.
- Determining demand for new items.
- Cost.
- Cost of shipping goods to the customer.
- Positive sales growth.
Looking Forward
The direct selling channel has some significant headwinds in the near future due to a lot of uncertainty in the global marketplace. We are seeing more companies moving away from a sole dependency for distributors to drive revenue through an omnichannel strategy. At the same time, we are seeing companies committed to the MLM business model showing growth.
The Direct Selling Capital Advisors Index (DSCI) is a market capitalization weighted index of all domestic public direct selling companies with a market capitalization of at least $25 million. The index is rebalanced monthly, and no single issue is permitted to represent more than 20% of its total value. In such an event, the excess weighting would be redistributed among the other index components.
Large Cap
Note: For the purposes of this report, Direct Selling Capital considers companies with a market capitalization in excess of $1 billion “Large Cap.”
Betterware de Mexico (NASDAQ: BWMX) Founded in 1995, Betterware de Mexico is the leading direct-to-consumer company in Mexico focused on offering innovative products that solve specific needs related to household organization, practicality, space-saving and hygiene. Through the acquisition of JAFRA on April 7, 2022, the Company now offers a leading brand of direct-to-consumer in the Beauty market in Mexico and the United States where it offers Fragrances, Color & Cosmetics, Skincare and Toiletries. The combined company possesses an asset-light business model with low capital expenditure requirements and a track record of strong profitability, double digit rates of revenue growth and free cash flow generation. Today, the Company distributes its products in Mexico and in the United States of America.
Their stock price declined by 12.9% in April, bringing its YTD decline to -11.4%. Since the March 1, 2020 inception of the DSCI, BWMX has appreciated 5.1%. Additional financial data is at the end of this report.
The first quarter results, the President and CEO of BeFra Group, Andrés Campos Chevallier, noted the following:
“Reflecting on the first quarter of 2025, I want to provide a comprehensive overview of our performance amid an increasingly complex macroeconomic environment, the short-term challenges that we are currently navigating, and the progress that we continued making toward our long-term goals.”
He continued, “During the first quarter, we faced revenue pressure across our business, particularly in Mexico. The broader economic environment—characterized by deteriorating consumption trends, lower consumer confidence and reduced household discretionary spending—resulted in a decline in volumes sold and ultimately weighed on our revenues, which ended the quarter with a 2.9% decrease versus last year. These economic factors impacted Betterware Mexico’s revenue, which decreased 9.8%, while Jafra Mexico posted a 1.1% increase. The macroeconomic landscape in Mexico not only reduced demand for our products but also led to a reduction in our Associate and Distributor base, alongside lower activity levels across both brands. Profitability was also impacted by a prevailing environment of uncertainty, particularly because the depreciation of the Mexican peso led to higher costs of imported products and some raw materials. This cost pressure affected our profitability in two ways primarily—an immediate impact on gross margin and, to protect profitability, the implementation of price increases for certain SKUs. The price adjustments, while necessary, created additional pressure on customer demand.”
Additionally, “Despite the current macroeconomic challenges, our agile business model and financial strength provide resiliency, as BeFra has consistently demonstrated during adverse economic cycles in the past. We believe that BeFra’s flexible and low fixed-cost structure, financial discipline, a now diversified business portfolio as well as steps we have taken to more actively engage our salesforce, will continue giving us the agility needed to respond to the rapidly changing conditions in our markets today. While we are acting with caution in the short term, we remain fully committed to our long-term vision and growth strategy, continuing to advance on key strategic initiatives that position us for stronger performance when the macroeconomic landscape stabilizes and improves. Our international expansion remains a priority, and we are confident in the potential of our core business in Mexico as well as our entry into new markets in Latin America and the United States. Jafra US had a slow start to the year, especially in January and February, amid cautious consumer sentiment—particularly within the Hispanic community. However, we saw a meaningful recovery in March. With the Shopify+ platform now fully implemented and other operational improvements in place, we are seeing the first signs of this business’s recovery. Although we remain cautiously optimistic, due to current macro uncertainty, we believe it has strong mid to long-term potential, given the size and growth of the US beauty market.”
He concluded, “The expansion of Betterware in Latin America is progressing well, with Guatemala showing encouraging signs of growth, and Ecuador on track to launch in May of this year. Betterware US is currently facing uncertainty due to recent policies introduced by the country’s new administration. Accordingly, we have decided to pause operations for the time being. Across our businesses, we are executing with operational discipline, preserving financial flexibility and focusing our resources on areas with the highest strategic potential. BeFra’s brands remain strong, our sales model is effective—particularly in challenging operating environments such as the current one—and we believe that our Company is well-positioned to capture renewed growth when economic and market conditions improve. We will continue to operate with caution in the near term—remaining vigilant and agile—while steadfastly advancing toward our long-term goals.”
Q1 2025 Select Consolidated Financial Information

- Net revenue decreased 2.9% year-over-year, primarily driven by a decline in sales from Betterware Mexico and slower-than-expected, yet still positive, growth at Jafra Mexico. Sales for both brands were tempered by weak consumer spending amid widespread macroeconomic uncertainty. A corresponding decrease in sales volume was also due to a reduced Distributor and Associate base at both brands in Mexico during the quarter, a decrease that was a result of the macroeconomic environment.
- Gross margin declined 353 basis points compared to the prior year, mainly due to margin pressure in Betterware Mexico and Jafra Mexico that resulted from higher supply and raw material costs related to the depreciation of the Mexican Peso, which fell an average of 20.3% year-over-year (YoY) versus the US dollar from $16.98 to $20.42 in the quarter.
- EBITDA decreased 29.1% YoY, primarily at the Betterware and Jafra Mexico business units, reflecting lower sales and compressed margins. Of the 567 bps EBITDA margin contraction, ~350 bps came from the reduction in gross margin explained above; ~150 bps was due to lower sales; and ~60 bps came from an increase in administrative expenses related to one-time expenses at Betterware and Jafra Mexico. As with revenue, given the ongoing economic uncertainty and persistent weakness in consumption levels, the Company remains cautious about its revenue and EBITDA performance for the remainder of the year.
- Negative Free Cash Flow (FCF) for the quarter was primarily due to extraordinary cash outflows. Historically, BeFra has converted ~60% of EBITDA to FCF, and ~40% in the first quarter due to seasonality. Based on this trend, the Company would have generated ~$215M of FCF. However, during the quarter there were extraordinary uses of cash, mainly by Jafra Mexico, resulting from increases in working capital. The increase in working capital was primarily driven by higher inventory levels related to product investments of ~$190M under rebranding and innovation strategies, although these levels are expected to decrease during the remainder of the year. FCF was also impacted by a ~$90M tax payment related to the difference between total taxes incurred versus provisional tax payments by Jafra, which did not occur in Q1 2024.
- Net Income decreased 48.7% in Q1 versus last year’s quarter, reflecting the combined impact of lower sales and the decrease in EBITDA explained above. In addition, financial costs had a positive ~$26M impact on net income, due to a decrease in net interest expenses that resulted from lower interest rates, as well as a positive ~$21M in net currency effects related to the implementation of hedge accounting. Also impacting net income was higher taxes paid, which had a negative effect of ~$33M in the quarter.
Betterware de México, S.A.P.I., announced that after the shareholders meeting held on April 30, 2025, the payment of an aggregate dividend of MX $200,000,000 has been approved. This amount represents approximately US $0.2736 per share before applicable tax withholdings, or approximately US $0.2463 per share after applicable tax withholdings. The dividend is payable on May 23, 2025 to shareholders of record as of May 12, 2025.
Nu Skin Enterprises, Inc. (NYSE: NUS)
Nu Skin Enterprises, Inc., together with its subsidiaries, engages in the development and distribution of various beauty and wellness products worldwide. It offers skincare devices, cosmetics and other personal care products, including ageLOC LumiSpa and ageLOC LumiSpa iO; and nutricentials skincare products. The company also provides wellness products, such as LifePak nutritional supplements, ageLOC TR90 weight management system, and Beauty Focus Collagen+. In addition, it is involved in the research and product development of skincare products and nutritional supplements. The company sells its products under the Nu Skin, Pharmanex and ageLOC brands through retail stores, website, digital platforms and independent direct sellers and marketers as well as a service center. Nu Skin Enterprises, Inc. was founded in 1984 and is headquartered in Provo, Utah.
In April, the stock declined 16.5% and has declined 12.0% for the first four months of 2025. Since the direct selling index was established in March 2020, their stock has declined 74.3%. The stock’s 52-week high is $14 and the low was $5.32. Analysts predict a growth estimate of 23.25% for 2025. Additional financial data is at the end of this report.
First quarter 2025 are summarized below including notes from their analyst call on May 8th.
- Revenue: US$364.5m (down 13% from 1Q 2024).
- Net income: US$107.5m (up from US$533.0k loss in 1Q 2024).
- Profit margin: 30% (up from net loss in 1Q 2024).
- EPS: US$2.16 (up from US$0.011 loss in 1Q 2024).
Positive Points
- Nu Skin Enterprises Inc (NYSE:NUS) achieved first-quarter revenue at the high end of their guidance range, driven by improving business trends in certain markets.
- The company experienced significant growth in Latin America, with a 144% year-on-year increase, as their developing market strategy takes hold.
- Nu Skin Enterprises Inc (NYSE:NUS) surpassed their earnings expectations for adjusted earnings per share by effectively controlling expenses globally.
- The company is accelerating innovation with the introduction of PRISM IO, an intelligent wellness platform, leveraging advancements in AI and machine learning.
- Nu Skin Enterprises Inc (NYSE:NUS) reduced their outstanding debt by $155 million, achieving their lowest debt level in over 10 years, and maintained a strong cash position of $204 million.
Negative Points
- The company continues to face macroeconomic pressures, with consumers remaining cautious in their purchasing behaviors for premium beauty and wellness products.
- Nu Skin Enterprises Inc (NYSE:NUS) experienced lower sales performance in the US, China and Southeast Asia Pacific markets due to global trade tensions and other macroeconomic pressures.
- The company’s gross margin decreased to 67.8% from 70.5% in the prior year, primarily due to the revenue mix between rise entities and the core business.
- Selling expenses as a percentage of revenue were 32.5%, reflecting a decline in sales performance in key markets.
- Nu Skin Enterprises Inc (NYSE:NUS) anticipates continued foreign currency headwinds, impacting their revenue projections for the second quarter.
The highlights from the investor call are below in a question/answer format:
Can you provide more details on the revenue performance for Q1 2025?
Ryan Nairsky, President and CEO, stated that Nu Skin achieved first-quarter revenue at the high end of their guidance range, totaling $364.5 million. This was partly due to improving business trends in certain markets, despite a 3% negative foreign currency impact. The company also exceeded earnings expectations for adjusted earnings per share by effectively controlling expenses globally.
What are the key strategic priorities for Nu Skin in 2025?
Nairsky outlined three strategic priorities: strengthening the core Nu Skin business; accelerating innovation with the introduction of the PRISM IO intelligent wellness platform; and improving operational performance and efficiency. These priorities aim to move the company closer to its long-term vision of a beauty, wellness and lifestyle ecosystem.
How is Nu Skin planning to expand into new markets, particularly India?
Nairsky mentioned that Nu Skin plans to enter the Indian market with a pre-launch for qualified brand representatives in Q4 2025, followed by a formal market launch in mid-2026. The company will introduce locally manufactured beauty and wellness products tailored to Indian consumer needs and a localized sales compensation plan.
What is the PRISM IO platform, and how does it fit into Nu Skin’s strategy?
Nairsky explained that PRISM IO is an intelligent wellness platform that leverages machine learning and AI to provide consumers with insights into their antioxidant levels and health. It aims to enhance customer relationships and product recommendations, ultimately driving revenue and retention. The platform will be rolled out in limited quantities in Q3 and Q4 2025.
How is Nu Skin addressing macroeconomic pressures and geopolitical uncertainties?
James Thomas, CFO, stated that Nu Skin is implementing proactive supply chain strategies, such as diversified sourcing and optimized inventory planning, to mitigate risks. The company is closely monitoring potential impacts of tariffs and geopolitical dynamics on consumer sentiment and demand for its products.
Herbalife Nutrition, Inc. (NYSE: HLF)
Herbalife Ltd., together with its subsidiaries, provides health and wellness products in North America, Mexico, South and Central America, Europe, the Middle East, Africa, China and the Asia Pacific. The company offers products in the areas of weight management; targeted nutrition; energy, sports and fitness; outer nutrition; and literature, promotional and other items. It also provides weight management products, including meal replacement products, protein shakes, drink mixes, weight loss supplements, healthy snacks and metabolism boosting teas; targeted nutrition products, which comprise functional beverages, and dietary and nutritional supplements that contain herbs, vitamins, minerals and other natural ingredients; outer nutrition products, such as facial skin, body and haircare products; and energy, sports and fitness products, including N-R-G tea and energy drink products. In addition, it offers literature, promotional and other materials that comprise start-up kits, sales tools and educational materials. The company sells its products through sales representatives, independent service providers and company-operated retail stores and platforms. The company was formerly known as Herbalife Nutrition Ltd. and changed its name to Herbalife Ltd. in April 2023. Herbalife Ltd. was founded in 1980 and is headquartered in Los Angeles, California.
For the month of April, their stock declined by 18.1%. Year-to-date, their stock has increased by 5.7%, the only large cap stock that has had a positive return for the first four months of 2025. Conversely, HLF is down 78.2% since the establishment of the DSCI on March 1, 2020.
Below is key information from their first quarter of 2025 as noted in a DSN article on May 2nd.
Herbalife Ltd. announced its financial results for the first quarter of 2025. Net sales during the quarter reached $1.2 billion, a 3.4% year-over-year decrease, with a net income of $50.4 million. Adjusted EBITDA exceeded guidance at $164.9 million with an adjusted diluted EPS of $0.59.
Gross profit margin in the quarter improved slightly to 78.3%. Net cash provided by operating activities fared better than expected and reached $0.2 million. The company cited the first quarter as one that tends to be “the lowest cash flower quarter of the year” because of distributor and employee performance bonuses. Even so, this is the fourth consecutive quarter of year-over-year growth for new distributor numbers worldwide, which the company believes signals strong global engagement and positive momentum.
“Our first quarter results were strong, and we raised our full-year 2025 Adjusted EBITDA expectations,” said Stephan Gratziani, Herbalife President and incoming CEO. “Our recent acquisitions strengthen our position and support our commitment to transformative growth.
The company’s recent asset acquisition of Pro2col LLC and Prüvit as well as gaining a 51% ownership interest in Texas-based manufacturing company HBL Link Bioscience LLC, required an investment of $25.5 million, but is expected to create unique opportunities to expand customer reach through a personalized health, wellness and nutrition platform. Blake Mallen, previously Prüvit President, will now serve as Herbalife Chief Strategy Officer and Pro2col President.
“As I transition into the role of CEO, I am committed to honoring Herbalife’s 45-year legacy of empowering our communities through health, wellness and a strong entrepreneurial opportunity,” Gratziani said. “Our recent acquisitions are a bold step to provide innovation and growth as we move toward our vision of becoming the world’s premier health and wellness company, community and platform.”
Medifast, Inc. (NYSE: MED)
Medifast, Inc., through its subsidiaries, operates as a health and wellness company that provides habit-based and coach-guided lifestyle solutions to address obesity and support a healthy life in the United States. The company offers weight loss and weight management plans; and GLP-1 support plans that provide access to GLP-1 medications where clinically appropriate under the OPTAVIA brand name. It also provides bars, puffs, cereal, crunchers, drinks, hearty choices, oatmeal, pancakes, pudding, soft serve, shakes, smoothies, soft bakes and soups as well as provides coaching support along with community, nutrition, and healthy habits, and helps people in their weight loss journey. It markets its products through point-of-sale transactions, as well as through ecommerce platform. Medifast, Inc. was founded in 1980 and is headquartered in Baltimore, Maryland.
In April, shares declined 7.3% compared to March 2025. For the first four months of 2025, their stock price declined by 29.1%. MED is the worst performing DSCI large cap member on a long-term basis; since the March 1, 2020 establishment of the DSCI, the stock has declined 84.3%.
Wellness company Medifast (NYSE:MED) missed Wall Street’s revenue expectations in Q1 CY2025, with sales falling 33.8% year-on-year to $115.7 million. Next quarter’s revenue guidance of $95 million underwhelmed, coming in 15.4% below analysts’ estimates. Its GAAP loss of $0.07 per share was 72% above analysts’ consensus estimates.
Below is more information on their first quarter of 2025.
- Revenue: $115.7 million vs. analyst estimates of $116.4 million (33.8% year-on-year decline, 0.6% miss).
- EPS (GAAP): -$0.07 vs. analyst estimates of -$0.25 (72% beat).
- Revenue Guidance for Q2 CY2025 is $95 million at the midpoint, below analyst estimates of $112.3 million.
- EPS (GAAP) guidance for Q2 CY2025 is -$0.28 at the midpoint, missing analyst estimates by 293%.
- Operating Margin: -1.1%, down from 5.3% in the same quarter last year.
- Market Capitalization: $131.5 million.
Sales Growth
Reviewing a company’s long-term sales performance reveals insights into its quality. Any business can put up a good quarter or two, but many enduring ones grow for years.
With $543.5 million in revenue over the past 12 months, Medifast is a small consumer staples company, which sometimes brings disadvantages compared to larger competitors benefiting from economies of scale and negotiating leverage with retailers.
As you can see below, Medifast’s demand was weak over the last three years. Its sales fell by 30.3% annually, a tough starting point for our analysis.

Medifast missed Wall Street’s estimates and reported a rather uninspiring 33.8% year-on-year revenue decline, generating $115.7 million of revenue. Company management is currently guiding for a 43.6% year-on-year decline in sales next quarter.
Looking further ahead, sell-side analysts expect revenue to decline by 27.8% over the next 12 months. While this projection is better than its three-year trend, it’s tough to feel optimistic about a company facing demand difficulties.
Dan R. Chard, the CEO of Medifast noted the following,
“There’s no question that we are operating in a time of tremendous opportunity. The health and wellness space, particularly around weight loss and weight management, is evolving rapidly, and we believe Medifast is well positioned to take advantage. Scientific research has shown that use of GLP-1 medications can result in up to 40% of weight loss coming from muscle mass, equivalent to a decade’s worth of muscle loss within just 12 months to 18 months.
Furthermore, for 88% of patients, GLP-1 medications do not fully support their achieving a healthy weight. We believe these findings reinforce the importance of supporting any health journey with a straightforward health and wellness lifestyle solution to achieve long-term health goals. This is relevant for those using weight-loss medications, as well as for those pursuing weight loss and improved health without the use of medications.”
In either case, Medifast’s OPTAVIA program helps preserve lean muscle and delivers healthier outcomes through healthy habits, nutrition and coaching for those seeking lasting health outcomes. At the same time, independent research that we have commissioned indicated that 83% of people looking to lose weight lack confidence in transitioning to a long-term healthy lifestyle. This is precisely the strength of our OPTAVIA program, which offers a holistic approach to weight loss and healthier living.
Our offering combines science-backed products, personalized nutrition plans, the support of a dedicated OPTAVIA coach and integration into a like-minded community. Additionally, where appropriate, we provide access to weight loss medications through our collaboration with LifeMD. This integrated solution gives people the tools, accountability and encouragement they need to learn how to make a healthy lifestyle second nature, lose weight, keep it off and simplify a complex health journey.
Coaches play a vital role in helping people navigate both the active weight loss phase and the weight management phase that follows. These coaches, having faced similar challenges themselves, bring in valuable experience to the process.
Studies indicate that most people using GLP-1 medications for weight loss struggle with long-term weight maintenance. An average of 2/3 of weight loss by people using medications is regained within a year of stopping them. And with up to 74% of people discontinuing GLP-1 medications within the first 12 months, it is clear that there is a demonstrated need for guidance in achieving health and wellness.
This is exactly why our approach is so relevant. It not only helps people lose weight, but also instructs them in healthy habits that can be utilized to help preserve muscle mass, manage weight loss and improve health and wellness.
With more than 40 years of experience supporting people with their health and wellness goals, including many years when we were selling through multiple channels, we continue to believe that our coaches represent a core competitive advantage. They are our most effective customer acquisition engine and the most efficient way to scale our business.
In 2025, we are sharpening our focus on reigniting that engine. We’re taking action to help simplify the coaching experience, increase productivity and create scalable and successful businesses through stronger new customer acquisition, better retention and the re-engagement of former customers.
There are three key elements to this initiative. First, we are streamlining the coach development path, making it easier for coaches to succeed in the changed competitive environment. We envision that a more clearly defined path will show them how to achieve early wins and develop their business by placing more emphasis on building coach leadership skills.
We anticipate that with more intuitive incentives and clearer guidance on how to grow their businesses, coaches will be better empowered to optimize their efforts and achieve financial success. Through leadership education, podcasts, networking events and shared best practices, we are working to create an environment where coaches can thrive and where their success becomes repeatable and scalable.
Second, we are enhancing the tools and insights available to the coaches. Upgrading digital business tools are expected to provide a more seamless way for coaches to track customers’ progress. And they can use that data tailor solutions that best meet individual customer needs.
Education resources will focus on how to deliver more personalized customer service, equipping coaches with the skills and strategies to build stronger relationships and more sustainable businesses. This is especially important in their ability and confidence in supporting customers who are currently using or have used a GLP-1 medication.
Currently, almost half of OPTAVIA coaches have supported GLP-1 medication patients, the highest level we’ve seen to date, with 25% of coaches having had personal experience using GLP-1 medications themselves as part of their own weight loss and health journey.
Third, we are continuing to broaden our product offerings to give coaches more tools to serve their customers. Over the past 18 months, we’ve launched OPTAVIA ACTIVE for those individuals who want to incorporate exercise into their plans, as well as the OPTAVIA ASCEND line, which is designed specifically for those using GLP-1 medications for transitioning into a weight management phase after achieving their healthy weight.
With its high protein content, the ASCEND line helps customers preserve lean muscle mass, a core concern for GLP-1 users and all people trying to lose weight and learning how to keep it off. With a more diverse set of offerings, our coaches have the flexibility to create highly tailored plans that meet customers wherever they are in their health and wellness journey.
Science remains at the core of our program and products. With recent development breakthroughs, our programs and products should be even more effective in delivering key benefits to support customer health and wellness journey. These development breakthroughs will first impact our OPTAVIA Essential line and will play an important role in the business transformation as we continue to implement changes over the next 12 months to 18 months.
Additionally, we are currently developing studies that will evaluate the efficacy of the new ASCEND line in the more established Essential line, along with the holistic OPTAVIA model, which pairs customers with a coach and teaches customers how to make a healthy lifestyle second nature, giving coaches even more points to demonstrate why OPTAVIA offers a unique and effective solution. We expect investment in these areas to be mitigated by reductions in company-led marketing costs. While those efforts helped re-engage past customers, they prove less efficient at attracting new ones.
This year, we’re putting the emphasis squarely back on our coach community, which remains central to the strength of our brand and the success of our program. The impact of coach support was measured in our clinical research and showed that customers who receive coaching support while using the OPTAVIA plan lost 10 times more weight, 17 times more fat for the self-directed group.
Turning to our first quarter results. Revenues and EPS were in guidance range, with bright spots continuing to appear in parts of the business. For the fourth consecutive quarter, we saw lower year-over-year coach productivity declines, driven in part by increased productivity of newer coach cohorts. These new cohorts are exhibiting new customer growth ahead of last year and are at levels we experienced back when the business was growing.”
Below is additional information provided in their investment call.
Can you explain the reasoning behind the second quarter top line guidance, which seems to imply an acceleration in the year-over-year rate of decline?
Jim Maloney, CFO, explained that the guidance reflects the timing of promotions. A successful promotion in Q1 led to a year-over-year improvement in new coaches, which impacted Q2 projections. The company does not plan similar promotions in Q2, affecting the guidance. However, this does not imply a continued trend of acceleration in decline for future quarters.
How has the introduction of GLP-1 medications impacted the coaching community?
Nicholas Johnson, Chief Field Operations Officer, noted that GLP-1 medications have required retraining for coaches to adapt to the new environment. While initially disruptive, new coaches who have only known the GLP-1 environment are performing well. The focus is on lifestyle transformation, and many coaches have experience with GLP-1, either personally or through clients.
What is the current status of the ASCEND product line, and how has it progressed?
Maloney stated that the ASCEND line continues to perform in line with expectations, with orders in the mid-teen percentage of total orders by the end of Q1. This aligns with the company’s projections for the product line.
How will the shift from company-led marketing to investing in coaches impact SG&A expenses?
Maloney explained that while there will be some reduction in company-led marketing, it was not a large percentage of revenue compared to coach compensation. The focus will be on reactivation efforts, which have proven effective, and the impact on SG&A will not be dramatic.
What are the costs associated with being on a GLP-1 medication and the supporting nutritional programs?
Dan Chard, CEO, mentioned that the majority of clients on GLP-1 drugs use the OPTAVIA 5 & 1 program, costing roughly $400 per month. This covers 80% of their daily meals. LifeMD offers telehealth services for less than $20 per month, with most clients using their own insurance for GLP-1 medications.
Q1 marked the first meaningful year-over-year increase in new coaches in the past three years, with a double-digit increase compared to the same period last year. While this hasn’t yet made a meaningful impact on revenue, we believe it sets the stage for future improvement in overall coach productivity and new customer acquisition and positions us for coach growth the back half of 2026 if the trend holds. In the meantime, our continued focus on driving cost savings is helping us maintain a strong balance sheet.
USANA Health Sciences, Inc. (NYSE: USNA)
USANA Health Sciences, Inc. develops, manufactures and sells science-based nutritional, personal care and skincare products in Asia Pacific, the Americas and Europe. It operates in two segments, direct selling and Hiya Direct-To-Consumer. The company offers USANA nutritional optimizers, including supplements for cardiovascular health, skeletal/structural health and digestive health; Essentials/CellSentials, such as vitamin and mineral supplements for age group beginning with children 13 months of age; and food products that include meal replacement shakes, snack bars and other related products for healthy weight management, digestive health and energy and hydration. It also provides Celavive, a skincare regimen for various skin types and ethnicities; and all other products comprising materials and online tools for associates to build business and marketing of products. The company sells its products through retail customers, a subscription model and direct selling, as well as online. The company has a research collaboration agreement with Beijing University of Chinese Medicine; and National Sports Training Bureau. USANA Health Sciences, Inc. was founded in 1992 and is headquartered in Salt Lake City, Utah.
In April, their stock value increased by 3.4% vs. March 2025. For the first four months of 2025, the stock declined by 22.3%. Since the creation of the DSCI on March 1, 2020, USANA shares have lost 57.8% compared with gains of 59.5% for the direct selling index and the DJIA, respectively.
Key Financial Results
- Revenue: US $249.5M (up 9.5% from 1Q 2024).
- Net income: US $9.40m (down 43% from 1Q 2024).
- Profit margin: 3.8% (down from 7.3% in 1Q 2024). The decrease in margin was driven by higher expenses.
- EPS: US $0.49 (down from US$0.86 in 1Q 2024).
- Revenue exceeded analyst estimates by 2.7%. Earnings per share (EPS) also surpassed analyst estimates by 14%.
- Looking ahead, revenue is forecast to grow 8.4% p.a. on average during the next 2 years, compared to a 3.6% growth forecast for the Personal Products industry in the US.
In April, DSN shared the following regarding Usana’s first quarter 2025.
USANA Health Sciences, Inc. announced the financial results for the first fiscal quarter of 2025. Net sales within the quarter represented a 10% year-over-year growth rate, totaling $250 million versus $228 million in the first quarter of 2024. Net earnings, however, showed a decline from $16.5 million in Q1 2024 to $9.4 million. Adjusted EBITDA was $30 million, down from $33 million in Q1 2024, and adjusted diluted EPS was $0.73, compared to $0.86 in the same period last year.
Total active customers in the quarter totaled 459,000, down from 494,000 in the first quarter of 2024. Hiya active monthly subscribers reached 224,000, which the company described as strong momentum that “should continue building as their team executes their plans to launch several new products this year, unveil another strategic partnership, and expand to additional channels.” The company remains confident in Hiya’s growth trajectory and its ability to reach a new customer demographic.”
“USANA is off to a solid start to the year as we continue to execute our growth strategy through our core direct sales business and our recently acquired direct-to-consumer business, Hiya,” said Jim Brown, USANA President and Chief Executive Officer. “We are seeing encouraging signs in our direct sales business with net sales and active customers growing modestly on a sequential basis for the second consecutive quarter. While the global macroeconomic environment has become less certain since the beginning of the year due to volatility in international trade, tariffs and consumer sentiment, the underlying demand for our products has remained strong. Operationally, our manufacturing facilities in the United States and mainland China uniquely position us to deliver the best possible shopping experience and value to our customers in every market around the world. Our supply chain team has actively managed our inventory levels and sourcing and will continue to work with our stakeholders in each of our markets to navigate the increasingly dynamic operating environment.”
The company generated $15 million in operating cash flow and ended the quarter with $180 million in cash and cash equivalents with $23 million in debt.
Looking ahead, revenue is forecast to grow 8.4% p.a. on average during the next 2 years, compared to a 3.6% growth forecast for the Personal Products industry in the US.
USANA projects 2025 revenue and adjusted diluted EPS of $920 million to $1.0 billion and $2.35-$3.00, respectively. The company’s 2024 revenue totaled $855 million, and its 2024 adjusted diluted EPS was $2.59. USANA’s 2025 revenue guidance includes $145-160 million from recently acquired Hiya Health Products, LLC, a leading direct-to-consumer provider of high-quality children’s health and wellness products. On December 23, 2024, USANA closed its acquisition of a 78.8% controlling ownership stake in Hiya. The $205 million cash transaction is expected to be immediately accretive to USANA’s 2025 adjusted EBITDA. As of September 30, 2024, Hiya had more than 200,000 customers. For the twelve months ended September 30, 2024, Hiya generated net sales of $103 million, net income of $19 million, and adjusted EBITDA of $22 million. Hiya’s revenue for 2024 was about $112.5 million.
eXp World Holdings, Inc. (NASDAQ: EXPI)
eXp World Holdings, Inc., together with its subsidiaries, provides cloud-based real estate brokerage services for residential homeowners and homebuyers. It operates through three segments: North American Realty, International Realty and Other Affiliated Services. The company acts as a licensed broker for processing residential and commercial real estate transactions; and provides other real estate support services. It also offers FrameVR.io, a web-accessible proprietary technology offering immersive 3D platforms; magazine and its related media properties which provide training, classes, resources and tools under the SUCCESS brand; SUCCESS Space, a coworking solution offering rental workspaces for individual and group use, access to professional development coaching, media production services, virtual-world communications technology and full-service cafes. It operates in North America, Canada, the United Kingdom, Australia, South Africa, India, Mexico, Portugal, France, Puerto Rico, Brazil, Italy, Hong Kong, Colombia, Spain, Israel, Panama, Germany, the Dominican Republic, Greece, New Zealand, Chile, Poland and Dubai. The company was formerly known as eXp Realty International Corporation and changed its name to eXp World Holdings, Inc. in May 2016. eXp World Holdings, Inc. was incorporated in 2008 and is headquartered in Bellingham, Washington.
The stock price declined 8.3% in April vs. March 2025. For the first four months of 2025, their stock prices has declined by 22.1%. More constructively, EXPI shares have appreciated an aggregate 87.7% over the five years the DSCI has been computed, the second-best long-term mark for any DSCI member. Below is the first quarter consolidated financial highlights as compared to the same time a year-ago period.
- Revenue increased 1% to $954.9 million.
- Net loss of $11 million and loss per diluted share of $.07.
- Adjusted EBITDA1 (a non-GAAP financial measure) of $2.2 million.
- As of March 31, 2025, cash and cash equivalents totaled $115.7 million, compared to $109.2 million as of March 31, 2024.
- Net cash provided by operating activities of $39.8 million.
- Adjusted operating cash flow (a non-GAAP financial measure) of $28.2 million.
- Distributed $12.6 million to shareholders, including $5.0 million of common stock repurchases and $7.6 million of cash dividends.
- Revenue: US $249.5M (up 9.5% from 1Q 2024).
- Net income: US $9.40m (down 43% from 1Q 2024).
- Profit margin: 3.8% (down from 7.3% in 1Q 2024). The decrease in margin was driven by higher expenses.
- EPS: US $0.49 (down from US $0.86 in 1Q 2024).
- Revenue exceeded analyst estimates by 2.7%. Earnings per share (EPS) also surpassed analyst estimates by 14%.
- Looking ahead, revenue is forecast to grow 8.4% p.a. on average during the next two years, compared to a 3.6% growth forecast for the Personal Products industry in the US.
The Company paid a cash dividend for the first quarter of 2025 of $0.05 per share of common stock on March 19, 2025. On May 5, 2025, the Company’s Board of Directors declared a cash dividend of $0.05 per share of common stock for the first quarter of 2025, expected to be paid on June 4, 2025 to stockholders of record on May 19, 2025.
Glenn Sanford, Founder, Chairman and CEO noted the following, “We’re entering 2025 from a position of strength. eXp has built one of the most comprehensive, tech-enabled agent value stacks in the industry – one that’s driving record international agent productivity and empowering entrepreneurs at scale. This quarter alone, we more than doubled our international revenue year-over-year and expanded our footprint into Perú and Türkiye, further proving that our agent-first model transcends borders. Agent success has always been the foundation of eXp’s strategy—and in 2025, we plan to double down with enhanced tech, smarter training and even more pathways to help agents close more deals, build generational wealth and create the freedom they deserve.”
“The real estate industry is at a pivotal crossroads, and eXp is proudly leading the charge to protect transparency, consumer choice and healthy competition—values that have defined our marketplace for decades,” said Leo Pareja, CEO of eXp Realty. “eXp was built by agents, for agents, and we continue to raise the bar. Recently, we launched the industry’s first open-sourced seller advisory form and were the first to partner with Zillow to support consumer transparency. With the rollout of our co-sponsor program, we’ve also unlocked new income pathways for agents. As we look forward, we’re not just defending our industry—we’re building the future of it, with our agents at the center.”
Primerica, Inc. (NYSE: PRI)
Primerica, Inc., together with its subsidiaries, provides financial products and services to middle-income households in the United States and Canada. The company operates in three segments: Term Life Insurance; Investment and Savings Products; Senior Health; and Corporate and Other Distributed Products. The Term Life Insurance segment underwrites individual term life insurance products. The Investment and Savings Products segment provides mutual funds and various retirement plans, managed investments, variable and fixed annuities and fixed indexed annuities; and offers segregated funds. The Corporate and Other Distributed Products segment provides mortgage loans; prepaid legal services that assist subscribers with legal matters, such as drafting wills, living wills and powers of attorney, trial defense, and motor vehicle-related matters; ID theft defense services; auto and homeowners’ insurance; home automation solutions; and insurance products, including supplemental and accidental death and disability insurance. It distributes and sells its products through licensed sales representatives. Primerica, Inc. was founded in 1927 and is headquartered in Duluth, Georgia.
In April, the stock price declined by 6.9% vs. March 2025 and has declined by 2.5% for the first four months of 2025. PRI has appreciated 141.7% since March 1, 2020, the best long-term performance for any DSCI member. The first quarter results posted on May 5, 2025, noted the following:
- Adjusted Net Operating Income: $168 million, up 14% year over year.
- Diluted Adjusted Operating EPS: Increased 20% to $5.02.
- Shareholder Returns: $153 million returned, including $118 million in share repurchases and $35 million in dividends.
- Recruitment: 100,867 individuals recruited, a 9% decline year-over-year.
- New Life Licenses: Declined 5% year over year.
- New Term Life Policies: 86,415 issued, representing $28 billion in new protection.
- Term Life Operating Revenue: $458 million, up 4% year-over-year.
- Term Life Pre-Tax Operating Income: $147 million, up 6% year-over-year.
- ISP Segment Sales: $3.6 billion, up 28% year-over-year.
- Net Inflows: $839 million, compared to $274 million in the prior year period.
- Client Asset Values: $110 billion, up 6% year-over-year.
- Investment and Savings Product Operating Revenue: $291 million, up 19% year-over-year.
- Investment and Savings Product Pre-tax Income: $81 million, up 24% year-over-year.
- Closed Loans in the US: $93.5 million, up 31%.
- Closed Loans in Canada: $43.3 million, up 78%.
- Consolidated Insurance and Other Operating Expenses: $163 million, up 4% year-over-year.
- Holding Company Cash and Invested Assets: $407 million.
- Primerica Life Estimated RPC Ratio: 470%.
Positive Points
- Adjusted net operating income increased by 14% year-over-year to $168 million, with diluted adjusted operating EPS up 20% to $5.02.
- The investment and savings product segment saw a 28% year-over-year increase in total sales, driven by strong demand across mutual funds, variable annuities and managed accounts.
- Primerica Inc (NYSE:PRI) returned $153 million to stockholders through share repurchases and dividends during the quarter.
- The company experienced strong sales growth in its mortgage business in both the US and Canada, with closed loans up 31% in the US and 78% in Canada.
- Persistency in term life policies remained stable, with $957 billion of protection in place for middle-income families at quarter-end.
Negative Points
- Recruiting declined by 9% year-over-year, with new life licenses down 5%, attributed to economic uncertainty and cost-of-living pressures.
- Term life insurance sales faced pressure, with productivity slightly below historical ranges at 0.19 policies per representative.
- The company experienced a 2% decline in client asset values during the first three months of 2025 due to negative market performance.
- Overall lapse rates remain above long-term expectations, reflecting ongoing financial impacts from higher cost-of-living pressures on middle-income families.
- Economic uncertainty is contributing to a slowdown in recruiting and investment sales momentum, with potential impacts on future growth.
The highlights from the Q&A on this call noted the following:
What is causing the difference in performance between term life sales and ISP sales?
Glenn Williams, CEO, explained that the complementary nature of Primerica’s business model allows for different reactions under the same circumstances. Term life sales are impacted by cost-of-living pressures, as families prioritize their spending. In contrast, ISP sales, particularly larger transactions like rollovers, are less affected by such pressures. The demand for variable annuities with guarantees has increased due to economic uncertainty, which has bolstered ISP sales.
How does the company view the recruiting environment given current economic conditions?
Williams noted that economic disruption can sometimes aid recruiting as people seek additional income opportunities. However, the current uncertainty is causing potential recruits to be more cautious. Despite this, Primerica remains optimistic that once clarity returns, recruiting will benefit as people seek to take control of their financial futures.
Are there any particular ISP products more impacted by current market conditions?
Williams stated that variable annuities and index-linked variable annuities are seeing increased demand due to their guarantees, which are attractive in uncertain times. Managed accounts are also growing rapidly, benefiting from being a newer product line with strong momentum.
What drove the increase in the RBC ratio this quarter?
Tracy Tan, CFO, explained that the increase in the RBC ratio to 470% was due to a combination of factors, including growth in the investment portfolio and a shift to slightly higher-yielding investments without increasing risk. The company maintains a strong capital position to support growth and withstand potential downturns.
How are lapse rates trending in the term life segment, and what is the outlook?
Tan reported that lapse rates remain higher than pre-pandemic levels but have stabilized recently. Persistency for new policies is in line with expectations, and overall trends are expected to normalize over time. The company has factored higher lapse rates into its guidance, and the term life business remains stable.
Oliveda International, Inc. (OTC: OLVI)
Founded in 2003, OLVI has more than 20 years of experience in: 1) the management and organic certification of mountain olive trees; 2) the extraction of international award-winning extra virgin olive oils; 3) the extraction of hydroxytyrosol, a substance which has several beneficial effects such as antioxidant, anti-inflammatory, anticancer and as a protector of skin and eyes; and 4) the production and distribution of cosmetic and holistic waterless products related to the olive tree.
Oliveda International, Inc. and its subsidiary, Olive Tree People Inc., as well as the European companies, Olive Tree People Europe AG and Oliveda Deutschland GmbH, as well as Olive Tree Farmers SL, were founded by the German real estate investor Thomas Lommel.
In addition to the registered beauty brands, Oliveda and LA Dope, as well as Re:connected to Nature, The Intuition of Nature, and Olive Mush, to name just a few brands, Lommel is the region’s largest conservationist and protector of over 30,000 100-year-old mountain olive trees, and, with his Thomas Lommel Foundation, he brings the water that he does not use into his waterless beauty products to the people of Africa by building water wells on site.
In addition to online sales and a Europe-wide branch network of thousands of retail stores, Oliveda Deutschland GmbH operates its own flagship stores in Berlin and Düsseldorf.
Comparing April 2025 to March 2025, the stock price declined by 2.3%. For the first four months of 2025, the stock declined by 53.5%, the worst performing large cap direct selling stock during the first four months of 2025. Over the first two months of 2025, OLVI has declined 53.5%.
Olive Tree People started in Venice Beach, in the garage of Oliveda and Olive Tree People founder and CEO Thomas Lommel in March 2023 with around 40 orders a day and then exploded to up to 10,000 orders a day within a few months.
Lommel shared, “Those were extremely challenging times because, despite moving from my garage to our first warehouse in Culver City, Los Angeles, we no longer knew what to do with the pallets and products that were arriving from Germany in ever-increasing quantities. No less challenging was flying these quantities of products from Germany to the US within a short period of time and increasing production by up to 3,000%. We’ve experienced days when we had thousands of backorder lists, and dozens of products were out of stock. When new products, like our order-friendly F59, were back in stock, they were sold out within seconds. Thanks to a fantastic team, we mastered these extremely challenging times with excellence and now have enough space in our current warehouse to multiply our two-year sales of over $100 million. This hypergrowth naturally also had an impact on the price of our OLVI shares. The company was temporarily valued at over $3 billion and has now settled at over $1 billion after just two years.”
When asked about future developments, Lommel stated, “It wasn’t my goal to achieve a valuation of over $1 billion, but rather to bring the magic of our trees to the world. I had no idea about waterless beauty and developed it intuitively in the treehouse, simply because it makes so much more sense. For me, trees cannot be measured in money, as we wouldn’t exist without them. The magic emanating from our mountain olive trees cannot be measured in dollars, as they enable us humans to become healed and whole every day. 2025 is another challenging year in which we will continue to grow and expand to Canada in the summer of 2025, and then reach Europe with our waterless movement in October 2025. The potential of waterless beauty is almost endless, as it triggers an ‘a-ha moment’ in the vast majority of people who come into contact with it, and our 365-day satisfaction guarantee lets people experience the difference without pressure.”
The Beachbody Company, Inc. (NYSE: BODI)
The Beachbody Company, Inc. operates as a fitness and nutrition company in the United States and internationally. The company operates Beachbody on Demand, a streaming service through subscription that provides fitness programs, including P90X, Insanity and 21 Day Fix brands; and offers nutrition programs, through subscription to Beachbody On Demand Interactive, such as Portion Fix and 2B Mindset brands. It also provides nutritional products, such as Shakeology, a nutrition shake; Beachbody Performance supplements comprising pre-workout energize, hydrate, post-workout recovery and protein supplement recharge products; BEACHBAR, a low-sugar snack bar; Belle Vitale, a hormone health solution for women to address symptoms of hormone imbalance; and connected fitness products. The Beachbody Company, Inc. was founded in 1998 and is headquartered in El Segundo, California.
Their stock price declined by 43.8% vs. March 2025. For the first four months of 2025, their stock price declined by 21.8%. BODI was the first public company to announce a movement away from a multi-tiered compensation model to a single-level affiliated model and clearly shows the impact of this type of change. Although private companies had made similar changes, the results mirror what BODI experienced after their first quarter of making this change. They report their first quarter results for 2025 on May 14, 2025, and we will cover that in May.
BODI announced that it received notice from the New York Stock Exchange (the “NYSE”) that it was not currently in compliance with the requirement of Section 802.01B of the New York Stock Exchange Listed Company Manual (the “NYSE Manual”) that the Company has an average market capitalization of not less than $50.0 million over a consecutive 30-trading-day period and stockholders’ equity of not less than $50.0 million (the “NYSE Notice”).
Pursuant to the NYSE Notice, the Company is subject to the procedures set forth in Sections 801 and 802 of the NYSE Manual and must submit a business plan within 45 days of receipt of the NYSE Notice that demonstrates how the Company expects to return to compliance with this continued listing standard within 18 months of receipt of the NYSE Notice.
The notice and procedures described above have no effect on the listing of the Company’s securities at this time, subject to the Company’s compliance with other continued listing requirements, and the Company intends to submit a plan to regain compliance as required by the rules of the NYSE and as set forth in the NYSE Notice.
Below are two charts that summarize the large cap direct selling companies.


Small Cap
Below are two charts on the small companies. Below is the April information for the two largest small cap companies, Nature’s Sunshine and LifeVantage.


Nature’s Sunshine Products, Inc. (NASDAQ: NATR)
Nature’s Sunshine Products, Inc., a natural health and wellness company, manufactures and sells nutritional and personal care products in Asia, Europe, North America, Latin America and other locations internationally. The company provides general health products related to blood sugar support, bone health, cellular health, cognitive function, joint health, mood, sexual health, sleep, sports and energy and vision; immune products; cardiovascular products; and digestive products. It also offers personal care products, including oils and lotions, aloe vera gel, herbal shampoo, herbal skin treatment, toothpaste and skin cleanser products, as well as weight management products. The company provides its products under the Nature’s Sunshine Products and Synergy WorldWide brands directly to customers and to a sales force of independent consultants. Nature’s Sunshine Products, Inc. was founded in 1972 and is headquartered in Lehi, Utah.
In April, their stock price declined by 4.6% vs. March 2025. For the first four months of 2025, the stock declined by 18.3%. Since the inception of the DSCI, NATR has gained 54.1%, On May 5, 2025, NATR reported on their first quarter 2025 and noted the following.
Positive Points
- Nature’s Sunshine Products Inc (NASDAQ:NATR) reported a strong start to 2025 with first-quarter revenue of $113 million, exceeding analyst expectations.
- The company achieved a 5% revenue increase on a constant currency basis, driven by strong performance in Asia Pacific and Europe.
- Adjusted EBITDA increased by 20% to $11 million, reflecting effective execution of strategies.
- Digital sales grew by 19%, more than double the supplement industry’s digital growth rate, indicating successful digital transformation efforts.
- The company achieved most of its sustainability goals, including reducing carbon emissions and cutting waste, showcasing its commitment to responsible business practices.
Negative Points
- Sales in North America declined by 4% due to a difficult comparison with the previous year and macroeconomic uncertainties impacting consumer sentiment.
- The company faces challenges from international trade tariffs and volatile consumer sentiment, which could impact future performance.
- Despite strong performance in Asia Pacific and Europe, the company anticipates challenges in maintaining growth rates due to tough comparisons in the latter half of the year.
- There is ongoing uncertainty regarding the impact of tariffs on raw materials and supply chain disruptions, which could affect future financial results.
- The company remains cautious in its 2025 outlook, reflecting potential macroeconomic instability and the impact of tariffs on consumer behavior.
On the investor call, the company shared some additional information that is worth noting in this report.
Q&A Highlights
How did the first quarter results compare to internal expectations, and what does this mean for the guidance for the rest of the year?
Shane Jones, CFO, stated that the first quarter results were slightly ahead of internal expectations. The guidance for the rest of the year remains conservative due to the uncertain macroeconomic environment. The midpoint of the guidance assumes continued macroeconomic instability and tariff issues, while the lower end assumes a recession-type environment. The upper end would reflect continued positive results similar to Q1.
Are there any changes in the outlook regarding tariffs since the initial guidance was issued?
Jones mentioned that the environment is rapidly changing, and while there have been no significant changes since the initial guidance, the company has been conservative in its estimates to encompass all potential scenarios. CEO Terrence Moorhead added that the company has taken steps to offset potential tariff impacts and is prepared to adapt to changes.
Is the new digital toolkit for North America still on track for launch in the second half of 2025, and how will it affect order disruption?
CEO Terrence Moorehead confirmed that the digital toolkit is on track for a launch in the second half of the year. It is expected to be an incremental opportunity without disrupting existing processes. The toolkit aims to enhance customer management and attract new customers.
What are the growth drivers in Europe and Asia, and do you see continued market opportunities there?
Moorehead highlighted strong fundamentals in sales and marketing as key drivers in both regions. The company sees ongoing market opportunities, although Asia Pacific will face challenging comparisons in the latter half of the year. Jones noted significant new customer growth in Japan as a positive indicator for future growth.
How is the company planning to improve the North American market, particularly with practitioners and retailers?
Moorehead explained that the company is focusing on building fundamentals, implementing new leadership, and providing better tools for practitioners and retailers. The introduction of a new toolkit in the latter half of the year is expected to enhance consumer engagement and marketing effectiveness.
Following the earnings report, Nature’s Sunshine Products’ two analysts are forecasting 2025 revenues to be US $459.2M, approximately in line with the last 12 months. Statutory earnings per share are predicted to shoot up 41% to US $0.78. Before this earnings report, the analysts had been forecasting revenues of US $460.0m and earnings per share (EPS) of US $0.77 in 2025. So, it’s pretty clear that, although the analysts have updated their estimates, there’s been no major change in expectations for the business following the latest results.
LifeVantage Corporation (NASDAQ: LFVN)
LifeVantage Corporation engages in the identification, research, development, formulation, and sale of advanced nutrigenomic activators, dietary supplements, nootropics, pre- and pro-biotics, weight management, and skin and hair care products. It offers Protandim, a dietary supplement; LifeVantage Omega+, a dietary supplement that combines DHA and EPA Omega-3 fatty acids, Omega-7 fatty acids, and vitamin D3; LifeVantage ProBio, a dietary supplement to support gut health; LifeVantage IC Bright, a supplement to support eye and brain health, reduce eye fatigue and strain, supports cognitive functions, and support normal sleep patterns; LifeVantage Daily Wellness, a dietary supplement designed to strengthen immune health; LifeVantage Rise AM & Reset PM System that provides the body with the right nutrients; LifeVantage D3+, a dietary supplement that provides vitamin D3, vitamin K2, magnesium, calcium, and other trace minerals to support a balanced immune system, strong bones, and cardiovascular health; PhysIQ Fat Burn to support weight management; PhysIQ Prebiotic is a dietary supplement designed to support the good bacteria in the gut and a healthy microbiome; Petandim for Dogs, a supplement to combat oxidative stress in dogs; and Axio, a nootropic energy drink mix. The company also provides anti-aging skincare products, including liquid collagen, facial cleansers, eye cream, moisturizing cream, sunscreen, perfecting lotions, hand creams as well as haircare products, such as invigorating shampoos, nourishing conditioners and scalp serums under the TrueScience brand name. It sells its products through its website and network of independent consultants in the United States, Mexico, Japan, Australia, Hong Kong, Canada, Thailand, the United Kingdom, the Netherlands, Germany, Taiwan, Austria, Spain, Ireland, Belgium, New Zealand, Singapore and the Philippines. The company also launch Evolve Compensation Plan and other LV360 initiatives into the Philippines, Taiwan, Hong Kong and Singapore. The company is based in Lehi, Utah.
Their stock declined in April by 15.3% vs. March 2025. For the first four months of 2025, the stock price has declined 29.5%. Since the March 1, 2020 establishment of the DSCI, LFVN has gained 3.7%. It is worth noting that share price is 228% higher than it was three years ago. Their first quarter of 2025 noted the following results.
- Revenue: $58.4 million, up 21% year-over-year.
- US Revenue Growth: 31% increase year-over-year.
- International Revenue Decline: 7% decrease year-over-year.
- Gross Margin: Improved by 210 basis points to 81%.
- Adjusted EBITDA: $6.4 million, a 27% increase year-over-year.
- Adjusted EBITDA Margin: Improved by 50 basis points to 11%.
- Active Accounts Growth in Americas: 17% increase year-over-year.
- Adjusted Non-GAAP Net Income: $3.5 million or $0.26 per diluted share.
- Cash Position: $22.5 million with no debt.
- Capital Expenditures: $300,000 in the third quarter.
- Share Repurchase: 140,000 shares repurchased for $1.1 million in fiscal 2025.
- Quarterly Dividend: $0.045 per share, totaling approximately $600,000.
- Fiscal 2025 Revenue Guidance: $228 million to $235 million.
- Fiscal 2025 Adjusted EBITDA Guidance: $21 million to $24 million.
- Fiscal 2025 Adjusted EPS Guidance: $0.72 to $0.88.
Positive Points
- Lifevantage Corp (NASDAQ:LFVN) reported a strong third quarter with revenues of $58.4 million, up 21% year-over-year.
- The MindBody GLP-1 system was a primary growth driver, with US revenues increasing by 31%.
- Gross margin improved by 210 basis points to 81%, driven by product mix and lower inventory-related expenses.
- Adjusted EBITDA increased by 27% year-over-year to $6.4 million, with an improved margin of 11%.
- The company launched the Evolve Compensation Plan and LV360 initiatives in multiple international markets, aiming to enhance consultant opportunities and business growth.
Negative Points
- International revenues declined by 7% year-over-year, highlighting ongoing challenges in these markets.
- Foreign currency fluctuations negatively impacted revenue by $500,000 in the third quarter.
- Commissions and incentive expenses increased to 44.8% of revenue, up from 40.9% in the prior year period.
- There was a sequential decline in active accounts in the Americas, attributed to previous stock-out issues.
- The company revised its fiscal 2025 revenue outlook downward, citing uncertainties in international market growth.
On the investor call, the company shared some additional information that is worth noting in this report.
Q & A Highlights:
Can you provide insights into the percentage of new customers subscribing to your products, and how does this impact your top-line assumptions?
Steven Fife, President and CEO, noted that while there was a slight decline in active accounts sequentially, the subscription rate increased. Historically, about 70% of revenue has been from subscriptions, and during the quarter, 85% of new MindBody customers subscribed. This reflects the product’s positioning as a lifestyle choice requiring long-term use for full benefits.
Are you seeing more purchases in product stacks versus stand-alone products?
Fife explained that about 55% of MindBody revenue was from stand-alone purchases, while 45% included additional products, such as Protandim Nrf2 or Liquid Collagen. This stacking approach aligns with the company’s strategy of promoting synergistic benefits, enhancing average revenue per account and customer retention.
What factors contributed to the reduction in revenue outlook, and is it due to past or anticipated future results?
Fife attributed the revenue outlook adjustment to both past and anticipated future results. The initial product launch success led to inventory shortages, affecting sales. Although supply chain issues are resolved, uncertainty remains in international markets, prompting a cautious revenue forecast.
What caused the decline in active accounts in the Americas, and is it related to the stock-out situation?
Carl Aure, CFO, confirmed that the decline in active accounts was primarily due to the stock-out situation, particularly affecting customer accounts. Consultant accounts remained flat sequentially, and the company believes the majority of the attrition is behind them, with plans to rebuild moving forward.
What have you learned about the MindBody product and educating your sales force on its benefits?
Fife shared that the company learned the importance of positioning MindBody as a long-term health solution rather than a quick weight-loss fix. Consultants who focused on sustainable health benefits saw better retention and growth. The company emphasized lifestyle changes and the natural, long-term benefits of the product, which has resonated well with consultants.
Short Interest Data & Analysis
The following chart is an aggregate index of “days to cover” among the entire tracking set. Days to cover (DTC) is a measurement determined by dividing the total outstanding short interest by average daily trading volume.

As indicated in the chart, short interest in DSCI stocks was 5.3 days as of March 31, 2025. Short interest can be a difficult indicator to analyze. On the one hand, an increase in short interest can be a bearish sign in that it indicates an increased view among investors that a stock is likely to decline based on any number of factors, such as a belief that the company’s fundamentals are deteriorating or that it has run too far, too fast. On the other hand, as a stock moves higher, a significant short interest can serve as extra fuel on the fire as investors scramble to “buy to cover” their short positions and mitigate losses.

Analyst Sentiment Index
The DSCA Analyst Sentiment Index is a consensus tracking tool that aggregates and averages the recommendations of all covering analysts across all public direct selling companies.

-
March 2025
Brought to you by Direct Selling Capital Advisors
Direct Selling Index mirrors the DJIA for the month of March and for the first quarter 2025
The Direct Selling Capital Advisors Direct Selling Index (DSCI) declined 4.2% lower in March. The DJIA also fell 4.2% in March. Over the first quarter of 2025, the DSCI and the DJIA’s both declined by 1.3%. We continue to see the DSCI under perform other major indices. However, the DSCI has over performed vs. other indices. As our channel continues to transition, the DSCI should improve vs. other indices.


There is a lot of uncertainty in the marketplace due to President Trump’s near daily announcements regarding potential tariffs on Mexico, Canada, China and the European Union among others, which has created significant policy uncertainty and weighed on investor sentiment. In addition, recent key economic releases, including retail sales, services PMI (a measure of business activity in the sector) and The Conference Board’s widely followed Consumer Confidence Index®, have fallen short of analysts’ expectations.
The Conference Board Consumer Confidence Index fell by 7.2 points in March to 92.9 (1985=100). The Present Situation Index—based on consumers’ assessment of current business and labor market conditions—decreased 3.6 points to 134.5. The Expectations Index—based on consumers’ short-term outlook for income, business and labor market conditions—dropped 9.6 points to 65.2, the lowest level in 12 years and well below the threshold of 80 that usually signals an impending recession. The cutoff date for preliminary results was March 19, 2025.
“Consumer confidence declined for a fourth consecutive month in March, falling below the relatively narrow range that had prevailed since 2022,” said Stephanie Guichard, Senior Economist, Global Indicators at The Conference Board. “Of the Index’s five components, only consumers’ assessment of present labor market conditions improved, albeit slightly. Views of current business conditions weakened to close to neutral. Consumers’ expectations were especially gloomy, with pessimism about future business conditions deepening and confidence about future employment prospects falling to a 12-year low. Meanwhile, consumers’ optimism about future income—which had held up quite strongly in the past few months—largely vanished, suggesting worries about the economy and labor market have started to spread into consumers’ assessments of their personal situations.”
March’s fall in confidence was driven by consumers over 55 years old and—to a lesser extent—those between 35 and 55 years old. By contrast, confidence rose slightly among consumers under 35, as an uptick in their assessments of the present situation more than offset gloomier expectations. The decline was also broad-based across income groups, with the only exception being households earning more than $125,000 a year.

Guichard added: “Likely in response to recent market volatility, consumers turned negative about the stock market for the first time since the end of 2023. In March, only 37.4% expected stock prices to rise over the year ahead—down nearly 10 percentage points from February and 20 percentage points from the high reached in November 2024. On the flip side, 44.5% expected stock prices to decline (up 11 ppts from February and over 22 ppts more than November 2024). Meanwhile, average 12-month inflation expectations rose again—from 5.8% in February to 6.2% in March—as consumers remained concerned about high prices for key household staples like eggs and the impact of tariffs.”
Consumers’ views of their Family’s Current Financial Situation improved slightly but their expectations for future finances declined to the lowest level since July 2022. The proportion of consumers anticipating a recession over the next 12 months remained steady at a nine-month high. (These measures are not included in calculating the Consumer Confidence Index). The share of consumers expecting higher interest rates over the next 12 months increased to 54.6% from 52.6% in February, while the share of consumers expecting lower interest rates dropped further to 22.4% from 24.1%.
A special question about how easy it is for consumers to form expectations about the future found considerable self-confidence among consumers in assessing their own future income prospects and family financial situation, with over 45% finding it easy and only about 20% finding it difficult. However, forming expectations about broader economic trends appeared more challenging: over one-third found it difficult to assess future employment and business conditions while 38.8% found it difficult to predict inflation.
On a six-month moving average basis, purchasing plans for both homes and cars declined. Surprisingly, given the anxiety about the future, intentions to buy big-ticket items—including appliances and electronics—ticked up, which may reflect plans to buy before impending tariffs lead to price increases. Consumers’ overall intentions to purchase additional services in the months ahead were little changed, but their priorities shifted. Fewer consumers planned to spend more on movies and live entertainment or sports, and more planned to spend on outdoor activities and travel. Vacation plans also increased.
Comments on the current Administration and its policies, both positive and negative, dominated consumers’ write-in responses on what is affecting their views of the economy. Write-in responses also showed that inflation is still a major concern for consumers and that worries about the impact of trade policies and tariffs specifically are on the rise. There were also more references than usual to economic and policy uncertainty.
Present Situation
Consumers’ assessments of current business conditions were significantly less positive in March. 17.7% of consumers said business conditions were “good,” down from 19.1% in February. 16.6% said business conditions were “bad,” up from 14.8%. Consumers’ views of the labor market improved slightly in March. 33.6% of consumers said jobs were “plentiful,” unchanged from February. 15.7% of consumers said jobs were “hard to get,” down from 16.0%.

Expectations for the coming six months worsened in March. 17.1% of consumers expected business conditions to improve, down from 20.8% in February. 27.3% expected business conditions to worsen, up from 25.5%. Consumers’ outlook for the labor market outlook also deteriorated. 16.7% of consumers expected more jobs to be available, down from 18.8% in February. 28.5% anticipated fewer jobs, up from 26.6% in February. Consumers were more pessimistic about their income prospects in March. 16.3% of consumers expected their incomes to increase, down from 18.8% in February. 15.5% expected their income to decrease, up from 12.8%.
Consumers’ assessments of their Family’s Current Financial Situation improved slightly in March.

Consumers’ assessments of their Family’s Expected Financial Situation weakened to a 2½-year low.

Consumers’ Perceived Likelihood of a US Recession over the Next 12 Months held steady in March.

Looking Forward
The direct selling channel has some significant headwinds in near future due to a lot of uncertainty in the global marketplace. We are seeing more companies moving away from a sole dependency for distributors to drive revenue through an omnichannel strategy. At the same time, we are seeing companies committed to the MLM business model showing growth. As the first quarter reports are filed, it will provide a more detailed look at the state of our channel with these publicly traded companies. We are likely to see more acquisitions and companies closing the doors, similar to what Modere did in April 2025.
The Direct Selling Capital Advisors Index (DSCI) is a market capitalization weighted index of all domestic public direct selling companies with a market capitalization of at least $25 million. The index is rebalanced monthly, and no single issue is permitted to represent more than 20% of its total value. In such an event, the excess weighting would be redistributed among the other index components.
Large Cap
Note: For the purposes of this report, Direct Selling Capital considers companies with a market capitalization in excess of $1 billion “Large Cap.”
Betterware de Mexico (NASDAQ: BWMX) Founded in 1995, Betterware de Mexico is the leading direct-to-consumer company in Mexico focused on offering innovative products that solve specific needs related to household organization, practicality, space-saving and hygiene. Through the acquisition of JAFRA on April 7, 2022, the Company now offers a leading brand of direct-to-consumer in the Beauty market in Mexico and the United States where it offers Fragrances, Color & Cosmetics, Skincare and Toiletries. The combined company possesses an asset-light business model with low capital expenditure requirements and a track record of strong profitability, double digit rates of revenue growth and free cash flow generation. Today, the Company distributes its products in Mexico and the United States.
Their stock price inched 0.8% higher in March, bringing its YTD gain to 0.2%. For the first quarter, their stock has increased by 1.7%. Since the March 1, 2020 inception of the DSCI, BWMX has appreciated 20.5%. Additional financial data is at the end of this report.
The first quarter results will be posted on April 24th, the revenue estimates for the first quarter were $4.91%. Analyst project the revenue growth this year will be 14.08%. We will update the first quarter numbers in our April Stock Performance report.
Betterware de México paid an aggregate dividend of MX $250,000,000. This amount represents approximately US $0.3212 per share before applicable tax withholdings, or approximately US $0.2891 per share after applicable tax withholdings. That dividend was paid out on March 25, 2025 to shareholders of record as of March 18, 2025.
BWMX began trading in March 2020 after the company’s merger with SPAC sponsor DD3 Acquisition Corp. BWMX specifically targets the Mexican market; it serves three million households through distributors and associates in approximately 800 communities throughout Mexico.
Nu Skin Enterprises, Inc. (NYSE: NUS)
Nu Skin Enterprises, Inc., together with its subsidiaries, engages in the development and distribution of various beauty and wellness products worldwide. It offers skin care devices, cosmetics and other personal care products, including ageLOC LumiSpa and ageLOC LumiSpa iO; and nutricentials skincare products. The company also provides wellness products, such as LifePak nutritional supplements, ageLOC TR90 weight management system and Beauty Focus Collagen+. In addition, it is involved in the research and product development of skincare products and nutritional supplements. The company sells its products under the Nu Skin, Pharmanex, and ageLOC brands through retail stores, website, digital platforms, and independent direct sellers and marketers, as well as a service center. Nu Skin Enterprises, Inc. was founded in 1984 and is headquartered in Provo, Utah.
In March, the stock had a decline of 8.3% although for the first quarter, the stock was up 5.4%. Since the direct selling index was established in March 2020, their stock has declined 69.2%. The stock’s 52 week high is $14 and the low was $5.95. Analyst predict a growth estimate of 23.25% for 2025. First quarter results will be posted on May 8, 2025. Additional financial data is at the end of this report.
The company has now essentially completed its restructuring plan. In 2025, NUS anticipates improving business trends and a return to year-over-year growth in several of its markets, but it also expects continued economic challenges and poor consumer sentiment, particularly in Greater China and South Korea. Management projects full-year 2025 revenue and ongoing EPS of $1.48-$1.62 billion and $0.90-$1.30, respectively. Full-year 2024 revenue and EPS from ongoing operations totaled $1.73 billion and $0.84, respectively.
Herbalife Nutrition, Inc. (NYSE: HLF) Herbalife Ltd., together with its subsidiaries, provides health and wellness products in North America, Mexico, South and Central America, Europe, the Middle East, Africa, China and the Asia Pacific. The company offers products in the areas of weight management; targeted nutrition; energy, sports and fitness; outer nutrition and literature, promotional and other items. It also provides weight management products, including meal replacement products, protein shakes, drink mixes, weight loss supplements, healthy snacks and metabolism boosting teas; targeted nutrition products, which comprise functional beverages and dietary and nutritional supplements that contain herbs, vitamins, minerals and other natural ingredients; outer nutrition products, such as facial skin, body and hair care products; and energy, sports, and fitness products, including N-R-G tea and energy drink products. In addition, it offers literature, promotional, and other materials that comprise start-up kits, sales tools and educational materials. The company sells its products through sales representatives, independent service providers as well as company-operated retail stores and platforms. The company was formerly known as Herbalife Nutrition Ltd. and changed its name to Herbalife Ltd. in April 2023. Herbalife Ltd. was founded in 1980 and is headquartered in Los Angeles, California.
For the month of March, their stock increased by 4.9%. Year-to-date, their stock has soared to 29%, one of the top three annual returns for a DSCI-best 52.0. Conversely, HLF is down 73.3% since the establishment of the DSCI on March 1, 2020. HLF will release its first quarter 2025 financial results after the close of trading on the NYSE on Wednesday, April 30, 2025, and we will update their information in our April Stock Performance Report. Additional financial data can be found at the end of this report.
On February 19, 2025, HLF reported 4Q 2024 sales of $1.21 billion, down 0.6% from $1.22 billion in 4Q 2023. On a constant currency basis, the company’s revenue increased 2.7% in the quarter. Even more constructive, HLF’s 4Q 2024 adjusted EBITDA reached $150.0 million, up from $108.0 million in the year-ago period, which translated into an adjusted EBITDA margin of 12.4% in 4Q 2024, up 340 basis points from 4Q 2023. In 4Q 2024, the number of new distributors joining HLF worldwide increased 22%, marking the company’s third consecutive quarter of year-over-year growth.
Also on February 19, HLF management issued guidance for full-year 2025 results. The company expects 2025 revenue to range from 3% below 2024 revenue of $4.99 billion to 3% above this figure. Furthermore, HLF’s 2025 adjusted EBITDA should be $600-$640 million compared with $634.8 million in 2024, and its 2025 capital expenditures should range from $100 to $130 million compared with $122.0 million in 2024.
On March 12, 2025, HLF announced it has entered into a binding memorandum of understanding to acquire 100% of the assets of Pro2col Health LLC (Pro2col) and Prüvit Ventures, Inc. (Prüvit), as well as a 51% controlling ownership interest in Link BioSciences Inc. (Link BioSciences).
Link BioSciences is an established manufacturing company that utilizes proprietary technology to process biometrics, biomarkers, lifestyle data and DNA and will harness the information from Pro2col to formulate personalized nutritional supplements for customers.
“By acquiring and leveraging Pro2col’s personalized digital technology, along with Link Biosciences’ manufacturing capabilities, Herbalife will be providing our expansive network of distributors with unique opportunities to expand their customer base through a personalized health, wellness and nutrition platform,” said Stephan Gratziani, Herbalife President and incoming CEO. “These investments further accelerate our vision to modernize our business and represent a belief in our business model that better positions us to become the world’s premier health and wellness company, community and platform.”
A beta version of the Pro2col technology platform is expected to be available to select Herbalife independent distributors in the US during the third quarter of 2025. A full release in the US is planned for the fourth quarter of 2025 with additional markets to follow beginning in 2026.
Pro2col is a health and wellness digital application company, which will use individual biometrics to provide personalized nutrition recommendations in support of a healthy, active lifestyle. The platform is designed to deliver tailored health and longevity protocols.
On May 1, 2025, Stephan Gratziani will succeed Michael Johnson as HLF’s CEO. At that time, Johnson will transition to the role of HLF’s Executive Chairman.
Medifast, Inc. (NYSE: MED) Medifast, Inc., through its subsidiaries, operates as a health and wellness company that provides habit-based and coach-guided lifestyle solutions to address obesity and support a healthy life in the United States. The company offers weight loss and weight management plans; and GLP-1 support plans that provide access to GLP-1 medications where clinically appropriate under the OPTAVIA brand name. It also provides bars, puffs, cereal, crunchers, drinks, hearty choices, oatmeal, pancakes, pudding, soft serve, shakes, smoothies, soft bakes and soups, as well as provides coaching support along with community, nutrition and healthy habits and helps people in their weight loss journey. It markets its products through point-of-sale transactions, as well as through ecommerce. Medifast, Inc. was founded in 1980 and is headquartered in Baltimore, Maryland.
In March, shares declined 6.1% compared to February 2025. For the first quarter of 2025, their stock price declined by 23.5%. MED is the worst performing DSCI large cap member on a long-term basis; since the March 1, 2020 establishment of the DSCI, the stock has declined 83%. First quarter results will be posted on April 28, 2025, and we will share those results in our April Stock Performance report. Additonal financial information can be found at the end of this report.
MED is realigning its business to respond to the evolving dynamics in the weight loss industry and to transform its business model to meet the soaring demand for GLP-1 medications. Indeed, up to 20 million people in the US could be using GLP-1 treatments by 2030 according to some projections. MED offers comprehensive support for GLP-1 medication users, including access to clinicians through LifeMD, as well as programs and products to help maintain muscle and minimize side effects. One such product designed for people on GLP-1 medications is OPTAVIA ASCEND, a line of high-protein, fiber-rich mini meals as well as a daily nutrient pack. MED announced OPTAVIA ASCEND on January 7, 2025.
One recent FDA ruling could impact the strategy of marketing weight loss through injectable peptides. In October 2025, a compounding industry group, the Outsourcing Facility Association, filed a lawsuit against the FDA’s decision that there was no longer a shortage of tirzepatide, the active ingredient in Zepbound and Mounjaro. The FDA said it would not take enforcement action against compounders before the court ruled.
Now, the FDA has announced a timeline for when most compounded versions may no longer be made. “The agency in October ended the tirzepatide injection shortage prematurely based on representations from drugmakers and incomplete data on demand for the compounded versions of the drug,” Scott Brunner, CEO of Alliance for Pharmacy Compounding, another compounding industry group, said in a statement to ABC News. “That premature decision resulted in unnecessary patient angst and interruptions of therapy when pharmacies could not access the FDA-approved drugs for those patients. When pharmacies consistently can’t obtain the FDA-approved drug in quantities they need to meet patient demand, that drug is not commercially available—the very definition of a shortage.”
The FDA says state-licensed compounding pharmacies must immediately stop making most compound versions of GLP-1 drugs based on tirzepatide. Larger outsourcing pharmacies making compound versions of Zepbound have until March 19 to stop, according to the FDA. State-licensed pharmacies must stop making most compounded semaglutide (copies of Novo Nordisk’s Wegovy and Ozempic) by April 22, and larger outsourcing pharmacies by May 22, or when district court rules on a pending injunction, whichever is first.
ABC News chief medical correspondent Dr. Tara Narula said on Good Morning America that the FDA’s decision to halt the making of compound versions of GLP-1 drugs will impact many people who have found the compound versions of the drugs easier to access and lower in price. There are some ways to help lower the price of GLP-1 medications, which can cost upward of $1,000 per month without insurance coverage. If insurance coverage is not an option, people can look for outside coupons, often found on drug manufacturers’ websites, to help lower the cost, according to Narula. Both Eli Lilly and Novo Nordisk now also offer consumers who lack insurance coverage the option to buy Zepbound and Wegovy, respectively, on direct-to-consumer platforms at a lower cost.
The FDA has previously warned consumers about using compounded versions of FDA-approved medications. “Compounded drugs pose a higher risk to patient than FDA-approved drugs because compounded drugs do not undergo FDA premarket review for safety, effectiveness, or quality,” the agency said in a statement to ABC News in 2023. “The FDA’s compounding program aims to protect patients from poor quality compounded drugs, while preserving access to lawfully marketed compounded drugs for patients.”
On February 18, MED reported 4Q 2024 revenue of $119.0 million, down 37.7% from $191.0 million in 4Q 2023. The company’s adjusted diluted EPS fell even more sharply to $0.10 in 4Q 2024 from $1.09 in the year ago period. The number of active earning OPTAVIA coaches decreased to 27,100 in 4Q 2024 from 41,100 in 4Q 2023. MED expects its 1Q 2025 revenue and adjusted diluted EPS will be in the $100-120 million and a loss of $0.50 to break-even ranges, respectively.
In February, shares of USANA Health Sciences, Inc. (NYSE: USNA) USANA Health Sciences, Inc. develops, manufactures, and sells science-based nutritional, personal care and skincare products in the Asia Pacific, the Americas and Europe. It operates in two segments, Direct selling and Hiya Direct-to-Consumer. The company offers USANA nutritional optimizers, including supplements for cardiovascular health, skeletal/structural health and digestive health; Essentials/CellSentials, such as vitamin and mineral supplements for age group beginning with children 13 months of age; and food products that include meal replacement shakes, snack bars and other related products for healthy weight management, digestive health and energy and hydration. It also provides Celavive, a skincare regimen for various skincare types and ethnicities; and all other products comprising materials and online tools for associates to build business and marketing of products The company sells its products through retail customers, a subscription model and direct selling as well as online. The company has a research collaboration agreement with Beijing University of Chinese Medicine and National Sports Training Bureau. USANA Health Sciences, Inc. was founded in 1992 and is headquartered in Salt Lake City, Utah.
In March, their stock value declined by 8.9% vs. February 2025. For the first quarter of 2025, the stock declined by 24.9%. Since the creation of the DSCI on March 1, 2020, USANA shares have lost 59.2% compared with gains of 65.3% for the direct selling index and the DJIA, respectively. For additional information, see the reports at the end of this report. Their first quarter will be posted April 22, 2025, and we will update those results in the April Stock Performance report.
USANA projects 2025 revenue and adjusted diluted EPS of $920 million to $1.0 billion and $2.35-3.00, respectively. The company’s 2024 revenue totaled $855 million, and its 2024 adjusted diluted EPS was $2.59. USANA’s 2025 revenue guidance includes $145-160 million from recently acquired Hiya Health Products, LLC, a leading direct-to-consumer provider of high-quality children’s health and wellness products. On December 23, 2024, USANA closed its acquisition of a 78.8% controlling ownership stake in Hiya. The $205 million cash transaction is expected to be immediately accretive to USANA’s 2025 adjusted EBITDA. As of September 30, 2024, Hiya had more than 200,000 customers. For the twelve months ended September 30, 2024, Hiya generated net sales of $103 million, net income of $19 million and adjusted EBITDA of $22 million. Hiya’s revenue for 2024 was about $112.5 million.
Reorganization and Hiya Health acquisition will accelerate market expansion, aim to improve efficiency, boost revenue growth and enhance market responsiveness through product launches and sales incentives. Acquiring Hiya Health and strengthening brand presence target growth in children’s health and overall brand differentiation for increased revenue and earnings. Economic uncertainties, strategic risks from a new acquisition and rising promotional costs could pressure USANA’s net margins and revenue growth, especially in China.
The reorganization of the R&D and commercial teams is meant to increase efficiency and speed in bringing new products to market, potentially leading to increased revenue growth by catering more effectively to market demands.
The acquisition of a majority stake in Hiya Health positions USANA to capture growth in the children’s health and wellness market, expected to drive both revenue and earnings growth as Hiya’s subscription model continues to deliver strong sales. The implementation of a strategic enhancement to the Associate incentive offering and modernized sales incentives is expected to drive customer growth and improve net margins by increasing sales efficiency and retention. The planned increase in the cadence of new product launches and reformulations, with over 20 planned for 2025, is likely to bolster revenue growth by continuously refreshing the product portfolio and catering to both existing and new markets. Enhanced brand messaging, story and value proposition aimed at delivering a stronger, more cohesive brand presence, are anticipated to support revenue growth by strengthening the overall brand reputation and differentiation in the marketplace.
eXp World Holdings, Inc. (NASDAQ: EXPI) eXp World Holdings, Inc., together with its subsidiaries, provides cloud-based real estate brokerage services for residential homeowners and homebuyers. It operates through three segments: North American Realty, International Realty and Other Affiliated Services. The company acts as a licensed broker for processing residential and commercial real estate transactions and provides other real estate support services. It also offers FrameVR.io, a web-accessible proprietary technology offering immersive 3D platforms; magazine and its related media properties which provide training, classes, resources and tools under the SUCCESS brand; SUCCESS Space, a coworking solution offering rental workspaces for individual and group use, access to professional development coaching, media production services, virtual-world communications technology and full-service cafes. It operates in North America, Canada, the United Kingdom, Australia, South Africa, India, Mexico, Portugal, France, Puerto Rico, Brazil, Italy, Hong Kong, Colombia, Spain, Israel, Panama, Germany, the Dominican Republic, Greece, New Zealand, Chile, Poland and Dubai. The company was formerly known as eXp Realty International Corporation and changed its name to eXp World Holdings, Inc. in May 2016. eXp World Holdings, Inc. was incorporated in 2008 and is headquartered in Bellingham, Washington.
The stock price dropped 3.3% in March vs. February 2025. For the first quarter of 2025, their stock prices have declined by 15%, 11.2% in February, adding to its 12.2% YTD loss. More constructively, EXPI shares have appreciated an aggregate 104.6% over the five years the DSCI has been computed, the second-best long-term mark for any DSCI member. The first quarter results will be posted on April 29, 2025, and we will cover those results in our April Stock Performance Report.
eXp World Holdings, Inc. announced that Jesse Hill, VP, International Finance & Corporate FP&A of eXp Realty has been named Interim Chief Financial Officer of the company effective April 1, 2025. The Company and its Board of Directors continue to conduct an active search for a permanent Chief Financial Officer among highly qualified external and internal candidates.
Earnings vs. Savings Rate is forecast to become profitable over the next 3 years, which is considered faster growth than the savings rate (2.8%). When comparing earnings vs. the market, EXPI is forecast to become profitable over the next 3 years, which is considered above average market growth. However, EXPI’s revenue (6.6% per year) is forecast to grow slower than the US market (8.3% per year).
On February 20, EXPI, the fastest growing real estate brokerage in the world, reported 4Q 2024 revenue and adjusted EBITDA of $1.1 billion and $7.7 million, respectively. These measures compare favorably with $981 million and $3.1 million, respectively, in 4Q 2023. EXPI ended 2024 with strong momentum; its top ten US agents closed over $100 million of transaction volume in December 2024 alone.
EXPI’s transaction volume in 4Q 2024 increased 17% to $45.3 billion from $38.7 billion in 4Q 2023. This performance is especially impressive given that US existing home sales in 2024 fell to their lowest level since 1995. Agents and brokers on EXPI’s platform totaled 82,980 as of December 31, 2024, down 5% from December 31, 2023, due primarily to the exit of unproductive agents.
A leading provider of financial services in the US and Canada and by far the largest market cap stock in the DSCI, Primerica, Inc. (NYSE: PRI) Primerica, Inc., together with its subsidiaries, provides financial products and services to middle-income households in the United States and Canada. The company operates in three segments: Term Life Insurance; Investment and Savings Products; Senior Health; and Corporate and Other Distributed Products. The Term Life Insurance segment underwrites individual term life insurance products. The Investment and Savings Products segment provides mutual funds and various retirement plans, managed investments, variable and fixed annuities and fixed indexed annuities and also offers segregated funds. The Corporate and Other Distributed Products segment provides mortgage loans; prepaid legal services that assist subscribers with legal matters, such as drafting wills, living wills and powers of attorney, trial defense and motor vehicle-related matters; ID theft defense services; auto and homeowners’ insurance; home automation solutions; and insurance products, including supplemental and accidental death and disability insurance. It distributes and sells its products through licensed sales representatives. Primerica, Inc. was founded in 1927 and is headquartered in Duluth, Georgia.
In March, the stock price declined by 1.9% vs February 2025 but is up 4.8% for the first quarter of 225. PRI has appreciated 159.7% since March 1, 2020, the best long-term performance for any DSCI member. The first quarter results will be posted on May 5, 2025, and we will cover those results once they are made public. There is additional information at the end of this report.
Generally, companies experiencing growth in earnings per share (EPS) should see similar trends in share price. So, it makes sense that experienced investors pay close attention to company EPS when undertaking investment research. Impressively, Primerica has grown EPS by 22% per year, compounded, in the last three years. If the company can sustain that sort of growth, we’d expect shareholders to come away satisfied.
It’s often helpful to look at earnings before interest and tax (EBIT) margins, as well as revenue growth, to get another take on the quality of the company’s growth. Our analysis has highlighted that Primerica’s revenue from operations did not account for all their revenue in the previous 12 months, so our analysis of its margins might not accurately reflect the underlying business. While we note Primerica achieved similar EBIT margins to last year, revenue grew by a solid 12% to US$3.2b. That’s a real positive.
When comparing PRI’s return vs. the industry, PRI exceeded the US insurance industry which returned 19.4% over the past year. In addition, PRI exceeded the US Market which returned 4.8% over the past year. Debt vs. equity ratio is considered high at 57.2%. However, PRI’s debt is well covered by operating cash flow (43.4%) and interest coverage are well covered by EBIT (11.7x coverage).
PRI’s interest payments on its debt are well covered by EBIT (11.7x coverage). In 4Q 2024, PRI repurchased $44.4 million of its shares, completing the Board of Directors’ authorization to buy back $425 million of stock in 2024. In mid-November, PRI’s Board authorized $450 million of share repurchases from mid-November 2024 through December 31, 2025. PRI’s Board also authorized a 16% increase in its quarterly dividend to $1.04 (a $4.16 annual rate). The higher dividend rate was paid on March 14, 2025 to stockholders of record on February 21, 2025.
Nature’s Sunshine Products, Inc. (NASDAQ: NATR) Nature’s Sunshine Products, Inc., a natural health and wellness company, manufactures and sells nutritional and personal care products in Asia, Europe, North America, Latin America and internationally. The company provides general health products related to blood sugar support, bone health, cellular health, cognitive function, joint health, mood, sexual health, sleep, sports and energy and vision; immune products; cardiovascular products; and digestive products. It also offers personal care products, including oils and lotions, aloe vera gel, herbal shampoo, herbal skin treatment, toothpaste and skin cleanser products, as well as weight management products. The company provides its products under the Nature’s Sunshine Products and Synergy WorldWide brands directly to customers and to a sales force of independent consultants. Nature’s Sunshine Products, Inc. was founded in 1972 and is headquartered in Lehi, Utah.
In March, the stock price declined by 13.9% vs. February 2025. For the first quarter, the stock declined by 14.4%. Over the 61 months the DSCI has been calculated, NATR has gained 61.6%, the fourth best appreciation for any direct selling index stock over this period. The first quarter results will be posted on May 5, 2025.
Earlier this year, analysts provided financial guidance for full year 2025. For the period, the company expects net sales to range between $445 million to $470 million. The most recent guidance from analyst are forecasting 2025 revenues to be US $460M, approximately in line with the last 12 months. Per-share earnings are expected to surge 84% to US$0.77. Yet prior to the latest earnings, the analysts had been anticipating revenues of US $457.3M and earnings per share (EPS) of US $0.81 in 2025. So, it looks like there’s been a small decline in overall sentiment after the recent results—there’s been no major change to revenue estimates, but the analysts did make a small dip in their earnings per share forecasts. Statutory earnings per share fell badly short of expectations, coming in at US $0.40, some 38% below analyst forecasts, although revenues were okay, approximately in line with analyst estimates at US $454M.
The most important thing to take away is that the analysts downgraded their earnings per share estimates, showing that there has been a clear decline in sentiment following these results. Fortunately, the analysts also reconfirmed their revenue estimates, suggesting that it’s tracking in line with expectations. Although our data does suggest that Nature’s Sunshine Products’s revenue is expected to perform worse than the wider industry. There was no real change to the consensus price target, suggesting that the intrinsic value of the business has not undergone any major changes with the latest estimates.
With that said, the long-term trajectory of the company’s earnings is a lot more important than next year. At least one analyst has provided forecasts out to 2026, noting that products fail to spark excitement with consumers, as seen in its flat sales over the last three years. Smaller revenue base of $454.4 million means it hasn’t achieved the economies of scale that some industry juggernauts enjoy. Earnings per share fell by 31.3% annually over the last three years while its revenue was flat, showing each sale was less profitable.
Nature’s Sunshine Products is forecast to grow earnings and revenue by 34.8% and 2.2% per annum respectively. EPS is expected to grow by 34.9% per annum. Return on equity is forecast to be 10.4% in 3 years. Earnings vs. savings rate’s forecast earnings growth (34.8% per year) is above the savings rate (2.8%). Earnings vs. the market earnings (34.8% per year) are forecast to grow faster than the US market (13.5% per year). In addition, NATR’s earnings are expected to grow significantly over the next 3 years.
LifeVantage Corporation (NASDAQ: LFVN) LifeVantage Corporation engages in the identification, research, development, formulation and sale of advanced nutrigenomic activators, dietary supplements, nootropics, pre- and pro-biotics, weight management and skin and hair care products. It offers Protandim, a dietary supplement; LifeVantage Omega+, a dietary supplement that combines DHA and EPA Omega-3 fatty acids, Omega-7 fatty acids, and vitamin D3; LifeVantage ProBio, a dietary supplement to support gut health; LifeVantage IC Bright, a supplement to support eye and brain health, reduce eye fatigue and strain, supports cognitive functions, and support normal sleep patterns; LifeVantage Daily Wellness, a dietary supplement designed to strengthen immune health; LifeVantage Rise AM & Reset PM System that provides the body with the right nutrients; LifeVantage D3+, a dietary supplement that provides vitamin D3, vitamin K2, magnesium, calcium and other trace minerals to support a balanced immune system, strong bones and cardiovascular health; PhysIQ Fat Burn to support weight management; PhysIQ Prebiotic is a dietary supplement designed to support the good bacteria in the gut and a healthy microbiome; Petandim for Dogs, a supplement to combat oxidative stress in dogs; and Axio, a nootropic energy drink mix. The company also provides anti-aging skincare products, including liquid collagen, facial cleansers, eye cream, moisturizing cream, sunscreen, perfecting lotions, hand creams as well as hair care products, such as invigorating shampoos, nourishing conditioners and scalp serums under the TrueScience brand name. It sells its products through its website and network of independent consultants in the United States, Mexico, Japan, Australia, Hong Kong, Canada, Thailand, the United Kingdom, the Netherlands, Germany, Taiwan, Austria, Spain, Ireland, Belgium, New Zealand, Singapore and the Philippines. The company also launched Evolve Compensation Plan and other LV360 initiatives into the Philippines, Taiwan, Hong Kong and Singapore. The company is based in Lehi, Utah.
Their stock declined in March by 15.1% vs. February 2025. For the first quarter, the stock price has declined 16.8%, ending a three-month skein of outsized monthly gains (+20.7% in January, +20.3% in December, and +19.2% in November). LFVN’s decline in February flipped its YTD performance to a slight loss, minus 2.1%. Since the March 1, 2020 establishment of the DSCI, LFVN has gained 22.4%. It is worth noting that share price is 228% higher than it was three years ago. During the three years of share price growth, LifeVantage saw its earnings per share (EPS) drop 7.4% per year which is likely impacting the current results.
As well as measuring the share price return, investors should also consider the total shareholder return (TSR). The TSR incorporates the value of any spin-offs or discounted capital raisings, along with any dividends, based on the assumption that the dividends are reinvested. So, for companies that pay a generous dividend, the TSR is often a lot higher than the share price return. As it happens, LifeVantage’s TSR for the last 3 years was 271%, which exceeds the share price return mentioned earlier. This is largely a result of its dividend payments!
It’s good to see that LifeVantage has rewarded shareholders with a total shareholder return of 150% in the last twelve months. Of course, that includes the dividend. That’s better than the annualized return of 14% over half a decade, implying that the company is doing better recently. In the best-case scenario, this may hint at some real business momentum, implying that now could be a great time to delve deeper. While it is well worth considering the different impacts that market conditions can have on the share price, there are other factors that are even more important.
LifeVantage is extending its groundbreaking MindBody GLP-1 System™ to international markets. This expansion comes after a 49% year-over-year increase in fiscal Q2 revenue ending December 31, 2024, in the US, largely driven by the system’s success and clinical data on that formula reinforcing its effectiveness in supporting GLP-1 production.
The MB System™, as the product is known internationally, launched on March 15 for both LifeVantage Consultants and Customers in Japan. On the same date, it became available exclusively to Consultants in Australia, New Zealand, Europe, the UK, Mexico and Thailand. Customers in these regions gain access starting April 25.
The MB System™ is designed to naturally activate the body’s own GLP-1 production, providing a range of long-term health benefits that expand to weight management and beyond. “Consumers worldwide are seeking sustainable health solutions that go beyond short-term, unsustainable weight management,” said Steve Fife, President and CEO of LifeVantage. “The MB System™ works harmoniously with the body, empowering individuals to naturally enhance their metabolic health in alignment with their lifestyle and wellness objectives.”
Interest in GLP-1 and metabolic health is rising worldwide. The global GLP-1 pharmaceutical market alone was valued at $53.46 billion in 2024 and is projected to grow at a CAGR of 17.5% from 2025 to 2030, reaching approximately $156.71 billion by 2030.
LFVN’s forecast earnings growth (34.1% per year) is above the savings rate (2.8%). Their earnings (34.1%) are forecast to grow faster than the US market (13.5% per year). Earnings are expected to grow significantly over the next 3 years. LFVN’s revenue (11.3% per year) is forecast to grow faster than the US market (8.3% per year).
Oliveda International, Inc. (OTC: OLVI) Founded in 2003, OLVI has more than 20 years of experience in: 1) the management and organic certification of mountain olive trees; 2) the extraction of international award-winning extra virgin olive oils; 3) the extraction of hydroxytyrosol, a substance which has several beneficial effects such as antioxidant, anti-inflammatory, anticancer, and as a protector of skin and eyes; and 4) the production and distribution of cosmetic and holistic waterless products related to the olive tree.
Oliveda International, Inc. and its subsidiary, Olive Tree People Inc., as well as the European companies, Olive Tree People Europe AG and Oliveda Deutschland GmbH, as well as Olive Tree Farmers SL, were founded by the German real estate investor Thomas Lommel and have more than 20 years of experience in management and organic certification growing mountain olive trees, in the extraction of first-class, internationally award-winning extra virgin olive oils; the extraction of hydroxytyrosol; and in the production and distribution of cosmetic and holistic waterless products related to the olive tree. Lommel is the inventor of the Olive Tree Therapy as well as the inventor of olive matcha, which is based on the ground olive leaf. Also unique is the coffee replacement product developed by Lommel, which is based on olive leaf and hydroxytyrosol. In addition, Lommel is successfully active in the rapidly growing mindfulness industry with the olive tree sound bath meditation he developed and the frequencies of his olive trees, which he makes available worldwide.
In addition to the registered beauty brands, Oliveda and LA Dope, as well as Re:connected to Nature, The Intuition of Nature, and Olive Mush, to name just a few, Lommel is the region’s largest conservationist and protector of over 30,000 100-year-old mountain olive trees, and—with his Thomas Lommel Foundation—he brings the water that he does not use into his waterless beauty products to the people of Africa by building water wells on site.
In addition to online sales and a Europe-wide branch network of thousands of retail stores, Oliveda Deutschland GmbH operates its own flagship stores in Berlin and Düsseldorf.
Comparing March 2025 to February 2025, the stock price declined by 2.4%. For the first quarter, the stock declined by 52.4%, the second worst performing large cap direct selling stock during the month. Over the first two months of 2025, OLVI has declined 53.5%.
Oliveda International, Inc. announced that after a sensational second year in the United States with sales of over $104.5 million, Olive Tree People continued to grow by over 400% in the first quarter of 2025.
Founder Thomas Lommel: “We expect many new highlights in 2025, such as the opening of our unique Olive Tree People Experience stores; the expansion into Canada and Europe; and the presentations of our Olive Rose brand with many other products such as blushes, contour concealers, etc. at New York Fashion Week in September 2025.
The company noted that they plan to launch additional Oliveda products, as well as the presentations of a completely new pet brand at the end of 2025. “In order to sustainably serve this growth, we already acquired additional land with 1,580 150-year-old mountain olive trees in the first quarter of 2025. These, like all our other 31,000-plus mountain olive trees, will now be eco-certified so that they can then be put into production. We will continue to intensify our waterless beauty education because we believe that every one of the approximately 169 million women in the US and beyond deserve to learn the difference between waterless beauty and conventional beauty.”
The Beachbody Company, Inc. (NYSE: BODI) The Beachbody Company, Inc. operates as a fitness and nutrition company in the United States and internationally. The company operates Beachbody on Demand, a streaming service through subscription that provides fitness programs, including P90X, Insanity and 21 Day Fix brands and offers nutrition programs, through subscription to Beachbody On Demand Interactive, such as Portion Fix and 2B Mindset brands. It also provides nutritional products, such as Shakeology, a nutrition shake; Beachbody Performance supplements comprising pre-workout energize, hydrate, post-workout recovery, and protein supplement recharge products; BEACHBAR, a low-sugar snack bar; Belle Vitale, a hormone health solution for women to address symptoms of hormone imbalance; and connected fitness products. The Beachbody Company, Inc. was founded in 1998 and is headquartered in El Segundo, California.
Their stock price declined by 4.8% vs. February 2025. For the first quarter, the stock price increased by 21.8%. “2024 was a pivotal year at BODi, as we continued to build upon our strategy to transform the Company. Our turnaround plan successfully streamlined our digital platform, lowering our break-even point and enhancing our liquidity position,” said Carl Daikeler, BODi’s Co-Founder and Chief Executive Officer. “We generated higher margin revenue streams and achieved positive operating cash flows while successfully rearchitecting the company from a Multi-Level Marketing network to a single level affiliate model. As we move into 2025, we have laid the foundation to execute the next phase of our turnaround which will maximize our market opportunities and continue to generate positive operating cash flow through our multi-channel strategy and new innovative products.”
Here are some key points from their fourth quarter results, the first reporting since moving to an affiliate model. Total revenue was $86.4 million compared to $119.0 million in the prior year period and was at the high end of the guidance range. Digital revenue was $50.4 million compared to $64.0 million in the prior year period and digital subscriptions totaled 1.07 million in the fourth quarter. Nutrition and Other revenue was $34.8 million compared to $51.8 million in the prior year period and nutritional subscriptions totaled 0.09 million in the fourth quarter. Connected Fitness revenue was $1.2 million compared to $3.2 million in the prior year period and approximately 2,700 bikes were delivered in the fourth quarter. Total operating expenses were $93.8 million, which included a $20.0 million impairment of goodwill, compared to $134.3 million in the prior year period, which included a $43.1 million impairment of goodwill and intangible assets. Operating loss decreased by $27.5 million to $32.9 million compared to an operating loss of $60.4 million in the prior year period. Net loss was $34.6 million, which included a $20.0 million impairment of goodwill, compared to a net loss of $65.0 million in the prior year period, which included a $43.1 million impairment of goodwill and intangible assets. Adjusted EBITDA1 was $8.7 million compared to $2.8 million in the prior year period.
BODI is the first public company to move away from a network marketing model to an affiliate model. As expect from private companies who have made a similar change, revenue declined significantly. In the coming months, we could see additional declines in revenue. Currently unprofitable and not forecast to become profitable over the next three years. Beachbody’s shift to an affiliate model and retail expansion broadens market reach and unlocks new revenue opportunities through direct-to-consumer channels. New product launches under recognized brands and innovative partnerships aim to bolster sales, enhance retention and capture health and wellness trends. Transition from MLM to omnichannel has led to revenue decline, challenges in scaling new sales channels and potential volatility in financial projections.
Beachbody’s transition from a multilevel marketing platform to a single-level affiliate model is expected to broaden their market reach, allowing the company to tap into new distribution opportunities. This shift is likely to impact revenue growth positively as they can leverage more direct-to-consumer channels and retail distribution that were previously inaccessible. The introduction of new products under well-known brand names like P90X and Insanity expands the product portfolio and is expected to drive increased sales. These products, available in major retailers and through direct channels, should significantly enhance revenue over time.
The company’s expansion into retail platforms such as Amazon and Walmart.com and the introduction of a subscription model like Subscribe & Save aim to boost long-term customer retention and revenue. This retail expansion can broaden Beachbody’s market reach and potentially stabilize and grow revenue streams. The launch of new programs and marketing strategies, such as the women’s hormone health program Belle Vitale and expanding sales channels, are designed to attract new customers and affiliates. These initiatives are expected to bolster brand visibility and revenue growth as they tap into significant health and wellness trends. Beachbody’s focus on leveraging partnerships, like those offering their products via HSA/FSA accounts and telehealth services, is likely to provide new customer engagement platforms, potentially enhancing cash flow and earnings by accessing an untapped segment of consumers interested in health and wellness expenditures.
Below are two charts that summarize the large cap direct selling companies.


Small Cap
Below are two charts on the small companies.


Short Interest Data & Analysis
The following chart is an aggregate index of “days to cover” among the entire tracking set. Days to cover (DTC) is a measurement determined by dividing the total outstanding short interest by average daily trading volume.

As indicated in the chart, short interest in DSCI stocks was 4.7 days as of February 28, 2025. Short interest can be a difficult indicator to analyze. On the one hand, an increase in short interest can be a bearish sign in that it indicates an increased view among investors that a stock is likely to decline based on any number of factors, such as a belief that the company’s fundamentals are deteriorating or that it has run too far, too fast. On the other hand, as a stock moves higher, a significant short interest can serve as extra fuel on the fire as investors scramble to “buy to cover” their short positions and mitigate losses.
Analyst Sentiment Index
The DSCA Analyst Sentiment Index is a consensus tracking tool that aggregates and averages the recommendations of all covering analysts across all public direct selling companies.

-
February 2025
Brought to you by Direct Selling Capital Advisors
Direct Selling Index Drops Slightly in February but Outperforms the DJIA for the Second Consecutive Month
The Direct Selling Capital Advisors Direct Selling Index (DSCI) inched 0.1% lower in February, but it outperformed the Dow Jones Industrial Average (DJIA) for the second straight month. The DJIA fell 1.6% in February. Over the first two months of 2025, the DSCI has gained 5.8%, nearly double the DJIA’s 3.0% increase.
Large cap direct selling stocks generally outperformed their smaller cap peers in February. Four large cap DSCI components gained during the month, paced by a 52% jump in the stock price of Herbalife Nutrition, Inc. (NYSE: HLF), while the share prices of six large cap DSCI members fell. By comparison, one small cap direct selling stock with a market value of more than $2 million increased, while three decreased.
From a longer-term perspective, the DSCI has gained an aggregate 39.2% since its March 1, 2020 inception. The DJIA has outperformed the direct selling index over this period. Since March 1, 2020, the DJIA has appreciated 72.5%.
In February 2025, fear seemed to supplant greed as the dominant factor in the US stock and bond markets. Indeed, NASDAQ: TLT, the widely traded ETF that focuses on long-term Treasury bonds, soared 5.3% last month, while the DJIA and the broader S&P 500 Index declined 1.6% and 1.4%, respectively. This represents the largest monthly return differential in favor of long-term Treasuries since March 2020 when investors were beginning to understand details about the COVID-19 virus.
What happened? President Trump’s near daily announcements regarding potential tariffs on Mexico, Canada, China and the European Union, among others, has created significant policy uncertainty and weighed on investor sentiment. In addition, recent key economic releases, including retail sales, services PMI (a measure of business activity in the sector), and The Conference Board’s widely followed Consumer Confidence Index, have fallen short of analysts’ expectations. Finally, the previously bullet-proof Magnificent Seven stocks have fallen out of favor this year; indeed, six of the seven high-profile, fast-growing stocks have underperformed the S&P 500 over the first nine weeks of 2025. In the interim, the stock market has struggled to find a leadership group to replace this core group of stocks.
Looking Forward
Direct selling stocks have largely finished reporting their 4Q 2024 and full-year 2024 financials, so DSCI stocks will be most heavily affected by the tone of the overall stock market. Clearly, February and the first week of March have demonstrated the stock market has transitioned to a more volatile phase than its more consistent (positive) tenor of the last two years, but several factors remain in place that are supportive of continued economic growth and solid potential returns for stock market investors.
First, despite the recent tepid economic statistics, the US economy still seems poised for about 2% GDP growth in 2025—even if the Trump Administration implements aggressive, rapidly changing and fairly broad-based tariffs. Second, job growth in the US remains robust; payrolls have increased on average 210,000 per month over the last four months.
Third, analysts and economists expect earnings for the S&P 500 to increase more than 10% in 2025 after rising about 18% in 4Q 2024. Finally, declines in the prices of many widely held stocks have prompted many investors to turn bearish, a time-tested contrarian indicator. According to the American Association of Individual Investors, 61% of investors expect the stock market to decline over the next six months, the highest proportion since September 2022. September 2022 marked the approximate bottom of a sharp stock market decline which began in November 2021. Since September 2022, the S&P 500 has jumped about 50%.
CHARTS & ANALYSIS
Direct Selling Capital Advisors Index
The DSCI is a market capitalization weighted index of all domestic public direct selling companies with a market capitalization of at least $25 million. The index is rebalanced monthly, and no single issue is permitted to represent more than 20% of its total value. In such an event, the excess weighting would be redistributed among the other index components.
The DSCI declined slightly in February, but it outperformed the DJIA during the month. The DSCI lost 0.1% in February, a much smaller loss than the DJIA’s 1.6% decrease in the month. DSCI data is tracked back to March 1, 2020. The direct selling index has risen 39.2% since that date versus a 72.5% appreciation for the DJIA over the same period.

Large Cap
Betterware de Mexico (NASDAQ: BWMX) inched 0.8% higher in February, bringing its YTD gain to 1.5%. Since the March 1, 2020 inception of the DSCI, BWMX has appreciated 20.5%.
On February 27, BWMX reported 4Q 2024 consolidated net revenue of $3.8 billion pesos, up 11.1% from 3.4 billion pesos in the year-ago period. The stronger sales were driven by innovation, improved incentives, and a revamped catalog. On the other hand, the company’s adjusted EBITDA fell 5.8% in 4Q 2024 to 772 million pesos from 820 million pesos in 4Q 2023. The decline is mostly attributable to a 17.3% reduction in Jafra Mexico’s 4Q 2024 EBITDA; significant synergies and cost optimization benefits were recognized in the division’s 4Q 2023 results. BWMX’s 4Q 2024 adjusted EPS was 11.70 pesos versus 10.59 pesos in 4Q 2023.
In 2025, BWMX management expect to post net revenue of 14.9-15.3 billion pesos, up from 14.101 billion pesos in the full year 2024, and 2.9-3.0 billion pesos of EBITDA compared with 2.775 billion pesos in 2024. This translates into year-over-year increases in each metric of between 6% and 9% in 2025.
BWMX began trading in March 2020 after the company’s merger with SPAC sponsor DD3 Acquisition Corp. BWMX specifically targets the Mexican market; it serves three million households through distributors and associates in approximately 800 communities throughout Mexico.
Nu Skin Enterprises, Inc. (NYSE: NUS) jumped 20.9% in February, making it the second best performing DSCI component during the month. Year to date, NUS has increased 14.9%. Nevertheless, NUS has fallen 66.4% since the direct selling index was established in March 2020. In comparison, the direct selling stock index and the Dow Jones Industrial Average have gained 39.2% and 72.5%, respectively, over this five-year period.
On February 13, 2025, NUS reported 4Q 2024 revenue and EPS from continuing operations of $445.6 million and $0.38 versus $488.6 million and $0.37, respectively, in the year-ago period. Importantly, revenue at the company’s fast-growing Rhyz subsidiary reached $83.1 million in 4Q 2024, up 27.7% from 4Q 2023. NUS’ overall 4Q 2024 revenue exceeded the guidance management issued in early November 2024, as the company has now essentially completed its restructuring plan.
In 2025, NUS anticipates improving business trends and a return to year-over-year growth in several of its markets, but it also expects continued economic challenges and poor consumer sentiment, particularly in Greater China and South Korea. Management projects full-year 2025 revenue and ongoing EPS of $1.48-$1.62 billion and $0.90-$1.30, respectively. Full-year 2024 revenue and EPS from ongoing operations totaled $1.73 billion and $0.84, respectively.
In early January 2025, NUS’ Rhyz subsidiary sold its Mavely affiliate marketing technology platform to Later for approximately $250 million in cash and a minority equity stake in the combined Later/Mavely business. About $33 million of this consideration will be paid to other equity holders in the Mavely business. Later is a portfolio company of Summit Partners. Mavely is expected to continue to provide certain technology and social commerce capabilities to support NUS’ marketing business.
Herbalife Nutrition, Inc. (NYSE: HLF) soared a DSCI-best 52% in February, emphatically breaking a two-month streak of double digit percentage monthly declines (negative 18.4% in January 2025 and negative 13.9% in December 2024). Over the first two months of 2025, HLF has appreciated 24.1%. Conversely, HLF is down 74.4% since the establishment of the DSCI on March 1, 2020, the second worst long-term performance for any large-cap DSCI component which has traded continuously since index inception.
On February 19, 2025, HLF reported 4Q 2024 sales of $1.21 billion, down 0.6% from $1.22 billion in 4Q 2023. On a constant currency basis, the company’s revenue increased 2.7% in the quarter. Even more constructive, HLF’s 4Q 2024 adjusted EBITDA reached $150.0 million, up from $108.0 million in the year-ago period, which translated into an adjusted EBITDA margin of 12.4% in 4Q 2024, up 340 basis points from 4Q 2023. In 4Q 2024, the number of new distributors joining HLF worldwide increased 22%, marking the company’s third consecutive quarter of year-over-year growth.
Also on February 19, HLF management issued guidance for full-year 2025 results. The company expects 2025 revenue to range from 3% below 2024 revenue of $4.99 billion to 3% above this figure. Furthermore, HLF’s 2025 adjusted EBITDA should be $600-$640 million compared with $634.8 million in 2024, and its 2025 capital expenditures should range from $100 to $130 million compared with $122.0 million in 2024.
On May 1, 2025, Stephan Gratziani will succeed Michael Johnson as HLF’s CEO. At that time, Mr. Johnson will transition to the role of HLF’s Executive Chairman.
Medifast, Inc. (NYSE: MED) shares declined 8.5% in February, bringing its loss for the first two months of 2025 to 18.5%. MED is the worst performing DSCI large cap member on a long-term basis; since the March 1, 2020 establishment of the DSCI, the stock has declined 81.9%.
On February 18, MED reported 4Q 2024 revenue of $119.0 million, down 37.7% from $191.0 million in 4Q 2023. The company’s adjusted diluted EPS fell even more sharply to $0.10 in 4Q 2024 from $1.09 in the year ago period. The number of active earning OPTAVIA coaches decreased to 27,100 in 4Q 2024 from 41,100 in 4Q 2023. MED expects its 1Q 2025 revenue and adjusted diluted EPS will be in the $100-$120 million and a loss of $0.50 to break-even ranges, respectively.
MED is realigning its business to respond to the evolving dynamics in the weight loss industry and to transform its business model to meet the soaring demand for GLP-1 medications. Indeed, up to 20 million people in the US could be using GLP-1 treatments by 2030 according to some projections. MED offers comprehensive support for GLP-1 medication users, including access to clinicians through LifeMD, as well as programs and products to help maintain muscle and minimize side effects. One such product designed for people on GLP-1 medications is OPTAVIA ASCEND, a line of high-protein, fiber-rich mini meals, as well as a daily nutrient pack. MED announced OPTAVIA ASCEND on January 7, 2025.
In February, shares of USANA Health Sciences, Inc. (NYSE: USNA) lost 9.1%. This performance pushed USANA’s YTD decline to 17.6%. Since the creation of the DSCI on March 1, 2020, USANA shares have lost 55.2% compared with gains of 39.2% and 72.5% for the direct selling index and the DJIA, respectively.
On February 25, USANA reported 4Q 2024 revenue and adjusted diluted EPS of $214 million and $0.64, both down from $221 million and $0.87, respectively, in the year ago period. USANA’s 4Q 2024 results exceeded its internal forecasts, highlighted by 7% sequential net sales growth. Positive momentum in the company’s Americas & Europe region generated year-over-year and sequential sales growth, while performance in its Asia Pacific region declined slightly and was in line with expectations.
USANA projects 2025 revenue and adjusted diluted EPS of $920 million to $1.0 billion and $2.35-$3.00, respectively. The company’s 2024 revenue totaled $855 million, and its 2024 adjusted diluted EPS was $2.59.
USANA’s 2025 revenue guidance includes $145-$160 million from recently acquired Hiya Health Products, LLC, a leading direct-to-consumer provider of high-quality children’s health and wellness products. On December 23, 2024, USANA closed its acquisition of a 78.8% controlling ownership stake in Hiya. The $205 million cash transaction is expected to be immediately accretive to USANA’s 2025 adjusted EBITDA. As of September 30, 2024, Hiya had more than 200,000 customers. For the twelve months ended September 30, 2024, Hiya generated net sales of $103 million, net income of $19 million, and adjusted EBITDA of $22 million. Hiya’s revenue for 2024 was about $112.5 million.
eXp World Holdings, Inc. (NASDAQ: EXPI) dropped 11.2% in February, adding to its 12.2% YTD loss. More constructively, EXPI shares have appreciated an aggregate 111.5% over the five years the DSCI has been computed, the second-best long-term mark for any DSCI member.
On February 20, EXPI, the fastest growing real estate brokerage in the world, reported 4Q 2024 revenue and adjusted EBITDA of $1.1 billion and $7.7 million, respectively. These measures compare favorably with $981 million and $3.1 million, respectively, in 4Q 2023. EXPI ended 2024 with strong momentum; its top ten U.S. agents closed over $100 million of transaction volume in December 2024 alone.
EXPI’s transaction volume in 4Q 2024 increased 17% to $45.3 billion from $38.7 billion in 4Q 2023. This performance is especially impressive given that US existing home sales in 2024 fell to their lowest level since 1995. Agents and brokers on EXPI’s platform totaled 82,980 as of December 31, 2024, down 5% from December 31, 2023, due primarily to the exit of unproductive agents.
A leading provider of financial services in the US and Canada, and by far the largest market cap stock in the DSCI, Primerica, Inc. (NYSE: PRI) inched 0.1% lower in February, slightly reducing its 6.8% YTD gain. PRI has appreciated 164.7% since March 1, 2020, the best long-term performance for any DSCI member.
On February 11, PRI reported 4Q 2024 adjusted operating revenue of $788.1 million, up 12% from $706.2 million in the year-ago period. The company’s adjusted operating EPS grew at an even faster pace (+14%), reaching $4.98 in 4Q 2024 versus $4.35 in 4Q 2023. Financial results were notably strong in 4Q 2024 driven by steady premium revenue growth due to the cumulative impact of new policy sales in recent periods which added to PRI’s large block of in-force life insurance policies. This growth, combined with higher Investment and Savings Products sales and rising client asset values, further boosted PRI’s overall performance in the quarter.
In 4Q 2024, PRI repurchased $44.4 million of its shares, completing the Board of Directors’ authorization to buy back $425 million of stock in 2024. In mid-November, PRI’s Board authorized $450 million of share repurchases from mid-November 2024 through December 31, 2025.
PRI’s Board also authorized a 16% increase in its quarterly dividend to $1.04 (a $4.16 annual rate). The higher dividend rate will be paid on March 14, 2025 to stockholders of record on February 21, 2025
Nature’s Sunshine Products, Inc. (NASDAQ: NATR) increased 4.7% in February, which brought its YTD performance to nearly flat (negative 0.6%). Over the 60 months the DSCI has been calculated, NATR has gained 87.6%, the third best appreciation for any direct selling index stock over this period.
In early November, NATR, which markets and distributes nutritional and personal care products in more than 40 countries, reported 3Q 2024 net sales of $114.6 million, up 3% from $111.2 million in the year ago period. Adjusted EBITDA in 3Q 2024 totaled $10.7 million, about 5% higher than $10.3 million in 3Q 2023. NATR’s impressive results in 3Q 2024 were driven by robust customer growth in Japan and Taiwan, continued progress in South Korea and customer activation in Central Europe.
Factoring in its solid results in 3Q 2024, NATR reset its full year 2024 net sales and adjusted EBITDA guidance slightly higher to $443-$448 million and $40-$42 million from previous ranges of $436-$445 million and $39-$42 million, respectively. NATR plans to report its 4Q 2024 financial results after the stock market closes on March 11th.
LifeVantage Corporation (NASDAQ: LFVN) dropped 18.9% in February, ending a three-month skein of outsized monthly gains (+20.7% in January, +20.3% in December and +19.2% in November). LFVN’s decline in February flipped its YTD performance to a slight loss, minus 2.1%. Since the March 1, 2020 establishment of the DSCI, LFVN has gained 44.2%.
On February 5, 2025, LFVN reported 2Q FY 2025 (quarter ended December 31, 2024) revenue, adjusted EBITDA, and adjusted EPS of $67.8 million, $6.5 million and $0.22, each of which markedly increased from $51.6 million, $3.1 million, and $0.10, respectively, in the year ago period. Strong demand for LFVN’s MindBody GLP-1 System (see below) and impressive growth in active accounts drove the robust 2Q FY 2025 results. Notably, active accounts were up 25% in the quarter compared with 1Q FY 2025 levels as the number of enrollments surged to the highest level in five years.
In turn, LFVN boosted its revenue, adjusted EBITDA, and adjusted EPS guidance ranges for FY 2025 (twelve months ending June 30, 2025) to $235-$245 million, $21-$24 million and $0.72-$0.88, respectively. The company’s previous guidance ranges were $200-$210 million, $18-$21 million, and $0.70-$0.80, respectively. LFVN’s FY 2024 revenue totaled $200.2 million; its FY 2024 adjusted EBITDA was $17.0 million; and its FY 2024 adjusted EPS was $0.59.
In early October 2024, LFVN released groundbreaking human clinical trial results from its MindBody GLP-1 System. Participants realized a 140% average increase in GLP-1 levels in the body, leading to an average weight loss of nine pounds in eight weeks and up to 25 pounds in twelve weeks. The 12-week, 60-participant clinical trial began in June 2024.
Oliveda International, Inc. (OTC: OLVI), the fourth largest market cap stock in the DSCI, fell 15.5% in February, making it the second worst performing large cap direct selling stock during the month. Over the first two months of 2025, OLVI has declined 53.5%.
Founded in 2003, OLVI has more than 20 years of experience in: 1) the management and organic certification of mountain olive trees; 2) the extraction of international award-winning extra virgin olive oils; 3) the extraction of hydroxytyrosol, a substance which has several beneficial effects such as antioxidant, anti-inflammatory, anticancer, and as a protector of skin and eyes; and 4) the production and distribution of cosmetic and holistic waterless products related to the olive tree.
OLVI’s 3Q 2024 revenue was $27.7 million, up nearly 1,500% from $1.8 million in 3Q 2023. Its net loss in 3Q 2024 was $38.5 million, or a loss of $0.06 per share, compared with net income of $1.8 million in the year ago period. Over the first nine months of 2024, OLVI generated positive operating cash flow of $10.3 million versus a slight loss over the first nine months of 2023.
OLVI’s Olive Tree People Inc. subsidiary sales increased by remarkable 1,650% and ~1,700+% rates in 4Q 2024 and the full year 2024, respectively, faster than celebrity brands such as JLO Beauty by Jennifer Lopez, and underscoring OLVI’s position as the world’s fastest growing waterless beauty company. Olive Tree People, Inc. sales totaled $104.5 million in 2024. The subsidiary’s daily sales exceeded the $2 million mark for the first time in September 2024. On November 22, Olive Tree’s daily sales were more than $3.7 million.

 Note: For the purposes of this report, Direct Selling Capital considers companies with a market capitalization in excess of $1 billion “Large Cap.”
Small Cap
Our small cap tracking set underperformed the large cap DSCI group in February. Of the small caps with a market cap of more than $2 million, one rose during the month, and three declined.
The Beachbody Company, Inc. (NYSE: BODI), a leading fitness and nutrition company, rose 6.2% in February, the best mark of any DSCI small cap member. This performance brought its YTD appreciation to 28.0%, the largest YTD gain for any DSCI component. In 3Q 2024, BODI reported revenue and adjusted EBITDA of $102.2 million and $10.1 million versus $128.3 million and negative $5.8 million, respectively, in the year ago period.


Short Interest Data & Analysis
The following chart is an aggregate index of “days to cover” among the entire tracking set. Days to cover (DTC) is a measurement determined by dividing the total outstanding short interest by average daily trading volume.
 As indicated in the chart, short interest in DSCI stocks was 5.4 days in mid-February 2025, up from 5.3 days at the end of January 2025 and 5.0 days in mid-January 2025. The biggest absolute increase in DTC in mid-February 2025 from the end of January 2025 for a DSCI component was LFVN’s increase to 6.6 days from 3.2 days.
Short interest can be a difficult indicator to analyze. On the one hand, an increase in short interest can be a bearish sign in that it indicates an increased view among investors that a stock is likely to decline based on any number of factors, such as a belief that the company’s fundamentals are deteriorating or that it has run too far, too fast. On the other hand, as a stock moves higher, a significant short interest can serve as extra fuel on the fire as investors scramble to “buy to cover” their short positions and mitigate losses.
Analyst Sentiment Index
Our Analyst Sentiment Index was unchanged in February from January. The proportion of sell-side analysts maintaining “buy” and “hold” ratings on industry stocks in both months was about 96%. Conversely, the percentage of stocks which analysts recommended selling in each month was around 4%.

Methodology: The DSCA Analyst Sentiment Index is a consensus tracking tool that aggregates and averages the recommendations of all covering analysts across all public direct selling companies.
-
January 2025
Brought to you by Direct Selling Capital Advisors
Direct Selling Index Increases 5.4% in January 2025, its 11th Gain in the Last 13 Months
The Direct Selling Capital Advisors Direct Selling Index (DSCI) increased 5.4% in January, marking its eleventh gain in the last 13 months. The Dow Jones Industrial Average (DJIA) also rose in January, but by a smaller amount, +4.7%.
Despite the DSCI’s increase in January, more large cap direct selling stocks fell during the month (three) than increased (seven). Primerica, Inc.’s (NYSE: PRI) 6.9% gain was the main fuel for the index’s 5.4% pop in the month. PRI is by far the largest direct selling stock by market capitalization. One large cap direct selling stock rose by more than 10% in January, while three fell by more than that percentage. Two small cap direct selling stocks with a market value of at least $2 million increased in January, and two fell.
From a longer-term perspective, the DSCI has gained an aggregate 39.4% since its March 1, 2020 inception. The DJIA has outperformed the direct selling index over this period. Since March 1, 2020, the DJIA has appreciated 75.3%.
In January 2025, the DJIA posted its second biggest monthly percentage gain in the last 13 months, trailing only its 7.3% November 2024 increase over this period. Investors reacted enthusiastically to three key pieces of financial data during the month. First, the Commerce Department’s release in late January that 4Q 2024 GDP grew at a 2.3% annualized rate reinforced investor confidence in the U.S. economy. Constructively, 4Q 2024 consumer spending increased at an even faster 4.2% annualized rate.
Second, a Bureau of Labor Statistics (BLS) report released earlier in the month that core CPI inflation moderated slightly in December 2024 likewise quelled inflation fears, and finally, the 4Q 2024 earnings season started strongly. Apple, Microsoft, Meta and most of the major banks reported solid results.
Another positive: investors were able to set aside (at least temporarily) concerns about rising interest rates that had pressured the stock market in the first two weeks of 2025. The yield on the benchmark US 10-year bond touched a 14-month high of 4.8% on January 13, but reversed lower after the CPI report was released. The yield on the 10-year US Treasury closed January 2025 at 4.57%. It has since moved even lower, falling to 4.42% on February 5, 2025.
Looking Forward
Direct selling stocks are beginning to announce their 4Q 2024 and full-year 2024 financials, so DSCI stocks will be quite sensitive to the individual results and forward guidance that management teams issue. Of course, the direct selling stocks will also be affected by the tone of the overall stock market.
The overriding question for the broad stock market in 2025 is whether the major stock indices can continue to perform well after back-to-back 20+% gains in 2023 and 2024. Historically high valuations (a ~22x forward year P/E multiple on the S&P 500) and uncertainties about the economic impacts of the broad tariff and tough deportation policies President Trump may impose are points of concern, while the expected robust and accelerating growth in overall S&P 500 earnings in 2025 and the likely constructive medium-term effects of President Trump’s promised deregulation policies, are the principal positive counterpoints. The stock market fell, but only by a modest amount, on February 3rd after President Trump announced sweeping tariffs against Mexico, Canada and China. However, later that day he put a decision on potential tariffs on Mexican and Canadian products on hold for 30 days after consulting with the leaders of America’s two biggest trading partners.
The most important factor of all these is likely accelerating earnings in 4Q 2024 and 2025. According to FactSet, 4Q 2024 earnings for the S&P 500 are expected to increase 12% in the just completed quarter, which would represent the fastest year-over-year quarterly growth rate in three years. While the stock market will doubtless be more volatile in 2025 than in 2024, it is difficult to foresee a notable market downturn against a backdrop of sharply rising earnings.
CHARTS & ANALYSIS
Direct Selling Capital Advisors Index
The DSCI is a market capitalization weighted index of all domestic public direct selling companies with a market capitalization of at least $25 million. The index is rebalanced monthly, and no single issue is permitted to represent more than 20% of its total value. In such an event, the excess weighting would be redistributed among the other index components.
The DSCI rose in January, and it outperformed the DJIA during the month. The DSCI gained 5.4% in January, outpacing the DJIA’s 4.7% increase in the month. DSCI data is tracked back to March 1, 2020. The direct selling index has risen 39.4% since that date versus a 75.3% appreciation for the DJIA over the same period.

Large Cap
Betterware de Mexico (NASDAQ: BWMX) inched 0.7% higher in January. Since the March 1, 2020 inception of the DSCI, BWMX has appreciated 19.6%.
In late October 2024, BWMX reported 3Q 2024 consolidated net revenue of 3.33 billion pesos, up 6.6% from 3.12 billion pesos in the year-ago period. BWMX’s adjusted EBITDA increased even more sharply in the quarter, reaching 592 million pesos, about 11.7% higher than the 529 million pesos in 3Q 2023. The company’s impressive quarter reflects the resilience of its core operations despite challenges which included exchange rate fluctuations and cost pressures such as freight costs.
BWMX projects that its 2024 revenue will be 13.8 to 14.4 billion pesos, up from 13.0 billion pesos in 2023, and its 2024 EBITDA will increase to about 2.9 billion pesos versus 2.72 billion pesos in 2023.
BWMX began trading in March 2020 after the company’s merger with SPAC sponsor DD3 Acquisition Corp. BWMX specifically targets the Mexican market; it serves three million households through distributors and associates in approximately 800 communities throughout Mexico.
Nu Skin Enterprises, Inc. (NYSE: NUS) fell 4.9% in January, adding to its 72.2% decline since the direct selling index was established in March 2020. In comparison, the direct selling stock index and the Dow Jones Industrial Average have gained 39.4% and 75.3%, respectively, over this nearly five-year period.
On January 13, 2025, NUS announced that its 4Q 2024 preliminary revenue will be at the high end of the $410 to $445 million revenue guidance the company provided on November 7, 2024. The company plans to release its 4Q 2024 financial results after the market closes on February 13, 2025.
In early January 2025, NUS’ Rhyz subsidiary sold its Mavely affiliate marketing technology platform to Later for approximately $250 million in cash and a minority equity stake in the combined Later/Mavely business. About $33 million of this consideration will be paid to other equity holders in the Mavely business. Later is a portfolio company of Summit Partners. Mavely is expected to continue to provide certain technology and social commerce capabilities to support NUS’ marketing business.
In November 2024, NUS reported 3Q 2024 revenue and adjusted EPS of $430.1 million and $0.17, both of which were down from $498.8 million and $0.56, respectively, in the year ago period. NUS continued to face macroeconomic pressure in 3Q 2024. Constructively, NUS’ Rhyz sales increased 20.9% in 3Q 2024 to $73.1 million versus 3Q 2023. Rhyz’s 3Q 2024 sales totaled about 17% of NUS’ overall sales in the quarter. In addition, NUS’ cost efficiency program saved the company $15 million in G&A expense in 3Q 2024.
Herbalife Nutrition, Inc. (NYSE: HLF) dropped 18.4% in January, its second consecutive double digit percentage monthly decline (minus 13.9% in December 2024). HLF is down 83.1% since the establishment of the DSCI on March 1, 2020, the worst long-term performance for any large-cap DSCI component which has traded continuously since index inception.
In late October, HLF reported 3Q 2024 sales of $1.24 billion, down 3.2% from $1.28 billion in 3Q 2023. More constructively, net sales in the quarter were nearly flat year-over-year on a constant currency basis, and HLF’s gross margin rose to 78.3% in 3Q 2024 from 76.3% in 3Q 2023 due to more favorable pricing and lower input costs. HLF’s 3Q 2024 adjusted EBITDA reached $166.5 million, up from $163.3 million in the year-ago period. In 3Q 2024, the number of new distributors joining HLF worldwide increased 14% year-over-year, representing the second consecutive quarter of year-over-year improvement.
HLF increased its full year 2024 adjusted EBITDA guidance to $590 to $620 million. In addition, HLF narrowed its estimate for full-year 2024 revenue growth to a range of negative 2.0% to negative 1.0% from the negative 3.5% to positive 1.5% range it issued in late July 2024. HLF plans to release its 4Q 2024 and full year 2024 financial results after the stock market closes on February 19, 2025.
Medifast, Inc. (NYSE: MED) shares declined 10.9% in January. MED is the second worst performing DSCI large cap member on a long-term basis; since the March 1, 2020 establishment of the DSCI, the stock has declined 80.2%.
In early November, MED reported 3Q 2024 revenue of $140.2 million, down 40% from $235.9 million in 3Q 2023. The company’s adjusted diluted EPS fell even more sharply to $0.35 in 3Q 2024 from $2.12 in the year ago period. The number of active earning OPTAVIA coaches decreased to 30,000 in 3Q 2024 from 47,100 in 3Q 2023. MED expects its 4Q 2024 revenue and adjusted diluted EPS will be $100-$120 million and a loss of $0.10 to a loss of $0.65, respectively. The company plans to release its 4Q 2024 financial results after the stock market closes on February 18, 2025.
MED is realigning its business to respond to the evolving dynamics in the weight loss industry and to transform its business model to meet the soaring demand for GLP-1 medications. Indeed, up to 20 million people in the US could be using GLP-1 treatments by 2030 according to some projections. MED offers comprehensive support for GLP-1 medication users, including access to clinicians through LifeMD, as well as programs and products to help maintain muscle and minimize side effects. One such product designed for people on GLP-1 medications is OPTAVIA ASCEND, a line of high-protein, fiber-rich mini meals, as well as a daily nutrient pack. MED announced OPTAVIA ASCEND on January 7, 2025.
In January, shares of USANA Health Sciences, Inc. (NYSE: USNA) lost 9.3%. Since the creation of the DSCI on March 1, 2020, USANA shares have lost 50.7% compared with gains of 39.4% and 75.3% for the direct selling index and the DJIA, respectively.
In late October, USANA reported 3Q 2024 revenue and diluted EPS of $200 million and $0.56, both down from $213 million and $0.59, respectively, in the year ago period. USANA’s 3Q 2024 operating results reflected ongoing top line headwinds across many of the company’s markets. Nevertheless, USANA generated $47 million of free cash flow over the first three quarters of 2024.
In its 3Q 2024 earnings report, USANA refined its forecast for 2024. It now expects revenue of $850 million, down slightly from its previous guidance range of $850 to $880 million. Also, management believes its 2024 EPS should be around $2.45. The company announce its 4Q 2024 financial results after the stock market closes on February 25, 2025.
On December 23, 2024, USANA closed its acquisition of a 78.8% controlling ownership stake in Hiya Health Products, LLC, a leading direct-to-consumer provider of high-quality children’s health and wellness products. The $205 million cash transaction is expected to be immediately accretive to USANA’s 2025 adjusted EBITDA. As of September 30, 2024, Hiya had more than 200,000 customers. For the twelve months ended September 30, 2024, Hiya generated net sales of $103 million, net income of $19 million, and adjusted EBITDA of $22 million.
On January 22, 2025, USANA announced Dr. Kathryn Armstrong, Ph.D., will assume the role of it chief scientific officer. She previously worked for Amway, BISSELL Homecare, Inc., and Whirlpool.
eXp World Holdings, Inc. (NASDAQ: EXPI) slipped 1.1% in January. EXPI shares have appreciated an aggregate 138.1% over the 59 months the DSCI has been computed, the second best long-term mark for any DSCI member.
In early November, EXPI, the fastest growing real estate brokerage in the world, reported 3Q 2024 revenue and adjusted EBITDA of $1.23 billion and $23.9 million, respectively. These measures compare favorably with $1.21 billion and $20.8 million, respectively, in 3Q 2023. EXPI increased its margins and profitability in 3Q 2024 despite a continued challenging market.
EXPI’s transaction volume in 3Q 2024 increased 5% to $50.8 billion from $48.4 billion in 3Q 2023. This performance is especially impressive given that US existing home sales in 2024 fell to their lowest level since 1995. Agents and brokers on EXPI’s platform totaled 85,249 as of September 30, 2024, down 4% from December 31, 2023, due primarily to the exit of unproductive agents.
A leading provider of financial services in the US and Canada, and by far the largest market cap stock in the DSCI, Primerica, Inc. (NYSE: PRI) jumped 6.9% in January, the second-best gain for any large cap DSCI component. PRI has appreciated 164.9% since March 1, 2020, the best long-term performance for any DSCI member.
In early November 2024, PRI reported 3Q 2024 adjusted operating revenue of $770.1 million, up 10% from $699.8 million in the year-ago period. The company’s adjusted operating EPS grew at a much faster pace (+31%), reaching $5.72 in 3Q 2024 versus $4.38 in 3Q 2023. Results in PRI’s Term Life segment benefitted from continued strong sales and stable margins. The company’s Investment and Savings Products unit were boosted by favorable equity market conditions in 3Q 2024 which fueled sales growth and higher client asset values. PRI plan to release its 4Q 2024 financial results after the stock market closes on February 11.
In mid-November, PRI’s Board authorized $450 million of share repurchases from mid-November 2024 through December 31, 2025. Over the first three quarters of 2024, the company repurchased $381 million of its own stock, including $129 million in 3Q 2024.
Nature’s Sunshine Products, Inc. (NASDAQ: NATR) lost 5.1% in January. Over the 59 months the DSCI has been calculated, NATR has gained 79.1%, the third best appreciation for any direct selling index stock over this period.
In early November, NATR, which markets and distributes nutritional and personal care products in more than 40 countries, reported 3Q 2024 net sales of $114.6 million, up 3% from $111.2 million in the year ago period. Adjusted EBITDA in 3Q 2024 totaled $10.7 million, about 5% higher than $10.3 million in 3Q 2023. NATR’s impressive results in 3Q 2024 were driven by robust customer growth in Japan and Taiwan, continued progress in South Korea, and customer activation in Central Europe.
Factoring in its solid results in 3Q 2024, NATR reset its full year 2024 net sales and adjusted EBITDA guidance slightly higher to $443-448 million and $40-42 million from previous ranges of $436-445 million and $39-42 million, respectively.
LifeVantage Corporation (NASDAQ: LFVN) soared 20.7% in January, marking its third consecutive month of outsized gains (+20.3% in December and +19.2% in November). Since the March 1, 2020 establishment of the DSCI, LFVN has gained 77.7%.
On February 5, 2025, LFVN reported 2Q FY 2025 (quarter ended December 31, 2024) revenue, adjusted EBITDA, and adjusted EPS of $67.8 million, $6.5 million, and $0.22, each of which dramatically increased from $51.6 million, $3.1 million, and $0.10, respectively, in the year ago period. Strong demand for LFVN’s MindBody GLP-1 System (see below) and impressive growth in active accounts drove the robust 2Q FY 2025 results. Notably, active accounts were up 25% in the quarter from 1Q FY 2025 levels, as the number of enrollments surged to the highest level in five years.
In turn, LFVN boosted its revenue, adjusted EBITDA, and adjusted EPS guidance ranges for FY 2025 (twelve months ending June 30, 2025) to $235-245 million, $21-24 million, and $0.72-0.88, respectively. The company’s previous guidance ranges were $200-210 million, $18-21 million, and $0.70-0.80, respectively. LFVN’s FY 2024 revenue totaled $200.2 million; its FY 2024 adjusted EBITDA was $17.0 million; and its FY 2024 adjusted EPS was $0.59.
In early October 2024, LFVN released groundbreaking human clinical trial results from its MindBody GLP-1 System. Participants realized a 140% average increase in GLP-1 levels in the body, leading to an average weight loss of nine pounds in eight weeks and up to 25 pounds in twelve weeks. The 12-week, 60-participant clinical trial began in early June.
Oliveda International, Inc. (OTC: OLVI), the third largest market cap stock in the DSCI, fell 45.0% in January, making it the worst performing DSCI component last month.
OLVI has more than 20 years of experience in: 1) the management and organic certification of mountain olive trees; 2) the extraction of international award-winning extra virgin olive oils; 3) the extraction of hydroxytyrosol, a substance which has several beneficial effects such as antioxidant, anti-inflammatory, anticancer, and as a protector of skin and eyes; and 4) the production and distribution of cosmetic and holistic waterless products related to the olive tree.
OLVI’s 3Q 2024 revenue was $27.7 million, up nearly 1,500% from $1.8 million in 3Q 2023. Its net loss in 3Q 2024 was $38.5 million, or a loss of $0.06 per share, compared with net income of $1.8 million in the year ago period. Over the first nine months of 2024, OLVI generated positive operating cash flow of $10.3 million versus a slight loss over the first nine months of 2023.
OLVI’s Olive Tree People Inc. subsidiary sales increased a remarkable 1,650+% in 4Q 2024, underscoring its position as the world’s fastest growing waterless beauty company. Olive Tree People, Inc. sales exceeded the $2 million daily sales mark for the first time in September 2024. On November 22, Olive Tree’s daily sales were more than $3.7 million.

 Note: For the purposes of this report, Direct Selling Capital considers companies with a market capitalization in excess of $1 billion “Large Cap.”
Small Cap
Our small cap tracking set performed about in line with the large cap DSCI group in January. Of the small caps with a market cap of more than $2 million, two rose during the month, and the same number declined.
The Beachbody Company, Inc. (NYSE: BODI), a leading fitness and nutrition company, rose 20.5% in January, the second best mark of any DSCI member with a market capitalization of more than $2 million. In 3Q 2024, BODI reported revenue and adjusted EBITDA of $102.2 million and $10.1 million versus $128.3 million and negative $5.8 million, respectively, in the year ago period.


Short Interest Data & Analysis
The following chart is an aggregate index of “days to cover” among the entire tracking set. Days to cover (DTC) is a measurement determined by dividing the total outstanding short interest by average daily trading volume.
 As indicated in the chart, short interest in DSCI stocks was 5.0 days in mid-January 2025, down from 5.3 days at year-end 2024, and level with 5.0 days in mid-December 2024. The biggest absolute reduction in DTC in mid-January 2025 from the end of December 2024 for a DSCI component was EXPI’s decrease to 19.9 days from 21.8 days.
Short interest can be a difficult indicator to analyze. On the one hand, an increase in short interest can be a bearish sign in that it indicates an increased view among investors that a stock is likely to decline based on any number of factors, such as a belief that the company’s fundamentals are deteriorating or that it has run too far, too fast. On the other hand, as a stock moves higher, a significant short interest can serve as extra fuel on the fire as investors scramble to “buy to cover” their short positions and mitigate losses.
Analyst Sentiment Index
Our Analyst Sentiment Index was unchanged in January 2025 from December 2024. The proportion of sell-side analysts maintaining “buy” and “hold” ratings on industry stocks in both months was about 96%. Conversely, the percentage of stocks which analysts recommended selling in each month was around 4%.

Methodology: The DSCA Analyst Sentiment Index is a consensus tracking tool that aggregates and averages the recommendations of all covering analysts across all public direct selling companies.
-
December 2024
Brought to you by Direct Selling Capital Advisors
Direct Selling Index Fell 9.7% in December, Marking Just its Second Monthly Decline of 2024
The Direct Selling Capital Advisors Direct Selling Index (DSCI) dropped 9.7% in December. The decline broke a four-month winning streak and represented only the second down month for the index in 2024. The Dow Jones Industrial Average (DJIA) fell last month as well, but by a smaller 5.3%, so it outperformed the DSCI in December. The DSCI gained 6.8% over the full-year 2024 versus the DJIA’s 12.9% gain.
Most large and small cap direct selling stocks declined in December. During the month, only one large cap rose (LifeVantage Corporation by 20.3%), while nine fell, five by double digit percentage points. Similarly, only one small cap with a market cap of more than $2 million gained, while three declined.
From a longer-term perspective, the DSCI has gained an aggregate 35.2% since its March 1, 2020 inception. The DJIA has outperformed the direct selling index over this period. Since March 1, 2020, the DJIA has appreciated 67.4%.
The Fed slightly increased its 2025 inflation forecast and pointed to just two rate cuts in 2025 when it announced its widely expected 25 basis point reduction in overnight interest rates on December 18th. That news in aggregate might be considered a little disappointing, but investors acted (for at least a short time) like it was the proverbial bell that many wish would have been rung at the top of the market. The three major indices dropped about 3% that day, and the DJIA finished 2024 at about that level.
The stock market faces at least three major challenges/concerns. First, after reeling off two consecutive 20+% years in 2023 and 2024, the S&P 500 cannot be considered cheap: it trades at about 22x forward-year earnings. Second, the broad tariffs proposed by President-elect Trump could reignite inflation in goods, a category which has actually been deflating for months. This of course could threaten whether even the Fed’s two projected rate cuts will be implemented in 2025. Inflation in services has been the key element of a sticky level of overall inflation in 2024. Third, bullish investors have shown worrisome signs of exhaustion. More stocks in the S&P 500 declined than advanced for 14 consecutive trading days through December 19th, a remarkably long streak.
Looking Forward
Direct selling stocks have announced their 3Q 2024 operating results and they will not begin to report their 4Q 2024 and full-year 2024 financials until late January. Consequently, the performance of DSCI stocks will likely be dictated by the performance of the overall stock market until then.
The stock market’s high valuation noted above, by itself, generally does not end bull markets. Most of the time, such ebullient periods draw to a close because inflation increases, which in turn causes interest rates to move higher. Neither condition can be considered to be in place today: the inflation rate is flat to trending slightly downward after CPI growth fell sharply through much of 2023 and the first half of 2024, though reaching the Fed’s 2% annual inflation target is by no means a sure bet. In addition, the ten-year Treasury yield of about 4.6%, while up from the Goldilocks days of 2021 (~1.5% yields) and up around 100 basis points just since mid-September, is still historically low.
Two other constructive factors include: 1) Bull markets tend to last a long time, 46 months on average, per JP Morgan, and the current bull market has been running for only about 27 months. Moreover, the median aggregate return during bull markets is about 110%, about twice the gain of the S&P 500 since the lows of October 2022.
2) Bullish market observers reiterate almost daily that innovation led by the rise in use of AI is driving profit growth in US businesses and that AI and automation represent the fourth industrial revolution, which will dramatically improve the way people live and work. While it seems easy to theorize such soaring rhetoric overstates AI’s potential, the new technology’s effect could well be enormous. IDC, the widely followed technology market intelligence firm, expects AI to increase the world’s aggregate economic output through 2030 by $20 trillion. To put that figure into perspective, the world’s 2024 GDP was around $104 trillion, per Trading Economics.
CHARTS & ANALYSIS
Direct Selling Capital Advisors Index
The DSCI is a market capitalization weighted index of all domestic public direct selling companies with a market capitalization of at least $25 million. The index is rebalanced monthly, and no single issue is permitted to represent more than 20% of its total value. In such an event, the excess weighting would be redistributed among the other index components.
The DSCI fell in December, and it underperformed the DJIA during the month. The DSCI lost 9.7% in December, while the DJIA dropped 5.3%. DSCI data is tracked back to March 1, 2020. The direct selling index has risen 35.2% since that date versus a 67.4% appreciation for the DJIA over the same period.

Large Cap
Betterware de Mexico (NASDAQ: BWMX) fell 11.4% in November, adding to its full year 2024 loss of 19.8%. More positively, since the March 1, 2020 DSCI inception, BWMX is up 18.7%.
In late October, BWMX reported 3Q 2024 consolidated net revenue of 3.33 billion pesos, up 6.6% from 3.12 billion pesos in the year-ago period. BWMX’s adjusted EBITDA increased even more sharply in the quarter, reaching 592 million pesos, about 11.7% higher than the 529 million pesos in 3Q 2023. The company’s impressive quarter reflects the resilience of its core operations despite challenges which included exchange rate fluctuations and cost pressures, such as freight costs.
BWMX projects that its 2024 revenue will be 13.8 to 14.4 billion pesos, up from 13.0 billion pesos in 2023, and its 2024 EBITDA will increase to about 2.9 billion pesos versus 2.721 billion pesos in 2023.
BWMX began trading in March 2020 after the company’s merger with SPAC sponsor DD3 Acquisition Corp. BWMX specifically targets the Mexican market; it serves three million households through distributors and associates in approximately 800 communities throughout Mexico.
Nu Skin Enterprises, Inc. (NYSE: NUS) dropped 5.6% in December. In 2024, NUS fell 64.5%, the second worst mark last year for any large cap direct selling stock. Since the March 2020 establishment of the DSCI, NUS has declined 70.8%. In comparison, the direct selling stock index and the Dow Jones Industrial Average have gained 35.2% and 67.4%, respectively, over this 58-month period.
On January 3, 2025, NU’s Rhyz subsidiary sold its Mavely affiliate marketing technology platform to Later for approximately $250 million in cash and a minority equity stake in the combined Later/Mavely business. About $33 million of this consideration will be paid to other equity holders in the Mavely business. Later is a portfolio company of Summit Partners. Mavely is expected to continue to provide certain technology and social commerce capabilities to support NUS’ marketing business.
In early November 2024, NUS reported 3Q 2024 revenue and adjusted EPS of $430.1 million and $0.17, both of which were down from $498.8 million and $0.56, respectively, in the year-ago period. NUS continued to face macroeconomic pressure in 3Q 2024. NUS’s immediate focus is to strengthen its core business with a revised business model intended especially to improve channel activation and customer growth in North America and South Korea.
Constructively, Rhyz sales increased 20.9% in 3Q 2024 to $73.1 million versus 3Q 2023. Rhyz’s 3Q 2024 sales totaled about 17% of NUS’ overall sales in the quarter. In addition, NUS’ cost efficiency program saved the company $15 million in G&A expense in 3Q 2024, and the company is on track to reach $45 to $65 million of G&A savings in 2024.
Given ongoing pressures in its core business, NUS reduced its revenue and non-GAAP EPS guidance ranges for full-year 2024 to $1.70-$1.73 billion and $0.65-$0.75, respectively. The comparable figures for full-year 2023 were $1.97 billion and $1.85, respectively.
Herbalife Nutrition, Inc. (NYSE: HLF) dropped 13.9% in December, bringing its 2024 loss to 56.2%. HLF is down 79.3% since the establishment of the DSCI on March 1, 2020, the worst long-term performance for any large-cap DSCI component which has traded continuously since index inception.
In late October, HLF reported 3Q 2024 sales of $1.24 billion, down 3.2% from $1.28 billion in 3Q 2023. More constructively, net sales in the quarter were nearly flat year-over-year on a constant currency basis, and HLF’s gross margin rose to 78.3% in 3Q 2024 from 76.3% in 3Q 2023 due to more favorable pricing and lower input costs. HLF’s 3Q 2024 adjusted EBITDA reached $166.5 million, up from $163.3 million in the year-ago period.
In 3Q 2024, the number of new distributors joining HLF worldwide increased 14% year-over-year, representing the second consecutive quarter of year-over-year improvement. In addition, CFO John DeSimone reaffirmed HLF’s plans to reduce total debt by $1 billion over the next four to five years.
HLF increased its full-year 2024 adjusted EBITDA guidance to $590 to $620 million. In addition, HLF narrowed its estimate of full-year 2024 revenue growth to a range of negative 2.0% to negative 1.0% from the negative 3.5% to positive 1.5% range it issued in late July 2024. HLF plans to release its 4Q 2024 and full-year 2024 financial results after the stock market closes on February 19, 2025.
Medifast, Inc. (NYSE: MED) shares dropped 10.4% in December, adding to its 73.8% loss in 2024, the worst mark for any large cap DSCI component. MED is the second worst performing DSCI large cap member on a long-term basis; since the March 1, 2020 establishment of the DSCI, the stock has declined 77.8%.
In early November, MED reported 3Q 2024 revenue of $140.2 million, down 40% from $235.9 million in 3Q 2023. The company’s
adjusted diluted EPS fell even more sharply to $0.35 in 3Q 2024 from $2.12 in the year-ago period. The number of active earning OPTAVIA coaches decreased to 30,000 in 3Q 2024 from 47,100 in 3Q 2023. MED expects its 4Q 2024 revenue and adjusted diluted EPS will be $100-$120 million and a loss of $0.10 to a loss of $0.65, respectively.
MED is realigning its business to respond to the evolving dynamics in the weight loss industry, and to transform its business model to meet the soaring demand for GLP-1 medications. Indeed, up to 20 million people in the U.S. could be using GLP-1 treatments by 2030, according to some projections. MED offers comprehensive support for GLP-1 medication users, including access to clinicians through LifeMD, as well as programs and products to help maintain muscle and minimize side effects.
In December, shares of USANA Health Sciences, Inc. (NYSE: USNA) lost 6.9%. In the full year 2024, USANA fell 33.0%. Since the creation of the DSCI on March 1, 2020, USANA shares have lost 45.7% compared with gains of 35.2% and 67.4% for the direct selling index and the DJIA, respectively.
In late October, USANA reported 3Q 2024 revenue and diluted EPS of $200 million and $0.56, both down from $213 million and $0.59, respectively, in the year ago period. USANA’s 3Q 2024 operating results reflected ongoing top line headwinds across many of the company’s markets. USANA’s sales force continued to face challenges in attracting new customers as consumer sentiment remained cautious, including in the company’s largest market, China. Nevertheless, USANA has generated $47 million of free cash flow over the first three quarters of 2024.
In its 3Q 2024 earnings report, USANA refined its forecast for 2024. It now expects revenue of $850 million, down slightly from its previous guidance range of $850 to $880 million. Also, management believes its 2024 EPS should be $2.45; USANA had guided to 2024 EPS of $2.40 to $2.55 in its 2Q 2024 earnings release.
On December 23, 2024, USANA closed its acquisition of a 78.8% controlling ownership stake in Hiya Health Products, LLC, a leading direct-to-consumer provider of high-quality children’s health and wellness products. The $205 million cash transaction is expected to be immediately accretive to USANA’s 2025 adjusted EBITDA. As of September 30, 2024, Hiya had more than 200,000 customers. For the twelve months ended September 30, 2024, Hiya generated net sales of $103 million, net income of $19 million, and adjusted EBITDA of $22 million
eXp World Holdings, Inc. (NASDAQ: EXPI) fell 16.9% in December, the worst monthly performance of any large cap DSCI component. In 2024, EXPI lost 25.8%. EXPI shares have appreciated an aggregate 140.8% over the 58 months the DSCI has been computed, the second best long-term mark for any DSCI member.
In early November, EXPI, the fastest growing real estate brokerage in the world, reported 3Q 2024 revenue and adjusted EBITDA of $1.23 billion and $23.9 million, respectively. These measures compared favorably with $1.21 billion and $20.8 million, respectively, in 3Q 2023. EXPI increased its margins and profitability in 3Q 2024 despite a continued challenging market.
EXPI’s transaction volume in 3Q 2024 increased 5% to $50.8 billion from $48.4 billion in 3Q 2023. Agents and brokers on the company’s platform totaled 85,249 as of September 30, 2024, down 4% from December 31, 2023, due primarily to the exit of unproductive agents.
A leading provider of financial services in the US and Canada, and by far the largest market cap stock in the DSCI, Primerica, Inc. (NYSE: PRI) dropped 10.3% in December. In the full year 2024, PRI gained 31.9%, the second-best annual return for any large cap DSCI component. PRI has appreciated 147.7% since March 1, 2020, the best long-term performance for any DSCI member.
In early November, PRI reported 3Q 2024 adjusted operating revenue of $770.1 million, up 10% from $699.8 million in the year-ago period. The company’s adjusted operating EPS grew at a much faster pace (+31%), reaching $5.72 in 3Q 2024 versus $4.38 in 3Q 2023. Results in PRI’s Term Life segment benefitted from continued strong sales and stable margins. The company’s Investment and Savings Products unit were boosted by favorable equity market conditions in 3Q 2024 which fueled sales growth and higher client asset values.
In mid-November, PRI’s Board authorized $450 million of share repurchases from mid-November 2024 through December 31, 2025. Over the first three quarters of 2024, the company repurchased $381 million of its own stock, including $129 million in 3Q 2024.
Nature’s Sunshine Products, Inc. (NASDAQ: NATR) lost 9.7% in December, which brought its 2024 loss to 15.2%. Over the 58 months the DSCI has been calculated, NATR has gained 88.8%, the third best appreciation for any direct selling index stock over this period.
In early November, NATR, which markets and distributes nutritional and personal care products in more than 40 countries, reported 3Q 2024 net sales of $114.6 million, up 3% from $111.2 million in the year-ago period. Adjusted EBITDA in 3Q 2024 totaled $10.7 million, about 5% higher than $10.3 million in 3Q 2023. NATR’s impressive results in 3Q 2024 were driven by robust customer growth in Japan and Taiwan, continued progress in South Korea, and customer activation in Central Europe.
Factoring in its solid results in 3Q 2024, NATR reset its full-year 2024 net sales and adjusted EBITDA guidance slightly higher to $443-$448 million and $40-$42 million from previous ranges of $436-$445 million and $39-$42 million, respectively.
LifeVantage Corporation (NASDAQ: LFVN) jumped 20.3% in December, marking its second consecutive month of outsized gains (+19.2% in November). This performance pushed LFVN’s 2024 gain
to 192.2%, by far the biggest increase for any direct selling stock. Since the March 1, 2020 establishment of the DSCI, LFVN has gained 47.2%.
In early October, LFVN released groundbreaking human clinical trial results from its MindBody GLP-1 System. Participants realized a 140% average increase in GLP-1 levels in the body, leading to an average weight loss of nine pounds in eight weeks and up to 25 pounds in twelve weeks. The 12-week, 60-participant clinical trial began in early June.
In late October, LFVN reported revenue of $47.2 million in 1Q FY 2025 (quarter ended September 30, 2024), down 8.1% from $51.4 million in the year-ago period. LFVN’s adjusted EBITDA was $4.4 million in 1Q FY 2025, up from $4.0 million in 1Q FY 2024. LFVN continues to focus on optimizing its cost structure while being strategic with its investments in growth and innovation.
LFVN maintained its revenue and adjusted EBITDA guidance ranges for FY 2025 (twelve months ending June 30, 2025) of $200-$210 million and $18-$21 million, respectively. The company’s FY 2024 revenue totaled $200.2 million, and its FY 2024 adjusted EBITDA was $17.0 million.
Oliveda International, Inc. (OTC: OLVI), the third largest market cap stock in the DSCI, dropped 5.3% in December, making it the second best performing large cap DSCI component last month.
OLVI has more than 20 years of experience in: 1) the management and organic certification of mountain olive trees; 2) the extraction of international award-winning extra virgin olive oils; 3) the extraction of hydroxytyrosol, a substance which has several beneficial effects such as antioxidant, anti-inflammatory, anticancer, and as a protector of skin and eyes; and 4) the production of and distribution of cosmetic and holistic waterless products related to the olive tree.
OLVI’s 3Q 2024 revenue was $27.7 million, up nearly 1,500% from $1.8 million in 3Q 2023. Its net loss in 3Q 2024 was $38.5 million, or a loss of $0.06 per share, compared with net income of $1.8 million in the year-ago period. Over the first nine months of 2024, OLVI generated positive operating cash flow of $10.3 million versus a slight loss over the first nine months of 2023.
OLVI’s Olive Tree People Inc. subsidiary exceed the $2 million daily sales mark for the first time in September 2024. On November 22, Olive Tree’s daily sales exceeded $3.7 million.

 Note: For the purposes of this report, Direct Selling Capital considers companies with a market capitalization in excess of $1 billion “Large Cap.”
Small Cap
Our small cap tracking set performed about in line with the large cap DSCI group in December. Of the small caps with a market cap of more than $2 million, one rose during the month, and three fell.
Mannatech, Incorporated (NASDAQ: MTEX), a global health and wellness company, was the best performer of any DSCI member in December (+58.0%). This follows MTEX’s strong November performance when it gained 8.7%, the largest increase in that month for any DSCI small cap member with a market value of at least $1 million. For the full year 2024, MTEX stock soared 65.8%. In mid-November, MTEX reported 3Q 2024 revenue and EPS of $31.7 million and a $0.17 loss versus $32.6 million and positive $0.01, respectively, in the year-ago period.


Short Interest Data & Analysis
The following chart is an aggregate index of “days to cover” among the entire tracking set. Days to cover (DTC) is a measurement determined by dividing the total outstanding short interest by average daily trading volume.
 As indicated in the chart, short interest in DSCI stocks was 5.0 days in mid-December, the fewest number of days since mid-April, and down from 5.3 days at both the end of November and in mid-November. The biggest absolute reduction in DTC in mid-December from the end of November for a DSCI component was EXPI’s decrease to 20.9 days from 23.4 days.
Short interest can be a difficult indicator to analyze. On the one hand, an increase in short interest can be a bearish sign in that it indicates an increased view among investors that a stock is likely to decline based on any number of factors, such as a belief that the company’s fundamentals are deteriorating or that it has run too far, too fast. On the other hand, as a stock moves higher, a significant short interest can serve as extra fuel on the fire as investors scramble to “buy to cover” their short positions and mitigate losses.
Analyst Sentiment Index
Our Analyst Sentiment Index rose significantly in December from November. The proportion of sell-side analysts maintaining “buy” and “hold” ratings on industry stocks in December was about 96%, up from 92% in November. Conversely, the percentage of stocks which analysts recommended selling was around 4% in December and 8% in November.
 Methodology: The DSCA Analyst Sentiment Index is a consensus tracking tool that aggregates and averages the recommendations of all covering analysts across all public direct selling companies.
 -
November 2024
Brought to you by Direct Selling Capital Advisors
Direct Selling Index Soared 6.7% in November; Index Has Posted Monthly Gains in 12 of the Last 13 Months
In November, the Direct Selling Capital Advisors Direct Selling Index (DSCI) jumped 6.7%. This marked the index’s fourth successive monthly gain and the index’s twelfth increase in the last thirteen months. Nevertheless, the DSCI slightly underperformed the Dow Jones Industrial Average (DJIA) in November as the DJIA added 7.5% during the month. The DSCI and DJIA have increased by similar percentages over the first eleven months of 2024: +18.3% and +19.2%, respectively.
Large cap direct selling stocks as a group markedly outperformed their smaller cap peers in November. During the month, eight large cap members rose, three by more than 10%, while only two declined, including one by double digit percentage points. On the other hand, three small cap members rose during November, and the same number declined. Only one small cap with a market cap of more than $5 million moved by double digit percentage points in November, a 10.3% decline by Educational Development Corporation.
From a longer-term perspective, the DSCI has gained an aggregate 49.7% since its March 1, 2020 inception. The DJIA has outperformed the direct selling index over this period. Since March 1, 2020, the DJIA has appreciated 76.7%.
The DJIA’s 7.5% increase in November was by far the benchmark index’s best monthly gain of 2024. The market soared on President-elect Trump’s election win in a broad rally as investors embraced the business-friendly incoming Administration and were relieved that a prolonged battle over the election result was avoided. The DJIA subsequently retraced some of its election rally gains before recommencing its rally on November 18th, an upturn which has continued into early December. Indeed, all major stock market indices are currently at or near all-time highs. The market’s brief decline in mid-November seemed to stem from uncertainty about the details and the potential impact of President-elect Trump’s tariff plans, as well as fears that Department of Health and Human Services-nominee RFK Jr. could negatively impact the healthcare sector.
The best performing sectors in November were small caps, consumer discretionary stocks, banks, and industrial. The strong performance of the these first two categories augurs well for direct selling stocks.
Looking Forward
Direct selling stocks have announced their 3Q 2024 operating results and they will not begin to report their 4Q 2024 and full-year 2024 financials until late January. Consequently, the performance of DSCI stocks will likely be dictated by the performance of the overall stock market until then. This linkage could be constructive as investors seem less focused on stock market valuation parameters which are well above historical averages and are more centered on the robust economy. Indeed, the current key economic barometers of GDP growth (2.8% year-over-year in 3Q 2024), low unemployment (a 4.1% rate), and acceptably low inflation (3.3% core year-over-year CPI growth in October) would individually be considered constructive. They are even more powerful since they are present in unison.
Another positive factor which is infrequently discussed by equity investors is the extraordinarily tight spreads in the corporate bond market. More specifically, the spreads on both investment grade and junk bonds are at their tightest levels in at least ten years. It would be highly unusual for stocks to correct when bond investors see little near- and medium-term risk in the overall economy.
CHARTS & ANALYSIS
Direct Selling Capital Advisors Index
The DSCI is a market capitalization weighted index of all domestic public direct selling companies with a market capitalization of at least $25 million. The index is rebalanced monthly, and no single issue is permitted to represent more than 20% of its total value. In such an event, the excess weighting would be redistributed among the other index components.
The DSCI rose in November, though it slightly underperformed the DJIA during the month. The DSCI gained 6.7% in November, about 80 basis points less than the 7.5% increase for the DJIA. DSCI data is tracked back to March 1, 2020. The direct selling index has risen 49.7% since that date versus a 76.7% appreciation of the DJIA over the same period.

Large Cap
Betterware de Mexico (NASDAQ: BWMX) dropped 0.6% in November, bringing its YTD loss to 9.5%. More constructively, since the March 1, 2020 DSCI inception, BWMX is up 34.0%.
In late October, BWMX reported 3Q 2024 consolidated net revenue of 3.33 billion pesos, up 6.6% from 3.12 billion pesos in the year-ago period. BWMX’s adjusted EBITDA increased even more sharply in the quarter, reaching 592 million pesos, about 11.7% higher than the 529 million pesos in 3Q 2023. The company’s impressive quarter reflects the resilience of its core operations despite challenges which included exchange rate fluctuations and cost pressures, such as freight costs.
BWMX continues to project that 1) its 2024 revenue will be 13.8 to 14.4 billion pesos, up from 13.0 billion pesos in 2023; and 2) its 2024 EBITDA will increase to 2.9-3.1 billion pesos versus 2.721 billion pesos last year, though the company now believes its 2024 EBITDA will likely come in at the lower end of this range.
BWMX began trading in March 2020 after the company’s merger with SPAC sponsor DD3 Acquisition Corp. BWMX specifically targets the Mexican market; it serves three million households through distributors and associates in approximately 800 communities throughout Mexico.
Nu Skin Enterprises, Inc. (NYSE: NUS) jumped 17.9% in November, ending a two-month streak when it declined by double digit percentage points in each month (-16.0% in October and -17.5% in September). Nevertheless, on a YTD basis, NUS is still down 62.4%, the second worst mark for any large cap direct selling stock. Since the March 2020 establishment of the DSCI, NUS has lost 69.1%. In comparison, the direct selling stock index and the Dow Jones Industrial Average have gained 49.7% and 76.7%, respectively, over this 57-month period.
On November 7, NUS reported 3Q 2024 revenue and adjusted EPS of $430.1 million and $0.17, both of which were down from $498.8 million and $0.56, respectively, in the year-ago period. NUS continued to face macroeconomic pressure in 3Q 2024. NUS’s immediate focus is to strengthen its core business with a revised business model intended especially to improve channel activation and customer growth in North America and South Korea.
Constructively, the company’s Rhyz sales increased 20.9% in 3Q 2024 to $73.1 million versus 3Q 2023. Rhyz’s 2Q 2024 sales totaled about 17% of NUS’s overall sales in the quarter. In addition, NUS’s cost efficiency program saved the company $15 million in G&A expense in 3Q 2024, and the company is on track to reach $45 to $65 million of G&A savings in 2024.
Given ongoing pressures in its core business, NUS reduced its revenue and non-GAAP EPS guidance ranges for full year 2024 to $1.70-$1.73 billion and $0.65-$0.75 from $1.73-$1.81 billion and $0.75-$0.95, respectively. The comparable figures for full year 2023 were $1.97 billion and $1.85, respectively.
Herbalife Nutrition, Inc. (NYSE: HLF) increased 2.9% in November. This gain cut its YTD loss to 49.1%. HLF is down 76.0% since the establishment of the DSCI on March 1, 2020, the worst performance for any large-cap DSCI component which has traded continuously since index inception.
In late October, HLF reported 3Q 2024 sales of $1.24 billion, down 3.2% from $1.28 billion in 3Q 2023. More constructively, net sales in the quarter were nearly flat year-over-year on a constant currency basis, and HLF’s gross margin rose to 78.3% in 3Q 2024 from 76.3% in 3Q 2023 due to more favorable pricing and lower input costs. HLF’s 3Q 2024 adjusted EBITDA reached $166.5 million, up from $163.3 million in the year-ago period.
In 3Q 2024, the number of new distributors joining HLF worldwide increased 14% year-over-year, representing the second consecutive quarter of year-over-year improvement. In addition, CFO John DeSimone reaffirmed HLF’s plans to reduce total debt by $1 billion over the next four to five years. This initiative will be the primary use of the company’s free cash flow through the balance of the decade.
HLF increased its full-year 2024 adjusted EBITDA guidance to $590 to $620 million, up from $560 to $600 million. In addition, HLF narrowed its estimate of full-year 2024 revenue growth to a range of negative 2.0% to negative 1.0% from the negative 3.5% to positive 1.5% range it issued in late July.
Medifast, Inc. (NYSE: MED) shares jumped 7.0% in November, cutting its YTD loss to 70.7%, the worst mark of any large cap DSCI component. MED is the second worst performing DSCI large cap member on a long-term basis; since the March 1, 2020 establishment of the DSCI, the stock has declined 75.3%.
In early November, MED reported 3Q 2024 revenue of $140.2 million, down 40% from $235.9 million in 3Q 2023. The company’s adjusted diluted EPS fell even more sharply to $0.35 in 3Q 2024 from $2.12 in the year-ago period. The number of active earning OPTAVIA coaches decreased to 30,000 in 3Q 2024 from 47,100 in 3Q 2023. MED expects its 4Q 2024 revenue and adjusted diluted EPS will be $100-$120 million and a loss of $0.10 to a loss of $0.65, respectively.
MED is realigning its business to respond to the evolving dynamics in the weight loss industry, and to transform its business model to meet the soaring demand for GLP-1 medications. Indeed, up to 20 million people in the US could be using GLP-1 treatments by 2030, according to some projections. MED offers comprehensive support for GLP-1 medication users, including access to clinicians through LifeMD, as well as programs and products to help maintain muscle and minimize side effects.
In November, shares of USANA Health Sciences, Inc. (NYSE: USNA) added 4.3%, slicing its YTD loss to 28.1%. Since the creation of the DSCI on March 1, 2020, USANA shares have lost 41.7% compared with gains of 49.7% and 76.7% for the direct selling index and the DJIA, respectively.
In late October, USANA reported 3Q 2024 and diluted EPS of $200 million and $0.56, both down from $213 million and $0.59, respectively, in the year ago period. USANA’s 3Q 2024 operating results reflected ongoing top line headwinds across many of the company’s markets. USANA’s sales force continued to face challenges in attracting new customers as consumer sentiment remained cautious, including in the company’s largest market, China. Nevertheless, USANA has generated $47 million of free cash flow over the first three quarters of 2024.
In its 3Q 2024 earnings report, USANA refined its forecast for 2024. It now expects revenue of $850 million, down slightly from its previous guidance range of $850 to $880 million. Also, management believes its 2024 EPS should be $2.45; USANA had guided to 2024 EPS of $2.40 to $2.55 in its 2Q 2024 earnings release.
eXp World Holdings, Inc. (NASDAQ: EXPI) increased 4.0% in November, though it has declined 10.8% YTD. EXPI shares have appreciated an aggregate 189.7% over the 57 months the DSCI has been computed, the best long-term mark for any DSCI member.
On November 7, EXPI, the fastest growing real estate brokerage in the world, reported 3Q 2024 revenue and adjusted EBITDA of $1.23 billion and $23.9 million, respectively. These measures compared favorably with $1.21 billion and $20.8 million, respectively, in 3Q 2023. EXPI increased its margins and profitability in 3Q 2024 despite a continued challenging market.
EXPI’s transaction volume in 3Q 2024 increased 5% to $50.8 billion from $48.4 billion in 3Q 2023. Agents and brokers on the company’s platform totaled 85,249 as of September 30, 2024, down 4% from December 31, 2023, due primarily to the exit of unproductive agents.
A leading provider of financial services in the US and Canada, and by far the largest market cap stock in the DSCI, Primerica, Inc. (NYSE: PRI) jumped 9.4% in November. Year to date, PRI has gained 47.1%, the second-best return for any large cap DSCI component. PRI has appreciated 176.3% since March 1, 2020, the second best long-term performance for any DSCI member.
In early November, PRI reported 3Q 2024 adjusted operating revenue of $770.1 million, up 10% from $699.8 million in the year-ago period. The company’s adjusted operating EPS grew at a much faster pace (+31%), reaching $5.72 in 3Q 2024 versus $4.38 in 3Q 2023. Results in PRI’s Term Life segment benefitted from continued strong sales and stable margins. The company’s Investment and Savings Products unit was boosted by favorable equity market conditions in 3Q 2024 which fueled sales growth and higher client asset values.
On November 14, PRI’s Board authorized $450 million of share repurchases from mid-November 2024 through December 31, 2025. Over the first three quarters of 2024, the company repurchased $381 million of its own stock, including $129 million in 3Q 2024.
In August 2024, PRI increased its quarterly dividend to $0.90 per share ($3.60 annualized) from $0.75 per share ($3.00 annualized). The next $0.90 dividend payable date is December 12th. Since 2018, PRI had announced an increase in its dividend once a year in February, so this accelerated dividend increase action by PRI’s Board represents a significant vote of confidence in the company’s prospects.
Nature’s Sunshine Products, Inc. (NASDAQ: NATR) soared 28.3% in November, the sharpest monthly gain for any large cap DSCI component. This outsized move cut NATR’s YTD loss to 6.1%. Over the 57 months the DSCI has been calculated, NATR has gained 109.1%, the third best mark for any direct selling index stock over that period.
On November 7, NATR, which markets and distributes nutritional and personal care products in more than 40 countries, reported 3Q 2024 net sales of $114.6 million, up 3% from $111.2 million in the year-ago period. Adjusted EBITDA in 3Q 2024 totaled $10.7 million, about 5% higher than $10.3 million in 3Q 2023. NATR’s impressive results in 3Q 2024 were driven by robust customer growth in Japan and Taiwan, continued progress in South Korea, and customer activation in Central Europe.
Factoring in its solid results in 3Q 2024, NATR reset its full-year 2024 net sales and adjusted EBITDA guidance to $443-$448 million and $40-$42 million from its previous ranges of $436-$445 million and $39-$42 million, respectively.
LifeVantage Corporation (NASDAQ: LFVN) shot 19.2% higher in November, the second best mark for any DSCI big cap member. This performance in turn pushed LFVN’s YTD gain to 142.8%, by far the biggest increase for any direct selling stock. Since the March 1, 2020 establishment of the DSCI, LFVN has gained 22.3%.
In early October, LFVN released groundbreaking human clinical trial results from its MindBody GLP-1 System. Participants realized a 140% average increase in GLP-1 levels in the body, leading to an average weight loss of nine pounds in eight weeks and up to 25 pounds in twelve weeks. The 12-week, 60-participant clinical trial began in early June.
In late October, LFVN reported revenue of $47.2 million in 1Q FY 2025 (quarter ended September 30, 2024), down 8.1% from $51.4 million in the year-ago period. LFVN’s adjusted EBITDA was $4.4 million in 1Q FY 2025, up from $4.0 million in 1Q FY 2024. LFVN continues to focus on optimizing its cost structure while being strategic with its investments in growth and innovation.
LFVN maintained its revenue and adjusted EBITDA guidance ranges for FY 2025 (twelve months ending June 30, 2025) of $200-$210 million and $18-$21 million, respectively. The company’s FY 2024 revenue totaled $200.2 million, and its FY 2024 adjusted EBITDA was $17.0 million.
Oliveda International, Inc. (OTC: OLVI), the third largest market cap stock in the DSCI, dropped 31.2% in November, the sharpest decline for a large cap DSCI component last month.
OLVI has more than 20 years of experience in: 1) the management and organic certification of mountain olive trees; 2) the extraction of international award-winning extra virgin olive oils; 3) the extraction of hydroxytyrosol, a substance which has several beneficial effects such as antioxidant, anti-inflammatory, anticancer and as a protector of skin and eyes; and 4) the production of and distribution of cosmetic and holistic waterless products related to the olive tree.
OLVI’s 3Q 2024 revenue was $27.7 million, up nearly 1,500% from $1.8 million in 3Q 2023. Its net loss in 3Q 2024 was $38.5 million, or a loss of $0.06 per share, compared with net income of $1.8 million in the year-ago period. Over the first nine months of 2024, OLVI generated positive operating cash flow of $10.3 million versus a slight loss over the first nine months of 2023.


Note: For the purposes of this report, Direct Selling Capital considers companies with a market capitalization in excess of $1 billion “Large Cap.”
Small Cap
Our small cap tracking set underperformed the large cap DSCI group in November. Three small caps rose during the month, and three fell.
Mannatech, Incorporated (NASDAQ: MTEX), a global health and wellness company, posted the best performance in November (+8.7%) of any DSCI small cap member with a market value of at least $1 million. This appreciation flipped MTEX stock from a small YTD loss through October to a 4.9% gain over the first eleven months of 2024. On November 12, MTEX reported 3Q 2024 revenue and EPS of $31.7 million and a $0.17 loss versus $32.6 million and positive $0.01, respectively, in the year-ago period.


Short Interest Data & Analysis
The following chart is an aggregate index of “days to cover” among the entire tracking set. Days to cover (DTC) is a measurement determined by dividing the total outstanding short interest by average daily trading volume.
 As indicated in the chart, short interest in DSCI stocks was 5.3 days in mid-November, the fewest number of days since the end of June and down markedly from 6.7 days at the end of October and 7.0 days in mid-October. The biggest absolute reduction in DTC in mid-November from the end of October for a DSCI component was HLF’s decrease to 5.1 days from 6.6 days.
Short interest can be a difficult indicator to analyze. On the one hand, an increase in short interest can be a bearish sign in that it indicates an increased view among investors that a stock is likely to decline based on any number of factors, such as a belief that the company’s fundamentals are deteriorating or that it has run too far, too fast. On the other hand, as a stock moves higher, a significant short interest can serve as extra fuel on the fire as investors scramble to “buy to cover” their short positions and mitigate losses.
Analyst Sentiment Index
Our Analyst Sentiment Index rose significantly in November from October. The proportion of sell-side analysts maintaining “buy” and “hold” ratings on industry stocks in November was about 96%, up from 87% in October. Conversely, the percentage of stocks which analysts recommended selling was around 4% in November and 13% in October.
 Methodology: The DSCA Analyst Sentiment Index is a consensus tracking tool that aggregates and averages the recommendations of all covering analysts across all public direct selling companies.
 -
October 2024
Brought to you by Direct Selling Capital Advisors
Direct Selling Index Popped 3.2% in October; Index Markedly Outperformed DJIA During the Month
In October, the Direct Selling Capital Advisors Direct Selling Index (DSCI) rose 3.2%, its third consecutive monthly gain and the index’s eleventh increase in the last twelve months. The DSCI notably outperformed the Dow Jones Industrials Average (DJIA) in October, as the DJIA lost 1.3% during the month. The divergent movements of the DSCI and DJIA during October left each index up by the same amount, 10.8%, over the first ten months of 2024.
Large cap direct selling stocks as a group performed about in line with their smaller cap peers in October. Four large cap members rose, while five declined, one by more than 10%. On the other hand, four small cap members rose during the month and three declined. Only one small cap with a market cap of more than $5 million moved by double digit percentage points in October (a 12.8% decline by Educational Development Corporation).
From a longer-term perspective, the DSCI has gained an aggregate 40.3% since its March 1, 2020 inception. The DJIA has outperformed the direct selling index over this period. Since March 1, 2020, the DJIA has increased 64.4%.
Stocks fell in the last two trading days of October, tipping the major indices from small gains in the month to modest losses. Nevertheless, investors remain attentive to the continued expansion of corporate earnings, particularly among the biggest tech stocks and easier monetary policy. Indeed, US GDP grew at an impressive 2.8% annual rate in 3Q 2024, which followed solid 3.0% growth in 2Q 2024. These results point to an economy in far better shape than a “soft landing,” which seemed to be the best case aspiration just a few months ago.
Furthermore, the market has been willing to look past some disappointing data (such as the hot September 2024 core inflation reading in the CPI report released on October 10th) that could have dampened sentiment during less enthusiastic times and instead focus on more stock-friendly statistics like improving retail sales and jobless claims. Two new and perhaps relatively surprising factors likewise supported stocks: the promise of a Chinese stimulus program and falling crude oil prices. The latter may be counterintuitive given the ongoing hostilities in the Middle East. Crude oil is feeling the effects of weak refinery demand in China and lower than expected fuel consumption in that country due at least partly to the heavy degree of vehicle electrification there.
Looking Forward
President-elect Trump’s sweeping victory on November 5th and the resounding stock market response to his win on November 6th will greatly impact direct selling stocks over the short and perhaps medium terms. Indeed, the major stock market indices staged their biggest rallies in two years on the day after the election. Industry groups such as banks and technology companies that are thought to benefit from reduced government regulation performed especially well on November 6th.
The stock market cannot be considered cheap versus historical averages—it trades at about 22x forward earnings. Nevertheless, given the market’s seemingly unstoppable momentum, investor enthusiasm could drive many industry groups, including direct selling stocks, higher for some time.
A concern though is a sharp spike in long-term bond yields since the election. Many investors believe the expected tariff and tax policies of the incoming Administration could cause inflation to increase and the Federal budget deficit to further widen. If yields were to continue to move higher that could put an effective ceiling on stock market performance.
Notwithstanding the potential inflation risk noted above, if the Fed can reach its goal of bringing CPI inflation down to a normalized 2% annual rate, this could suggest stocks may post well above average returns for a third consecutive year in 2025. Indeed, Bloomberg analyzed market data from 1929 through 2023 and concluded that during years the inflation gauge averaged 2% to 3%, the S&P 500 gained an average of 16%.
CHARTS & ANALYSIS
Direct Selling Capital Advisors Index
The DSCI is a market capitalization weighted index of all domestic public direct selling companies with a market capitalization of at least $25 million. The index is rebalanced monthly, and no single issue is permitted to represent more than 20% of its total value. In such an event, the excess weighting would be redistributed among the other index components.
The DSCI rose in October and markedly outperformed the DJIA during the month. The DSCI gained 3.2% in October, about 450 basis points ahead of the 1.3% decrease for the DJIA. DSCI data is tracked back to March 1, 2020. The direct selling index has risen 40.3% since that date versus the 64.4% appreciation of the DJIA over the same period.

Large Cap
Betterware de Mexico (NASDAQ: BWMX) inched up 0.2% in October, trimming its YTD loss to 8.9%. Since the March 1, 2020 DSCI inception, BWMX is up 34.8%.
On October 24, BWMX reported 3Q 2024 consolidated net revenue of 3.33 billion pesos, up 6.6% from 3.12 billion pesos in the year-ago period. BWMX’s adjusted EBITDA increased even more sharply in the quarter, reaching 592 million pesos, about 11.7% higher than the 529 million pesos in 3Q 2023. The company’s impressive quarter reflects the resilience of its core operations despite challenges which included exchange rate fluctuations and cost pressures, such as freight costs. The growth highlights operational efficiencies achieved over the last year, strategic growth initiatives underway across all business units, and BWMX’s diversified portfolio of product categories.
BWMX continues to project that 1) its 2024 revenue will be 13.8 to 14.4 billion pesos, up from 13.0 billion pesos in 2023; and 2) its 2024 EBITDA will increase to 2.9-3.1 billion pesos versus 2.721 billion pesos last year. The company notes that full-year 2024 EBITDA will likely come in at the lower end of the 2.9-3.1 billion range,
BWMX began trading in March 2020 after the company’s merger with SPAC sponsor DD3 Acquisition Corp. BWMX specifically targets the Mexican market; it serves three million households through distributors and associates in approximately 800 communities throughout Mexico.
Nu Skin Enterprises, Inc. (NYSE: NUS) dropped 16.0% in October, making it the worst performing large cap DSCI component for a second consecutive month. (NUS fell 17.5% in September). YTD, NUS is down 68.1%, the second worst mark for any large cap direct selling stock. Since the March 2020 establishment of the DSCI, NUS has lost 73.8%. In comparison, the direct selling stock index and the Dow Jones Industrial Average have gained 40.3% and 64.4%, respectively, over this 56-month period.
In early August, NUS reported 2Q 2024 revenue and adjusted EPS of $439.1 million and $0.21, both of which were down from $500.3 million and $0.54, respectively, in the year-ago period. NUS’ core Nu Skin business continues to be affected by a difficult global macroeconomic environment, particularly in China. More constructively, the company’s Rhyz sales increased 32% in 2Q 2024 versus 2Q 2023 led by strong performances in its Mavely affiliate platform and manufacturing companies. Rhyz’s 2Q 2024 sales totaled about $68 million, or more than 15% of NUS’ overall sales in the quarter.
Due principally to foreign exchange headwinds, NUS reduced its revenue and non-GAAP EPS guidance ranges for full year 2024 to $1.73-$1.81 billion and $0.75-$0.95, respectively. The comparable figures for full year 2023 were $1.97 billion and $1.85, respectively. NUS plans to release its 3Q 2024 earnings after the stock market closes on November 7th.
Herbalife Nutrition, Inc. (NYSE: HLF) was the best performing large cap DSCI member in October, as it jumped 5.0% during the month. This gain cut its YTD loss to 50.5%. HLF is down 76.7% since the establishment of the DSCI on March 1, 2020. This represents the second worst performance for any large-cap DSCI component which has traded continuously since index inception.
On October 30, HLF reported 3Q 2024 sales of $1.24 billion, down 3.2% from $1.28 billion in 3Q 2023. More constructively, net sales in the quarter were nearly flat year-over-year on a constant currency basis, and HLF’s gross margin rose to 78.3% in 3Q 2024 from 76.3% in 3Q 2023 due to more favorable pricing and lower input costs. HLF’s 3Q 2024 adjusted EBITDA reached $166.5 million, up from $163.3 million in the year-ago period. Furthermore, the company’s 3Q 2024 adjusted EBITDA margin was 13.4%, up from 12.7% in 3Q 2023.
In 3Q 2024, the number of new distributors joining HLF worldwide increased 14% year-over-year, representing the second consecutive quarter of year-over-year improvement. In addition, CFO John DeSimone reaffirmed HLF’s plans to reduce total debt by $1 billion over the next four to five years. This initiative will be the primary use of the company’s free cash flow through the balance of the decade.
As of June 30, HLF completed substantially all actions related to its organizational restructuring plan. The plan should ultimately deliver annual savings of at least $80 million beginning in 2025, with at least $50 million expected to be achieved in 2024. At least $30 million of this amount was realized during the first three quarters of 2024. HLF expects to incur total program pretax expenses of at least $70 million in 2024, primarily related to severance expenses.
HLF increased its full-year 2024 adjusted EBITDA guidance to $590 to $620 million, up from $560 to $600 million. In addition, HLF narrowed its estimate of full-year 2024 revenue growth to a range of negative 2.0% to negative 1.0% from the negative 3.5% to positive 1.5% range it issued in late July.
Medifast, Inc. (NYSE: MED) shares declined 4.0% in October, adding to its YTD loss of 72.7%, the worst mark of any large cap DSCI component. MED is likewise the worst performing DSCI large cap member on a long-term basis; since the March 1, 2020 establishment of the DSCI, MED has declined 76.9%.
On November 4, MED reported 3Q 2024 revenue of $140.2 million, down 40% from $235.9 million in 3Q 2024. The company’s adjusted diluted EPS fell even more sharply to $0.35 in 3Q 2024 from $2.12 in the year-ago period. The number of active earning OPTAVIA coaches decreased to 30,000 in 3Q 2024 from 47,100 in 3Q 2023. Furthermore, the average revenue per active earning OPTAVIA coach was $4,672 in 3Q 2024, down from $5,008 in the year-ago period. MED expects its 4Q 2024 revenue and adjusted diluted EPS will be $100-$120 million and a loss of $0.10 to a loss of $0.65, respectively.
MED is realigning its business to respond to the evolving dynamics in the weight loss industry, and to transform its business model to meet the soaring demand for GLP-1 medications. Indeed, up to 20 million people in the US could be using GLP-1 treatments by 2030, according to some projections. MED offers comprehensive support for GLP-1 medication users, including access to clinicians through LifeMD, as well as programs and products to help maintain muscle and minimize side effects.
In October, shares of USANA Health Sciences, Inc. (NYSE: USNA) lost 2.6%, bringing its YTD loss to 31.1%. Since the creation of the DSCI on March 1, 2020, USANA shares have lost 44.1% compared with gains of 40.3% and 64.4% for the direct selling index and the DJIA, respectively.
On October 22, USANA reported 3Q 2024 and diluted EPS of $200 million and $0.56, both down from $213 million and $0.59, respectively, in the year ago period. USANA’s 3Q 2024 operating results reflected continued top line headwinds across many of the company’s markets. USANA’s sales force continued to face challenges in attracting new customers as consumer sentiment remained cautious, including in the company’s largest market, China. Nevertheless, USANA has generated $47 million of free cash flow over the first three quarters of 2024. In addition, the company’s balance sheet is pristine; it has $365 million of cash and no debt.
In its earnings report, USANA refined its forecast for 2024. It now expects revenue of $850 million, down slightly from its previous guidance range of $850 to $880 million. Also, management believes its 2024 EPS should be $2.45; USANA had guided to 2024 EPS of $2.40 to $2.55 in its 2Q 2024 earnings release.
eXp World Holdings, Inc. (NASDAQ: EXPI) dropped 5.5% in October, ending a three-month streak, during which the stock increased or decreased by at least 18% (+19.8% in September, -18.1% in August, and +27.3% in July). Year to date, EXPI has declined 14.2%. EXPI shares have appreciated an aggregate 178.7% over the 56 months the DSCI has been computed, the best long-term mark of any DSCI member.
In late July, EXPI, the fastest growing real estate brokerage in the world, reported 2Q 2024 revenue and adjusted EBITDA of $1.295 billion and $32.8 million, respectively. These measures compared favorably with $1.23 billion and $26.8 million, respectively, in 2Q 2023. Notably, EXPI’s 2Q 2024 international revenue increased 69% versus 2Q 2023. The increased productivity of EXPI’s agents, together with improved business efficiencies, allowed 2Q 2024 adjusted EBITDA to rise 22%. EXPI plans to release its 3Q 2024 earnings after the stock market closes on November 7th.
EXPI’s transaction volume in 2Q 2024 increased 7% to $51.9 billion from $48.5 billion in 2Q 2023. Agents and brokers on the company’s platform totaled 87,111 as of June 30, 2024, down 1% from June 30, 2023, due primarily to the exit of unproductive agents.
A leading provider of financial services in the US and Canada, and by far the largest market cap stock in the DSCI, Primerica, Inc. (NYSE: PRI) gained 4.4% in October. Year to date, PRI has gained 34.5%, the second best return for any large cap DSCI component. PRI has increased 152.7% since March 1, 2020, the second best long-term performance for any DSCI component.
On November 6, PRI reported 3Q 2024 adjusted operating revenue of $770.1 million, up 10% from $699.8 million in the year-ago period. The company’s adjusted operating EPS grew at a much faster pace (+31%), reaching $5.72 in 3Q 2024 versus $4.38 in 3Q 2023. Results in PRI’s Term Life segment benefitted from continued strong sales and stable margins. The company’s Investment and Savings Products unit were boosted by favorable equity market conditions in 3Q 2024 which fueled sales growth and higher client asset values. PRI repurchased 511,000 shares of its stock in 3Q 2024 for $128.8 million.
In August, PRI increased its quarterly dividend to $0.90 per share ($3.60 annualized) from $0.75 per share ($3.00 annualized). The next $0.90 dividend payable date is December 12th. Since 2018, PRI had announced an increase in its dividend once a year in February, so this accelerated dividend increase action by PRI’s Board represents a significant vote of confidence in the company’s prospects.
Nature’s Sunshine Products, Inc. (NASDAQ: NATR) fell 7.0% in October, bringing its YTD loss to 26.8%. Over the 56 months the DSCI has been calculated, NATR has gained 63.0%, the fourth best mark for any direct selling index stock over that period.
In early August, NATR, which markets and distributes nutritional and personal care products in more than 40 countries, reported 2Q 2024 net sales of $110.6 million, down 5% from $116.5 million in the year-ago period. Adjusted EBITDA in 2Q 2024 totaled $10.4 million, down 8% from $11.3 million in 2Q 2023. In 2Q 2024, NATR was affected by macroeconomic headwinds in China and slowing consumer spending in the US.
Given the softness in NATR’s Asia segment, the company reset its full-year 2024 net sales and adjusted EBITDA guidance to $436-$445 million and $39-$42 million from its previous ranges of $455-$480 million and $42-$48 million, respectively. Net sales and adjusted EBITDA in 2023 totaled $445.3 million and $40.4 million, respectively. NATR will release its 3Q 2024 earnings after the stock market closes on November 7th.
LifeVantage Corporation (NASDAQ: LFVN) rose 1.2% in October, adding to its 103.7% YTD gain, by far the strongest performance of any direct selling stock. Since the March 1, 2020 establishment of the DSCI, LFVN has gained 2.6%.
In September, LFVN announced promising results of an in vitro study that investigated the combined effects of its upcoming two-product system on enhancing the body’s activating GLP-1 production. The study revealed not only a significant increase in GLP-1 production, but also a synergistic activation of the key genes responsible for its synthesis and regulation within the body.
On October 11, LFVN released groundbreaking human clinical trial results from its MindBody GLP-1 System. Participants realized a 140% average increase in GLP-1 levels in the body, leading to an average weight loss of nine pounds in eight weeks and up to 25 pounds in twelve weeks. The 12-week, 60-participant clinical trial began in early June.
On October 29, LFVN reported revenue of $47.2 million in 1Q FY 2025 (quarter ended September 30, 2024), down 8.1% from $51.4 million in the year-ago period. LFVN’s adjusted EBITDA was $4.4 million in 1Q FY 2025, up from $4.0 million in 1Q FY 2024. LFVN continues to focus on optimizing its cost structure while being strategic with its investments in growth and innovation.
LFVN maintained its revenue and adjusted EBITDA guidance ranges for FY 2025 (twelve months ending June 30, 2025) of $200-$210 million and $18-$21 million, respectively. The company’s FY 2024 revenue totaled $200.2 million, and its FY 2024 adjusted EBITDA was $17.0 million.
Oliveda International, Inc. (OTC: OLVI) has more than 20 years of experience in: 1) the management and organic certification of mountain olive trees; 2) the extraction of international award-winning extra virgin olive oils; 3) the extraction of hydroxytyrosol, a substance which has several beneficial effects such as antioxidant, anti-inflammatory, anticancer and as a protector of skin and eyes; and 4) the production of and distribution of cosmetic and holistic waterless products related to the olive tree. OLIV is the second largest market cap stock in the DSCI.
OLIV’s 3Q 2024 revenue was $27.7 million, up nearly 1,500% from $1.8 million in 3Q 2023. Its net loss in 3Q 2024 was $38.5, or a loss of $0.06 per share, compared with net income of $1.8 million in the year-ago period. Over the first nine months of 2024, OLIV generated positive operating cash flow of $10.3 million versus a slight loss over the first nine months of 2023.

 Note: For the purposes of this report, Direct Selling Capital considers companies with a market capitalization in excess of $1 billion “Large Cap.”
Small Cap
Our small cap tracking set performed about in line with the large cap DSCI group in October. Four small caps rose during the month, and three fell.
The Beachbody Company, Inc. (NYSE: BODI), a leading fitness and nutrition company, posted the best performance (+6.8%) of any DSCI member with a market value of at least $1 million in October. This appreciation cut BODI’s YTD loss to 26.3%. In August, BODI reported 2Q 2024 revenue and adjusted EBITDA of $110.2 million and $4.9 million versus $134.9 million and a loss of $4.8 million, respectively, in the year-ago period.


Short Interest Data & Analysis
The following chart is an aggregate index of “days to cover” among the entire tracking set. Days to cover (DTC) is a measurement determined by dividing the total outstanding short interest by average daily trading volume.
 As indicated in the chart, short interest in DSCI stocks was 7.0 days in mid-October, up from 5.9 days at the end of September and 6.1 days in mid-September. The biggest absolute rise in DTC in mid-October from the end of September for a DSCI component was EXPI’s increase to 23.6 days from 20.6 days.
Short interest can be a difficult indicator to analyze. On the one hand, an increase in short interest can be a bearish sign in that it indicates an increased view among investors that a stock is likely to decline based on any number of factors, such as a belief that the company’s fundamentals are deteriorating or that it has run too far, too fast. On the other hand, as a stock moves higher, a significant short interest can serve as extra fuel on the fire as investors scramble to “buy to cover” their short positions and mitigate losses.
Analyst Sentiment Index
Our Analyst Sentiment Index fell in October from September. The proportion of sell-side analysts maintaining “buy” and “hold” ratings on industry stocks in October was about 87%, down from 90% in September. Conversely, the percentage of stocks which analysts recommended selling was around 13% in October and 10% in September.
 Methodology: The DSCA Analyst Sentiment Index is a consensus tracking tool that aggregates and averages the recommendations of all covering analysts across all public direct selling companies.
 -
September 2024
Brought to you by Direct Selling Capital Advisors
Direct Selling Index Increases 0.5% in September; Index Has Posted Gains in Ten of the Last Eleven Months
In September, the Direct Selling Capital Advisors Direct Selling Index (DSCI) inched 0.5% higher, its second consecutive small monthly gain (+0.6% in August) and the index’s tenth increase in the last eleven months. The DSCI underperformed the Dow Jones Industrials Average (DJIA) in September, as the DJIA gained 1.8% during the month. Over the first three quarters of 2024, the DSCI rose 7.4%, while the DJIA increased 12.3%.
Large cap directly selling stocks as a group outperformed their smaller cap peers in September. Four large cap members rose, two by double digit percentage points, including a 51.8% gain in LifeVantage Corporation (NASDAQ: LFVN), while five declined. By comparison, two small caps rose during the month and four fell. One small cap component gained by more than 10% in September, while all four small cap decliners lost more than 10% during the month.
From a longer-term perspective, the DSCI has gained an aggregate 35.9% since its March 1, 2020 inception. The DJIA has outperformed the direct selling index over this period. Since March 1, 2020, the DJIA has increased 66.6%.
The Fed’s September 18th decision to implement a supersized 50-basis point rate cut sparked a stock market rally that continued through the end of September. The jump in all major indices to or near all-time highs brought S&P 500 year-to-date gains to about 20%. Investors chose to interpret the central bank’s unusual decision as a timely, proactive move rather than one that was necessary to stabilize a cooling labor market.
The stock market had dipped sharply at the start of both August and September based on fears of an unwind of the yen carry trade and a too-rapidly slowing economy, respectively. The market’s constructive reaction to the Fed’s announcement seems to signal that investors may generally remain optimistic at least through election day. Furthermore, the historically poor stock market month of September is now over, which at least psychologically supports bullish investors.
Looking Forward
The direct selling stocks will begin reporting their 3Q 2024 results in late October. When these earnings results begin to be announced, the content of the individual company releases will be the key factor in stock performance, but for most of October the direction of the overall stock market will likely be the driver for DSCI member stocks.
Clearly, the stock market cannot be considered especially cheap: it trades at nearly 22x forward-year earnings. Nevertheless, a “glass half full” investor mindset, coupled with the market’s tendency to perform well after a Fed precautionary rate cut as opposed to a “needed” policy rate reduction when the economy is in recession, suggests the stock market could continue to move higher over the short to intermediate term. Another potential positive for stocks is the Chinese government’s late September decision to launch its biggest monetary stimulus measures since the COVID-19 pandemic.
A concern with this positive stance is that an uncomfortably high number of market participants are bullish. Indeed, a cnbc.com survey conducted in late September found that 97% of all family offices expect positive returns over the next twelve months, and almost half anticipate double digit gains. The head of Citi Private Bank notes “this is the most optimistic outlook we’ve seen.” Despite the optimistic view being by far the majority’s opinion, the Fed’s decision to begin cutting rates at a time when profits at U.S. companies are accelerating—a very unusual and powerful combination—could mean that the majority is right.
CHARTS & ANALYSIS
Direct Selling Capital Advisors Index
The DSCI is a market capitalization weighted index of all domestic public direct selling companies with a market capitalization of at least $25 million. The index is rebalanced monthly, and no single issue is permitted to represent more than 20% of its total value. In such an event, the excess weighting would be redistributed among the other index components.
The DSCI rose in September but underperformed the DJIA during the month. The DSCI gained 0.5% in September, about 130 basis points behind the 1.8% increase for the DJIA. DSCI data is tracked back to March 1, 2020. The direct selling index has risen 35.9% since that date versus the 66.6% appreciation of the DJIA over the same period.

Large Cap
Betterware de Mexico (NASDAQ: BWMX) lost 6.6% in September, bringing its YTD loss to 9.0%. Since the March 1, 2020 DSCI inception, BWMX is up 34.6%.
In late July, BWMX reported 2Q 2024 consolidated net revenue of 3.39 billion pesos, up 5.3% from 3.22 billion pesos in 2Q 2023. Sales at all three of BWMX’s segments rose in the quarter. On the other hand, the company’s 2Q 2024 EBITDA of 656.1 million pesos was 8.5% lower than in the year-ago period.
BWMX expects robust results in the second half of 2024. Consequently, the company reiterated the full-year 2024 net revenue and EBITDA guidance it issued at the beginning of 2024. More specifically, BWMX projects its 2024 revenue will range from 13.8 to 14.4 billion pesos, up from 13.0 billion pesos in 2023. Similarly, the company expects its 2024 EBITDA will increase to 2.9-3.1 billion pesos versus 2.721 billion pesos last year.
BWMX began trading in March 2020 after the company’s merger with SPAC sponsor DD3 Acquisition Corp. BWMX specifically targets the Mexican market; it serves three million households through distributors and associates in approximately 800 communities throughout Mexico.
Nu Skin Enterprises, Inc. (NYSE: NUS) declined 17.5% in September, making it the worst performing large cap DSCI component during the month. YTD, NUS is down 62.0%, the second worst mark for any large cap direct selling stock. Since the March 2020 establishment of the DSCI, NUS has lost 68.8%. In comparison, the direct selling stock index and the Dow Jones Industrial Average have gained 35.9% and 66.6%, respectively, over this 55-month period.
In early August, NUS reported 2Q 2024 revenue and adjusted EPS of $439.1 million and $0.21, both of which were down from $500.3 million and $0.54, respectively, in the year-ago period. NUS’ core Nu Skin business continues to be affected by a difficult global macroeconomic environment, particularly in China. More constructively, the company’s Rhyz sales increased 32% in 2Q 2024 versus 2Q 2023 led by strong performances in its Mavely affiliate platform and manufacturing companies. Rhyz’s 2Q 2024 sales totaled about $68 million, or more than 15% of NUS’ overall sales in the quarter.
Due principally to foreign exchange headwinds, NUS reduced its revenue and non-GAAP EPS guidance ranges for full year 2024 to $1.73-$1.81 billion and $0.75-$0.95, respectively. The comparable figures for full year 2023 were $1.97 billion and $1.85, respectively. The company projects 3Q 2024 sales of $430-$465 million and adjusted EPS of $0.15-$0.25.
As part of a quarterly rebalance, the S&P Dow Jones Indices removed NUS from the S&P SmallCap 600 Index effective September 23, 2024.
Herbalife Nutrition, Inc. (NYSE: HLF) fell 11.9% in September, marking its second consecutive double digit monthly percentage decline (-33.6% in August). Over the first three quarters of 2024, HLF lost 52.9% of its value. In addition, the stock is down 77.8% since the establishment of the DSCI on March 1, 2020. This represents the worst performance for any large-cap DSCI component which has traded continuously since index inception.
In late July, HLF reported 2Q 2024 sales of $1.28 billion, down 2.5% from $1.31 billion in 2Q 2023. Notably, foreign exchange headwinds caused sales to decline 2.7%, so absent this effect, revenue would have risen slightly. HLF’s adjusted EBITDA reached $180.0 million in 2Q 2024, up from $169.6 million in the year-ago period. Furthermore, the company’s 2Q 2024 adjusted EBITDA margin was 14.1%, up from 12.9% in 2Q 2023.
According to HLF’s CFO John DeSimone on the company’s 2Q 2024 earnings conference, HLF plans to pay off $1 billion in debt over the next four to five years. This initiative will be the primary use of the company’s free cash flow through the balance of the decade.
HLF implemented further actions related to its organizational restructuring plan in 2Q 2024. The plan should ultimately deliver annual savings of at least $80 million. At least $10 million of this amount was realized during 2Q 2024. HLF expects to incur total program pretax expenses of at least $70 million, primarily related to severance expenses.
HLF slightly increased its full-year 2024 adjusted EBITDA guidance to $560 to $600 million, up from $550 to $590 million. On the other hand, HLF downgraded its estimate of full-year revenue growth to a range of negative 3.5% to positive 1.5% from the 0% to positive 5% range it issued in early May. The company plans to announce its 3Q 2024 financial results after the stock market close on October 30.
Medifast, Inc. (NYSE: MED) shares jumped 4.6% in September. This gain cut its loss over the first nine months of 2024 to 71.5%; nonetheless, MED is still the worst performing DSCI large cap member on a YTD basis. Since the March 1, 2020 establishment of the DSCI, MED has declined 75.9%.
In early August, MED reported 2Q 2024 revenue of $168.6 million, down 43% from $296.2 million in 2Q 2023. The company’s adjusted diluted EPS fell even more sharply to $0.92 in 2Q 2024 from $2.77 in the year-ago period. The number of active earning OPTAVIA coaches decreased to 33,900 in 2Q 2024 from 53,100 in 2Q 2023. In addition, the average revenue per active earning OPTAVIA coach was $4,972 in 2Q 2024, down from $5,578 in the year-ago period. MED expects its 3Q 2024 revenue and adjusted diluted EPS will be $125-$145 million and a loss of $0.05 to a loss of $0.70, respectively.
MED is realigning its business to respond to the evolving dynamics in the weight loss industry, and to transform its business model to meet the soaring demand for GLP-1 medications. Indeed, up to 20 million people in the US could be using GLP-1 treatments by 2030, according to some projections. MED incurred $4.6 million of marketing expenses in 2Q 2024 to increase brand awareness of its holistic approach to medical weight loss, and to attract new customers.
In September, shares of USANA Health Sciences, Inc. (NYSE: USNA) lost 7.1%, taking its YTD loss to 29.3%. Since the creation of the DSCI on March 1, 2020, USANA shares have lost 42.6% compared with gains of 35.9% and 66.6% for the direct selling index and the DJIA, respectively.
In late July, USANA reported 2Q 2024 revenue and diluted EPS of $213 million and $0.54, both down from $238 million and $0.89, respectively, in the year ago period. Ongoing macroeconomic pressures in several of the company’s key markets continue to impact consumer spending. The strengthening US dollar also hurt 2Q 2024 revenue and earnings. As an offset, USANA plans to offer a more robust promotional calendar over the balance of 2024. The company guided to full year 2024 revenue and diluted EPS of $850-$880 million and $2.40-$2.55, respectively.
In late August, HR Asia, a leading publication in the human resources industry, named USANA Philippines one of the best companies for which to work in the Philippines. USANA has received this recognition for three consecutive years.
eXp World Holdings, Inc. (NASDAQ: EXPI) soared 19.8% in September, continuing its volatile trading pattern over the last few months (-18.1% in August and +27.3% in July). Year to date, EXPI has declined 9.2%. EXPI shares have appreciated an aggregate 194.8% over the 55 months the DSCI has been computed, the best long-term mark of any DSCI member.
In late July, EXPI, the fastest growing real estate brokerage in the world, reported 2Q 2024 revenue and adjusted EBITDA of $1.295 billion and $32.8 million, respectively. These measures compared favorably with $1.23 billion and $26.8 million, respectively, in 2Q 2023. Notably, EXPI’s 2Q 2024 international revenue increased 69% versus 2Q 2023. The increased productivity of EXPI’s agents, together with improved business efficiencies, allowed 2Q 2024 adjusted EBITDA to rise 22%. Furthermore, EXPI’s G&A expense in 2Q 2024 declined 6% compared with the year-ago period primarily due to cost containment initiatives. Increased legal expenses offset some of these cost reductions.
EXPI’s transaction volume in the just-completed quarter increased 7% to $51.9 billion from $48.5 billion in 2Q 2023. Agents and brokers on the company’s platform totaled 87,111 as of June 30, 2024, down 1% from June 30, 2023, due primarily to the exit of unproductive agents.
A leading provider of financial services in the US and Canada, and by far the largest market cap stock in the DSCI, Primerica, Inc. (NYSE: PRI) eked out a 0.7% gain in September. Year to date, PRI has gained 28.9%, the second best return for any large cap DSCI component. PRI has increased 142.0% since March 1, 2020, the second best long-term performance for any DSCI component.
On August 7, PRI reported 2Q 2024 revenue of $803.4 million, up 17% from $688.4 million in the year-ago period. The company’s adjusted operating EPS grew at an even faster pace (+18%), reaching $4.71 in 2Q 2024 versus $3.99 in 2Q 2023. PRI’s impressive results in the June 2024 quarter were driven by strong sales of investment products and rising client asset values, as well as steady premium growth and the predictable margins in the Term Life business. Investment income benefitted from higher yielding investments and growth in PRI’s invested asset portfolio.
Also on August 7, PRI increased its quarterly dividend to $0.90 per share ($3.60 annualized) from $0.75 per share ($3.00 annualized). The $0.90 dividend was paid to shareholders on September 12. Since 2018, PRI had announced an increase in its dividend once a year in February, so this accelerated dividend increase action by PRI’s Board represents a significant vote of confidence in the company’s prospects.
Nature’s Sunshine Products, Inc. (NASDAQ: NATR) edged 1.3% lower in September, bringing its YTD loss to 21.2%. Over the 55 months the DSCI has been calculated, NATR has gained 75.4%, the fourth best mark for any direct selling index stock over that period.
In early August, NATR, which markets and distributes nutritional and personal care products in more than 40 countries, reported 2Q 2024 net sales of $110.6 million, down 5% from $116.5 million in the year-ago period. Adjusted EBITDA in 2Q 2024 totaled $10.4 million, down 8% from $11.3 million in 2Q 2023. In 2Q 2024, NATR was affected by macroeconomic headwinds in China and slowing consumer spending in the US.
Given the softness in NATR’s Asia segment, the company reset its full-year 2024 net sales and adjusted EBITDA guidance to $436-$445 million and $39-$42 million from its previous ranges of $455-$480 million and $42-$48 million, respectively. Net sales and adjusted EBITDA in 2023 totaled $445.3 million and $40.4 million, respectively.
On September 16, NATR appointed Kevin Fuller as its Global Chief Marketing Officer effective September 23rd. Mr. Fuller had been President and Chief Marketing Officer at Helo Health. Prior to that, he led Nu Skin Enterprises, Inc.’s (NUS) marketing organization.
LifeVantage Corporation (NASDAQ: LFVN) exploded 51.8% higher in September, by far the best performance of any direct selling
stock. This gain pushed LFVN’s increase over the first three quarters of 2024 to 101.3% and flipped LFVN’s performance since the March 1, 2020 establishment of the DSCI to a slight positive (+1.4%).
On September 10, LFVN announced promising results of an in vitro study that investigated the combined effects of its upcoming two-product system on enhancing the body’s activating GLP-1 production. The study revealed not only a significant increase in GLP-1 production, but also a synergistic activation of the key genes responsible for its synthesis and regulation within the body.
In addition, LFVN announced on September 26 that it had completed a randomized, 12-week, 60-participant clinical trial that assessed the impact of its two-product system on weight management, food cravings and overall well-being. LFVN will release the trial results on October 11-12 in Kansas City where the company’s two-product system will be revealed.
In late August, LFVN reported revenue of $48.9 million in 4Q FY 2024 (the quarter ended June 30, 2024), down 9.8% from $54.2 million in the year ago period. LFVN’s adjusted EBITDA was $4.8 million in 4Q FY 2024, flat versus 4Q FY 2023. LFVN’s focus on operational excellence allowed the company to post flat adjusted EBITDA despite top line headwinds stemming from challenging macroeconomic conditions.
LFVN introduced revenue and adjusted EBITDA guidance ranges for FY 2025 (twelve months ending June 30, 2025) of $200-$210 million and $18-$21 million, respectively. The company’s FY 2024 revenue totaled $200.2 million, and its FY 2024 adjusted EBITDA was $17.0 million.

 Note: For the purposes of this report, Direct Selling Capital considers companies with a market capitalization in excess of $1 billion “Large Cap.”
Small Cap
Our small cap tracking set underperformed the large cap DSCI group in September. Two small caps rose during the month, four fell, and one was unchanged.
Educational Development Corporation (NASDAQ: EDUC), a publishing company specializing in books and educational products for children, posted the best performance (+15.3%) of any small cap DSCI member in September. This appreciation increased EDUC’s YTD gain to 101.7%, the best mark for any direct selling stock. In July, EDUC reported 1Q FY 2025 (quarter ended May 31, 2024) revenue and diluted EPS of $10.0 million and a loss of $0.15 versus $14.5 million and a loss of $0.11, respectively, in the year ago period.


Short Interest Data & Analysis
The following chart is an aggregate index of “Days to Cover” among the entire tracking set. Days to Cover (DTC) is a measurement determined by dividing the total outstanding short interest by average daily trading volume.
 As indicated in the chart, short interest in DSCI stocks was 6.1 days in mid-September, down slightly from 6.2 days at the end of August and up slightly from 5.9 days in mid-August. The biggest absolute decrease in DTC in mid-September from the end of August for a DSCI component was EDUC’s decline to 0.3 days from 1.8 days.
Short interest can be a difficult indicator to analyze. On the one hand, an increase in short interest can be a bearish sign in that it indicates an increased view among investors that a stock is likely to decline based on any number of factors, such as a belief that the company’s fundamentals are deteriorating or that it has run too far, too fast. On the other hand, as a stock moves higher, a significant short interest can serve as extra fuel on the fire as investors scramble to “Buy to Cover” their short positions and mitigate losses.
Analyst Sentiment Index
Our Analyst Sentiment Index rose slightly in September from August. The proportion of sell-side analysts maintaining “buy” and “hold” ratings on industry stocks in September was about 90%, up from 89% in August. Conversely, the percentage of stocks which analysts recommended selling was around 10% in September and 11% in August.
 Methodology: The DSCA Analyst Sentiment Index is a consensus tracking tool that aggregates and averages the recommendations of all covering analysts across all public direct selling companies.
 -
August 2024
Brought to you by Direct Selling Capital Advisors
Direct Selling Index Rises 0.6% in August But Underperforms the DJIA During the Month
In August, the Direct Selling Capital Advisors Direct Selling Index (DSCI) managed a meager 0.6% gain; the index has now posted a monthly increase in nine of the last ten months. However, the DSCI underperformed the Dow Jones Industrials Average (DJIA) in August. The DJIA gained 1.8% during the month. Over the first eight months of 2024, the DSCI rose 6.9%, while the DJIA increased 10.3%.
Large cap direct selling stocks as a group performed about in line with their smaller cap peers in August. Only one large cap member rose, while eight fell, five by double digit percentage points. Similarly, just one small cap component posted a monthly gain, five declined, and one was unchanged. Despite these results, the market capitalization weighted DSCI posted a positive month in August because Primerica, Inc. (NYSE: PRI), by far the largest weight in the index, jumped 4.6%.
From a longer-term perspective, the DSCI has gained an aggregate 35.2% since its March 1, 2020 inception. The DJIA has outperformed the direct selling index over this period. Since March 1, 2020, the DJIA has increased 63.6%.
The stock market staged an impressive rally off the flash crash on August 5th. The DJIA and NASDAQ have popped 8% and 13%, respectively, since the lows of that day. Stock market-friendly CPI, PPI, retail sales, and jobless claims released in mid-August were constructive data points for stocks during the month. More importantly, this data appears consistent with: 1) an economy poised for a soft landing; and 2) a Fed that will begin a rate cutting program in September 2024. Indeed, Chairman Powell said in a highly anticipated speech on August 23rd that “the time has come for policy to adjust.” Rate cuts seem very likely to incentivize activity in key industries like homebuilders and automobile manufacturers.
Looking Forward
The direct selling stocks have mainly completed reporting their 2Q 2024 results, so the performance of DSCI components this month will probably be dictated by the general direction of the stock market. Based on stock market history, such reliance in the short term may not be the most ideal situation, as returns in the month of September have on average been the lowest of the calendar year. Indeed, the S&P 500 Index has declined between 4% and 9% during the last four Septembers.
Nevertheless, several factors suggest September 2024 could be a positive month. First, S&P 500 earnings were robust in 2Q 2024, rising 13% year-over-year, the best mark since 4Q 2021. Furthermore, earnings in 3Q 2024 and 4Q 2024 are likewise expected to increase — up about 6% and 14%, respectively, versus the year-ago periods.
Second, the key tenet of a bear case for stocks is a fear the economy will slow far more decisively than it would in a “soft landing.” However, S&P 500 company managements are not sensing an impending sharp slowdown, at least based on an analysis of trends in earnings call transcripts over the last ten quarters, per J.P. Morgan Asset Management. If anything, fears about an economic slowdown and job cuts are in aggregate lower now than they were six months ago.
Finally, the number of stocks which are performing well continues to broaden — a marked departure from the tenor of the stock market earlier in 2024 when only mega-cap technology stocks seemed to move higher. Indeed, more than two-thirds of S&P 500 stocks rose in August.
CHARTS & ANALYSIS
Direct Selling Capital Advisors Index
The DSCI is a market capitalization weighted index of all domestic public direct selling companies with a market capitalization of at least $25 million. The index is rebalanced monthly, and no single issue is permitted to represent more than 20% of its total value. In such an event, the excess weighting would be redistributed among the other index components.
The DSCI rose in August but underperformed the DJIA during the month. The DSCI gained 0.6% in August, about 120 basis points behind the 1.8% increase for the DJIA. DSCI data is tracked back to March 1, 2020. The direct selling index has risen 35.2% since that date versus the 63.6% appreciation of the DJIA over the same period.

Large Cap
Betterware de Mexico (NASDAQ: BWMX) dropped 9.5% in August. This decline flipped BWMX’s YTD performance to a loss of 2.7% from a gain of 7.6% through July 2024. Nevertheless, BWMX’s performance over the first eight months of 2024 made it the third best performing large cap DSCI member over that period. Since the March 1, 2020 DSCI inception, BWMX is up 44.1%.
In late July, BWMX reported 2Q 2024 consolidated net revenue of 3.39 billion pesos, up 5.3% from 3.22 billion pesos in 2Q 2023. Sales at all three of BWMX’s segments rose in the quarter. On the other hand, the company’s 2Q 2024 EBITDA of 656.1 million pesos was 8.5% lower than in the year-ago period.
BWMX expects robust results in the second half of 2024. Consequently, the company reiterated the full-year 2024 net revenue and EBITDA guidance it issued at the beginning of 2024. More specifically, BWMX projects its 2024 revenue will range from 13.8 to 14.4 billion pesos, up from 13.0 billion pesos in 2023. Similarly, the company expects its 2024 EBITDA will increase to 2.9-3.1 billion pesos versus 2.721 billion pesos last year.
BWMX began trading in March 2020 after the company’s merger with SPAC sponsor DD3 Acquisition Corp. BWMX specifically targets the Mexican market; it serves three million households through distributors and associates in approximately 800 communities throughout Mexico.
Nu Skin Enterprises, Inc. (NYSE: NUS) fell 20.4% in August, bringing its YTD decline to 54.0%, the second worst mark of any large cap DSCI component. Since the March 2020 establishment of the DSCI, NUS has lost 62.1%. In comparison, the direct selling stock index and the Dow Jones Industrial Average have gained 35.2% and 63.6%, respectively, over this 4 ½-year period.
On August 8, NUS reported 2Q 2024 revenue and adjusted EPS of $439.1 million and $0.21, both of which were down from $500.3 million and $0.54, respectively, in the year-ago period. NUS’ core Nu Skin business continued to be affected by a difficult global macroeconomic environment. More constructively, the company’s Rhyz sales increased 32% in 2Q 2024 versus 2Q 2023 led by strong performances in its Mavely affiliate platform and manufacturing companies.
Due principally to foreign exchange headwinds, NUS reduced its revenue and non-GAAP EPS guidance ranges for the full year 2024 to $1.73-$1.81 billion and $0.75-$0.95 from the prior $1.73-$1.87 billion and $0.95-$1.35, respectively. The comparable figures for full year 2023 were $1.97 billion and $1.85, respectively. The company projects 3Q 2024 sales of $430-$465 million and adjusted EPS of $0.15-$0.25.
Herbalife Nutrition, Inc. (NYSE: HLF) dropped 33.6% in August, the worst mark of any DSCI component. HLF’s August performance ended a three-month stretch during which the stock was one of the best performing large cap members in each month. YTD, HLF has lost 46.5% of its value. In addition, the stock is down 74.8% since the establishment of the DSCI on March 1, 2020. This represents the second worst performance for any large-cap DSCI component which has traded continuously since index inception.
In late July, HLF reported 2Q 2024 sales of $1.28 billion, down 2.5% from $1.31 billion in 2Q 2023. Notably, foreign exchange headwinds caused sales to decline 2.7%, so absent this effect, revenue would have risen slightly. HLF’s adjusted EBITDA reached $180.0 million in 2Q 2024, up from $169.6 million in the year-ago period.
HLF implemented further actions related to its organizational restructuring plan in 2Q 2024. The plan should ultimately deliver annual savings of at least $80 million. At least $10 million of this amount was realized during 2Q 2024. HLF expects to incur total program pretax expenses of at least $70 million, primarily related to severance expenses.
HLF slightly increased its full-year 2024 adjusted EBITDA guidance to $560 to $600 million, up from $550 to $590 million. On the other hand, HLF downgraded its estimate of full-year revenue growth to a range of negative 3.5% to positive 1.5% from the 0% to positive 5% range it issued in early May.
Medifast, Inc. (NYSE: MED) shares fell 16.6% in August, adding to its YTD loss of 72.8%, the weakest performance of any DSCI member. Since the March 1, 2020 establishment of the DSCI, MED has declined 77.0%.
In early August, MED reported 2Q 2024 revenue of $168.6 million, down 43% from $296.2 million in 2Q 2023. The company’s adjusted diluted EPS fell even more sharply to $0.92 in 2Q 2024 from $2.77 in the year-ago period. The number of active earning OPTAVIA coaches decreased to 33,900 in 2Q 2024 from 53,100 in 2Q 2023. In addition, the average revenue per active earning OPTAVIA coach was $4,972 in 2Q 2024, down from $5,578 in the year-ago period. MED expects its 3Q 2024 revenue and adjusted diluted EPS will be $125-$145 million and a loss of $0.05 to a loss of $0.70, respectively.
MED is realigning its business to respond to the evolving dynamics in the weight loss industry and to transform its business model to meet the growing demand for GLP-1 medications. The company incurred $4.6 million of marketing expenses in 2Q 2024 to increase brand awareness of its holistic approach to medical weight loss, and to attract new customers.
In August, shares of USANA Health Sciences, Inc. (NYSE: USNA) dropped 8.5%, bringing its YTD loss to 23.8%. Since the creation of the DSCI on March 1, 2020, USANA shares have lost 38.2% compared with gains of 35.2% and 63.6% for the direct selling index and the DJIA, respectively.
In late July, USANA reported 2Q 2024 revenue and diluted EPS of $213 million and $0.54, both down from $238 million and $0.89, respectively, in the year-ago period. Ongoing macroeconomic pressures in several of the company’s key markets continue to impact consumer spending. The strengthening U.S. dollar also hurt 2Q 2024 revenue and earnings. As an offset, USANA plans to offer a more robust promotional calendar over the balance of 2024. The company guided to full year 2024 revenue and diluted EPS of $850-$880 million and $2.40-$2.55, respectively.
In late August, HR Asia, a leading publication in human resources industry, named USANA Philippines one of the best companies for which to work in the Philippines. USANA has received this recognition for three consecutive years.
eXp World Holdings, Inc. (NASDAQ: EXPI), decreased 18.1% in August, reversing much of its 27.3% gain in July. YTD, EXPI has declined 24.2%. Still, EXPI shares have appreciated an aggregate 146.0% over the 4 ½ years the DSCI has been computed, the best long-term mark of any DSCI member.
In late July, EXPI, the fastest growing real estate brokerage in the world, reported 2Q 2024 revenue and adjusted EBITDA of $1.295 billion and $32.8 million, respectively. These measures compared favorably with $1.23 billion and $26.8 million, respectively, in 2Q 2023. The increased productivity of EXPI’s agents, together with improved business efficiencies, allowed 2Q 2024 adjusted EBITDA to rise 22%.
EXPI’s transaction volume in the just-completed quarter increased 7% to $51.9 billion from $48.5 billion in 2Q 2023. Agents and brokers on the company’s platform totaled 87,111 as of June 30, 2024, down 1% from June 30, 2023, due primarily to the exit of unproductive agents.
A leading provider of financial services in the U.S. and Canada, and by far the largest market cap stock in the DSCI, Primerica, Inc. (NYSE: PRI) jumped 4.6%, the best mark of direct selling stock. Year to date, PRI has gained 27.9%, the second best return for any large cap DSCI component. PRI has increased 140.3% since March 1, 2020, the second best long-term performance for any DSCI component.
On August 7, PRI reported 2Q 2024 revenue of $803.4 million, up 17% from $688.4 million in the year-ago period. The company’s adjusted operating EPS grew at an even faster pace (+18%), reaching $4.71 in 2Q 2024 versus $3.99 in 2Q 2023. PRI’s impressive results in the June 2024 quarter were driven by strong sales of investment products and rising client asset values, as well as steady premium growth and the predictable margins in the Term Life business. Investment income benefited from higher yielding investments and growth in PRI’s invested asset portfolio. In 2Q 2024, PRI repurchased 629,400 of its shares for $142.7 million.
Nature’s Sunshine Products, Inc. (NASDAQ: NATR) fell 19.3% in August, bringing its YTD loss to 20.2%. Over the 54 months the DSCI has been calculated, NATR has gained 77.7%, the fourth best mark of any direct selling index stock over that period.
On August 8, NATR, which markets and distributes nutritional and personal care products in more than 40 countries, reported 2Q 2024 net sales of $110.6 million, down 5% from $116.5 million in the year-ago period. Adjusted EBITDA in 2Q 2024 totaled $10.4 million, down 8% from $11.3 million in 2Q 2023. In 2Q 2024, NATR was affected by macroeconomic headwinds in China and slowing consumer spending in the U.S.
Given the softness in NATR’s Asia segment, the company reset its full-year 2024 net sales and adjusted EBITDA guidance to $436-$445 million and $39-$42 million from its previous ranges of $455-$480 million and $42-$48 million, respectively. Net sales and adjusted EBITDA in 2023 totaled $445.3 million and $40.4 million, respectively.
LifeVantage Corporation (NASDAQ: LFVN) dipped 2.7% in August. Nonetheless, LFVN’s YTD gain is 32.7%, the strongest return for any large cap DSCI member. Since the March 1, 2020 establishment of the DSCI, LFVN has declined 33.2%.
On August 28, LFVN reported revenue of $48.9 million in 4Q FY 2024 (the quarter ended June 30, 2024), down 9.8% from $54.2 million in the year-ago period. LFVN’s adjusted EBITDA was $4.8 million in 4Q FY 2024, flat versus 4Q FY 2023. LFVN’s focus on operational excellence allowed the company to post flat adjusted EBITDA despite top-line headwinds stemming from challenging macroeconomic conditions.
LFVN introduced revenue and adjusted EBITDA guidance ranges for FY 2025 (twelve months ending June 30, 2025) of $200-$210 million and $18-$21 million, respectively. The company’s FY 2024 revenue totaled $200.2 million, and its FY 2024 adjusted EBITDA was $17.0 million.

 Note: For the purposes of this report, Direct Selling Capital considers companies with a market capitalization in excess of $1 billion “Large Cap.”
Small Cap
Our small cap tracking set performed approximately in line with the large cap DSCI group in August. One small cap rose during the month, five fell, and one was unchanged.
Mannatech, Incorporated (NASDAQ: MTEX), a global health and wellness company, posted the best performance (+2.9%) of any small cap DSCI member in August. This appreciation cut MTEX’s YTD loss to 6.8%. On August 13, MTEX reported 2Q 2024 revenue and EPS of $27.7 million and a loss of $0.33 versus $32.6 million and a loss of $0.59, respectively, in the year-ago period.


Short Interest Data & Analysis
The following chart is an aggregate index of “days to cover” among the entire tracking set. Days to cover (DTC) is a measurement determined by dividing the total outstanding short interest by average daily trading volume.
 As indicated in the chart, short interest in DSCI stocks was 5.9 days in mid-August, up from 5.5 days at the end of July and 5.6 days in mid-July. The biggest absolute jump in DTC in mid-August from the end of July for a DSCI component was Tupperware Brand Corporation’s (NYSE: TUP) increase to 8.5 days from 3.3 days.
Short interest can be a difficult indicator to analyze. On the one hand, an increase in short interest can be a bearish sign in that it indicates an increased view among investors that a stock is likely to decline based on any number of factors, such as a belief that the company’s fundamentals are deteriorating or that it has run too far, too fast. On the other hand, as a stock moves higher, a significant short interest can serve as extra fuel on the fire as investors scramble to “buy to cover” their short positions and mitigate losses.
Analyst Sentiment Index
Our Analyst Sentiment Index rose slightly in August from July. The proportion of sell-side analysts maintaining “buy” and “hold” ratings on industry stocks in August was about 91%, up from 90% in July. Conversely, the percentage of stocks which analysts recommended selling was around 9% in August and 10% in July.
 Methodology: The DSCA Analyst Sentiment Index is a consensus tracking tool that aggregates and averages the recommendations of all covering analysts across all public direct selling companies.
 -
July 2024
Brought to you by Direct Selling Capital Advisors
Direct Selling Index Jumps 6.3% in July, Outperforming the DJIA for the Second Straight Month. DSCI Has Posted Gains in Eight of the Last Nine Months.
In July, the Direct Selling Capital Advisors Direct Selling Index (DSCI) posted its eighth monthly gain in the last nine. The index rose 6.3% during the month, outperforming the Dow Jones Industrials Average (DJIA) which added 4.4% in July. Over the first seven months of 2024, the DSCI increased 6.2%, while the DJIA gained 8.4%.
Large cap direct selling stocks as a group dramatically outperformed their smaller cap peers in July. Eight of the nine large components rose during the month, while only three of the seven small cap members posted gains. Furthermore, four large cap DSCI components increased by more than 10% in July, and the one large cap stock which declined (USANA Health Sciences, Inc.) fell by only 1.4%. In contrast, just one small cap member gained by double-digit percentage points during the month, and two fell by more than 10%.
From a longer-term perspective, the DSCI has gained an aggregate 34.4% since its March 1, 2020 inception. The DJIA has outperformed the direct selling index over this period. Since March 1, 2020, the DJIA has increased 60.7%.
The stock market’s solid performance in July was based on some unusual building blocks. Most notably, small caps, a long-neglected group, drove the rally during the month, while the mega-cap tech stocks which had powered market gains over the first six months of 2024 stumbled. More specifically, the S&P SmallCap 600 Index gained 10.7% in July, while the Communications Services and Information Technology sectors of the S&P 500 fell 4.2% and 2.1%, respectively.
The triggering event for the small cap rally during the month seems to have been the July 11th Bureau of Labor Statistics announcement that CPI inflation declined 0.1% in June 2024 from May 2024. In turn, many investors became more confident that the Fed may cut interest rates in September. And since small cap companies are more likely to carry floating rate debt than large companies, they would be primary beneficiaries of such a decision by the central bank.
Some of the dollars which rotated from mega-cap stocks into the shares of smaller companies clearly were invested in the shares of DSCI components. As noted previously, nearly every direct selling stock with a market cap of $100 million or more posted a gain during July. The group has not enjoyed such across-the-board increases for many months.
Looking Forward
The direct selling stocks have mainly completed reporting their 2Q 2024 results, so the performance of DSCA index components this month will probably be dictated by the general direction of the stock market. So far in August, this linkage has proved problematic, as a disappointing July jobs report (released August 2nd) sparked fears of a U.S. recession. In turn, investors decided to sell virtually all stocks — particularly mega-cap tech stocks and shares linked to AI, the strongest investment theme of 1H 2024 — and to ask questions later. Over the three trading days from August 1 through August 5, the DJIA fell 5.2%, its worst three-day loss since June 2022. (Constructively, the DJIA rallied on August 6th, cutting into those losses.)
Over the medium term, a still-plausible scenario is that a soft economic landing, accompanied by falling inflation, can be achieved. The Fed’s cutting interest rates, potentially multiple times over the next few months, is likely a necessary part of this storyline. Taken together, all this could suggest that the recent outperformance of small caps—and therefore direct selling stocks—could prove more of a permanent move than a gap higher that will be retraced in short order. Small caps also rallied in late 2023, but that move was cut short when early 2024 inflation levels proved higher than expected, short circuiting the near-term chances of a Fed rate cut then. Today, inflationary measures have shown improvement for several months, and the Fed seems almost certain to decrease rates soon.
CHARTS & ANALYSIS
Direct Selling Capital Advisors Index
The DSCI is a market capitalization weighted index of all domestic public direct selling companies with a market capitalization of at least $25 million.The index is rebalanced monthly, and no single issue is permitted to represent more than 20% of its total value. In such an event, the excess weighting would be redistributed among the other index components.
The DSCI rose in July and outperformed the DJIA during the month. The DSCI gained 6.3% in July, nearly two full percentage points ahead of the 4.4% increase for the DJIA. DSCI data is tracked back to March 1, 2020. The direct selling index has risen 34.4% since that date versus the 60.7% appreciation of the DJIA over the same period.

Large Cap
Betterware de Mexico (NASDAQ: BWMX) added 2.7% in July, bringing its YTD gain to 7.6%. BWMX’s performance over the first seven months of 2024 made it the third best performing large cap DSCI member over that period. Since the March 1, 2020 DSCI inception, BWMX is up 59.3%.
On July 25, BWMX reported 2Q 2024 consolidated net revenue of 3.39 billion pesos, up 5.3% from 3.22 billion pesos in 2Q 2023. Sales at all three of BWMX’s segments rose in the quarter. On the other hand, the company’s 2Q 2024 EBITDA of 656.1 million pesos was 8.5% lower than in the year-ago period as what is considered a temporary gross margin contraction in 2Q 2024 at Betterware Mexico adversely impacted results.
BWMX expects robust results in the second half of 2024. Consequently, the company reiterated the full-year 2024 net revenue and EBITDA guidance it issued at the beginning of 2024. More specifically, BWMX projects its 2024 revenue will range from 13.8 to 14.4 billion pesos, up from 13.0 billion pesos in 2023. Similarly, the company expects its 2024 EBITDA will increase to 2.9-3.1 billion pesos versus 2.721 billion pesos last year.
BWMX began trading in March 2020 after the company’s merger with SPAC sponsor DD3 Acquisition Corp. BWMX specifically targets the Mexican market; it serves three million households through distributors and associates in approximately 800 communities throughout Mexico.
Nu Skin Enterprises, Inc. (NYSE: NUS) rose 6.5% in July. Nevertheless, NUS is down 42.2% YTD, the second worst mark of any large cap DSCI component. Since the March 2020 establishment of the DSCI, NUS has lost 52.4%. In comparison, the direct selling stock index and the Dow Jones Industrial Average have gained 34.4% and 60.7%, respectively, over this 53-month period.
In early May, NUS reported 1Q 2024 revenue and adjusted EPS of $417.3 million and $0.09, both of which were down from $481.5 million and $0.37, respectively, in the year ago period. Gross margin slipped to 70.5% in 1Q 2024 versus 72.3% in 1Q 2023. NUS’ Rhyz business grew nearly 60% in the quarter versus 1Q 2023, but the company’s Nu Skin core business retreated as the weak macroeconomic environment impacted affiliate and customer growth around the globe. NUS plans to report its 2Q 2024 financial results after the stock market closes on August 8.
For the full-year 2024, NUS projects revenue and non-GAAP EPS of $1.73-$1.87 billion and $0.95-$1.35, respectively. The comparable figures for full year 2023 were $1.97 billion and $1.85, respectively.
Herbalife Nutrition, Inc. (NYSE: HLF) jumped 18.2% in July, marking the third successive month in which HLF was one of the top performing large cap DSCI components. Nevertheless, HLF still lost 19.5% of its value over the first seven months of 2024. Furthermore, the stock is down 62.1% since the establishment of the DSCI on March 1, 2020. This represents the second worst performance for any large-cap DSCI component which has traded continuously since index inception.
On July 30, HLF reported 2Q 2024 sales of $1.28 billion, down 2.5% from $1.31 billion in 2Q 2023. Notably, foreign exchange headwinds caused sales to decline 2.7%, so absent this effect, revenue would have risen slightly. HLF’s adjusted EBITDA reached $180.0 million in 2Q 2024, up from $169.6 million in the year-ago period.
Even more important, HLF’s adjusted EBITDA was its highest figure in seven quarters. A key factor in this improvement: the number of new distributors joining HLF on a worldwide basis increased 12% on a year-over-year basis in 2Q 2024, ending twelve consecutive quarters of year-over-year declines.
HLF implemented further actions related to its organizational restructuring plan in 2Q 2024. The plan should deliver annual savings of at least $80 million beginning in 2025, with $50 million expected to be achieved in 2024. At least $10 million of this amount was realized during 2Q 2024. HLF expects to incur total program pretax expenses of at least $70 million, primarily related to severance expenses.
With the constructive 2Q 2024 results, HLF slightly increased its full-year 2024 adjusted EBITDA guidance to $560 to $600 million, up from $550 to $590 million. On the other hand, HLF downgraded its estimate of full-year revenue growth to a range of negative 3.5% to positive 1.5% from the 0% to positive 5% range it issued on May 1, 2024.
Medifast, Inc. (NYSE: MED) shares inched 0.5% higher in July, slightly cutting its YTD loss to 67.4%, the weakest performance of any DSCI member. Since the March 1, 2020 establishment of the DSCI, MED has declined 72.4%.
On August 5, MED reported 2Q 2024 revenue of $168.6 million, down 43% from $296.2 million in 2Q 2023. The company’s adjusted diluted EPS fell more sharply to $0.92 in 2Q 2024 from $2.77 in the year-ago period. The number of active earning OPTAVIA coaches decreased to 33,900 in 2Q 2024 from 53,100 in 2Q 2023. In addition, the average revenue per active earning OPTAVIA coach was $4,972 in 2Q 2024, down from $5,578 in the year-ago period, driven by continued pressure on customer acquisition. MED expects its 3Q 2024 revenue and adjusted diluted EPS will be $125-$145 million and a loss of $0.05 to a loss of $0.70, respectively.
MED is realigning its business to respond to the evolving dynamics of the weight loss industry and to transform its business model. In May, MED launched the first phase of its multimillion dollar national marketing campaign. The campaign will highlight the GLP-1 Lifestyle Program, a holistic approach to medical weight loss tailored to support the needs of those utilizing GLP-1 medications.
In July, shares of USANA Health Sciences, Inc. (NYSE: USNA) lost 1.4%, which brought USANA’s YTD loss to 16.8%. Since the creation of the DSCI on March 1, 2020, USANA shares have lost 32.5% compared with gains of 34.4% and 60.7% for the direct selling index and the DJIA, respectively.
On July 23, USANA reported 2Q 2024 revenue and diluted EPS of $213 million and $0.54, both down from $238 million and $0.89, respectively, in the year-ago period. Ongoing macroeconomic pressures in several of the company’s key markets continue to impact consumer spending. The strengthening U.S. dollar also hurt 2Q 2024 revenue and earnings. As an offset, USANA plans to offer a more robust promotional calendar over the balance of 2024. Due to the weaker-than-expected 2Q 2024 results, the company reduced its 2024 revenue and diluted EPS forecasts to $850-$880 million and $2.40-$2.55 from prior projections of $850-$920 million and $2.40-$3.00, respectively.
eXp World Holdings, Inc. (NASDAQ: EXPI), the DSCI’s second largest component, soared 27.3% in July, cutting its YTD loss to 7.5%. EXPI shares have appreciated an aggregate 200.4% over the 53 months the DSCI has been computed, the best long-term mark of any DSCI member.
On July 31, EXPI, the fastest growing real estate brokerage in the world, reported 2Q 2024 revenue and adjusted EBITDA of $1.295 billion and $32.8 million, respectively. These measures compared favorably with $1.23 billion and $26.8 million, respectively, in 2Q 2023. The increased productivity of EXPI’s agents translated into higher revenue, offsetting declines in the U.S. real estate market. This, together with improved business efficiencies, allowed 2Q 2024 adjusted EBITDA to rise 22%.
EXPI’s transaction volume in the just-completed quarter increased 7% from 2Q 2023 to $51.9 billion. Agents and brokers on the company’s platform totaled 87,111 as of June 30, 2024, down 1% from June 30, 2023, due primarily to the exit of unproductive agents.
A leading provider of financial services in the U.S. and Canada, and the largest market cap stock in the DSCI, Primerica, Inc. (NYSE: PRI) increased 6.4% in July. Year to date, PRI has gained 22.4%, the second best return for any large cap DSCI component. PRI has increased 129.8% since March 1, 2020, the third best long-term performance for any direct selling stock.
In early May, PRI reported 1Q 2024 revenue of $742.8 million, up 8% from $690.0 million in the year-ago period. The company’s adjusted operating EPS grew at an even faster pace, reaching $3.91 in 1Q 2024 versus $3.57 in 1Q 2023. PRI’s impressive results in the March 2024 quarter reflected the stability of its large in-force block of term life insurance, higher investment product sales, appreciation of client asset values, and the positive impact of higher interest rates on net investment income. PRI plans to release its 2Q 2024 results after the stock market closes on August 7.
On July 16, PRI announced it plans to exit its senior health business by relinquishing ownership of e-TeleQuote Insurance, Inc. The subsidiary, which PRI acquired in July 2021, does not have a clear path toward profitability within an acceptable timeframe in the increasingly challenging senior health distribution market.
Nature’s Sunshine Products, Inc. (NASDAQ: NATR) jumped 13.5% in July, trimming its YTD loss to 1.0%. Over the 53 months the DSCI has been calculated, NATR has gained 120.3%, the fourth best mark of any direct selling index stock over that period.
In early May, NATR, which markets and distributes nutritional and personal care products in more than 40 countries, reported 1Q 2024 net sales of $111.0 million, up 2% from $108.6 million in the year-ago period. Adjusted EBITDA in 1Q 2024 totaled $9.2 million, up slightly from $9.1 million in 1Q 2023. NATR’s North American business grew 5% in 1Q 2024, helped by strong digital sales. On the other hand, inflationary pressures and volatile foreign exchange rates negatively impacted ingredient costs and therefore gross margins. NATR plans to announce 2Q 2024 results after the stock market closes on August 8.
NATR expects its full-year 2024 net sales and adjusted EBITDA to range from $455 to $480 million and $42 to $48 million, respectively. Net sales and adjusted EBITDA in 2023 totaled $445.3 million and $40.4 million, respectively.
LifeVantage Corporation (NASDAQ: LFVN) soared 27.4% in July, the best mark of any DSCI member. This gain boosted LFVN’s YTD gain to 36.3%, the strongest return for any large cap DSCI member. Since the March 1, 2020 establishment of the DSCI, LFVN has declined 31.3%.
In early May, LFVN reported revenue of $48.2 million in 3Q FY 2024 (the quarter ended March 31, 2024), down 10.2% from $53.7 million in the year-ago period. On the other hand, LFVN’s adjusted EBITDA increased in 3Q FY 2024, reaching $5.1 million compared with $3.3 million in 3Q FY 2023. The operating environment remains challenging, impacting LFVN’s revenue, but productivity gains and improving revenue trends per Consultant allowed the company’s adjusted EBITDA to increase in the quarter.
LFVN reduced its revenue guidance for FY 2024 (twelve months ended June 30, 2024) to $202 to $205 million from the prior $207 to $213 million. The company still expects its FY 2024 adjusted EBITDA to range from $16 to $18 million.

 Note: For the purposes of this report, Direct Selling Capital considers companies with a market capitalization in excess of $1 billion “Large Cap.”
Small Cap
Our small cap tracking set underperformed the large cap DSCI group in July. Three small caps rose during the month, three fell, and one was unchanged.
Educational Development Corporation (NASDAQ: EDUC), a publishing company specializing in books for children, posted the best performance (+11.9%) of any small cap DSCI member in July. This appreciation added to EDUC’s DSCI-best YTD gain of 78.4%. In early July, EDUC reported 1Q FY 2025 (quarter ended May 31, 2024) revenue and EPS of $10.0 million and a loss of $0.15 compared with $14.5 million and a loss of 11 cents, respectively, in 1Q FY 2024.


Short Interest Data & Analysis
The following chart is an aggregate index of “days to cover” among the entire tracking set. Days to cover (DTC) is a measurement determined by dividing the total outstanding short interest by average daily trading volume.
 As indicated in the chart, short interest in DSCI stocks was 5.6 days in mid-July, up from 5.3 days at the end of June and 5.5 days in mid-June. The biggest absolute jump in DTC in mid-July from the end of June for a DSCI component was NATR’s increase to 2.4 days from 1.5 days.
Short interest can be a difficult indicator to analyze. On the one hand, an increase in short interest can be a bearish sign in that it indicates an increased view among investors that a stock is likely to decline based on any number of factors, such as a belief that the company’s fundamentals are deteriorating or that it has run too far, too fast. On the other hand, as a stock moves higher, a significant short interest can serve as extra fuel on the fire as investors scramble to “buy to cover” their short positions and mitigate losses.
Analyst Sentiment Index
Our Analyst Sentiment Index fell in July from June. The proportion of sell-side analysts maintaining “buy” and “hold” ratings on industry stocks in July was about 89%, down from 91% in June. Conversely, the percentage of stocks which analysts recommended selling was around 11% in July and 9% in June.
 Methodology: The DSCA Analyst Sentiment Index is a consensus tracking tool that aggregates and averages the recommendations of all covering analysts across all public direct selling companies.
 -
June 2024
Brought to you by Direct Selling Capital Advisors
Direct Selling Index Rises 2.1% in June, Outperforming the DJIA on the Month. DSCI Has Posted Gains in Seven of the Last Eight Months.
The Direct Selling Capital Advisors Direct Selling Index (DSCI) rose 2.1% in June. The index, which has posted gains in seven of the last eight months, outperformed the 1.1% increase registered by the Dow Jones Industrials Average (DJIA) in June. Over the first half of 2024, the DSCI inched down 0.1%, while the DJIA gained 3.8%.
Helped by a 4.7% monthly gain by the DSCI’s largest cap stock, Primerica, Inc. (NYSE: PRI), large cap direct selling stocks as a group outperformed their smaller cap peers for the second consecutive month in June. Three of the nine large components rose during the month, while only one of the seven small cap members posted a gain. Many of the direct selling stocks which declined during the month dropped quite sharply. Four large cap and three small cap components fell by more than 10%. Conversely, no DSCI stock recorded a double digit percentage point increase in June.
From a longer-term perspective, the DSCI has gained an aggregate 26.5% since its March 1, 2020 inception. The DJIA has outperformed the direct selling index over this period. Since March 1, 2020, the DJIA has increased 54.0%.
In June, the stock market has continued to build on the (essentially uninterrupted) rally that commenced in early May. The S&P 500 Index increased 4.8% in June on top of a similar-size gain in May. Tamer than expected May CPI and PPI inflation readings, as well as a Fed policy statement and Chairman Jerome Powell’s tone during his press conference (on June 12th) that pointed to an economic soft landing, have buoyed investor sentiment.
The Fed’s tone, these constructive inflation readings, plus other mainly benign economic releases (moderating retail sales and gently rising jobless claims) have likewise positively affected the bond market. Ten-year Treasury yields dropped from 4.69% at the end of April to 4.34% at the end of June.
Looking Forward
The direct selling stocks will not begin reporting their 2Q 2024 results until late July, so the performance of DSCA index components this month will probably be dictated by the general direction of the stock market. Assuming consumers stay employed and inflation continues to cool, both the economy and the stock market seem likely to continue to gain. The linkage is probably the reason investors are willing to accept delayed (and potentially fewer) Fed rate cuts versus faster and broader expectations just a handful of months ago.
Historically, July has been a very good month for the stock market. Indeed, it has been the best calendar month of the year for stocks. According to Dow Jones Market Data, the S&P 500 Index has gained 1.7% on average in July since 1928. Furthermore, e-trade data shows that the stock market has posted gains in nine of the last ten Julys.
A concern is the narrowing of the stock market rally as the largest tech stocks are again outperforming virtually all other stock groups. However, such a leadership position seems deserved as big-cap tech as a group is posting impressive earnings results, and investors are realizing these stocks are less economically sensitive than they were just a few years ago.
NVIDIA Corporation, probably the most important US stock, and other high-performing, high-valuation leaders like Chipotle Mexican Grill, Inc., have given back some of their outsized 2024 gains over the last two weeks, but that action feels more like conventional profit-taking than the early stages of a correction.
CHARTS & ANALYSIS
Direct Selling Capital Advisors Index
The DSCI is a market capitalization weighted index of all domestic public direct selling companies with a market capitalization of at least $25 million. The index is rebalanced monthly, and no single issue is permitted to represent more than 20% of its total value. In such an event, the excess weighting would be redistributed among the other index components.
The DSCI rose in June and outperformed the DJIA during the month. The DSCI gained 2.1% in June, about one full percentage point ahead of the 1.1% increase for the DJIA. DSCI data is tracked back to March 1, 2020. The direct selling index has risen 26.5% since that date versus the 54.0% appreciation of the DJIA over the same period.

Large Cap
Betterware de Mexico (NASDAQ: BWMX) fell 12.3% in June, reducing its YTD gain to 4.8%. Nevertheless, BWMX’s performance over the first half of 2024 made it the third best performing large cap DSCI member over that period. Since the March 1, 2020 DSCI inception, BWMX is up 55.1%.
In late April, BWMX reported 1Q 2024 consolidated net revenue and EBITDA of 3.60 billion pesos and 755.4 million pesos, up 10.4% and 15.4% from 3.26 billion pesos and 654.6 million pesos, respectively, in 1Q 2023. Growth in BWMX’s Betterware and Jafra brands in Mexico boosted both sales and cash flow in 1Q 2024. Furthermore, EBITDA increased markedly in 1Q 2024 despite a temporary increase in Betterware Mexico’s distribution costs.
Betterware de Mexico transferred its stock listing to the NYSE from the NASDAQ on June 7, 2024. Its symbol, BWMX, remained the same. BWMX believes the NYSE platform, which combines world-class technology with human insight, will create long-term value for its shareholders.
BWMX began trading in March 2020 after the company’s merger with SPAC sponsor DD3 Acquisition Corp. BWMX specifically targets the Mexican market; it serves three million households through distributors and associates in approximately 800 communities throughout Mexico.
Nu Skin Enterprises, Inc. (NYSE: NUS) dropped a DSCI-worst 21.0% in June. This performance brought NUS’s YTD loss to 45.7%, the second worst mark of any large cap DSCI component. Since the March 2020 establishment of the DSCI, NUS is down 55.3%. In comparison, the direct selling stock index and the Dow Jones Industrial Average have gained 26.5% and 54.0%, respectively, over this 52-month period.
In early May, NUS reported 1Q 2024 revenue and adjusted EPS of $417.3 million and $0.09, down from $481.5 million and $0.37, respectively, in the year ago period. Gross margin slipped to 70.5% in 1Q 2024 versus 72.3% in 1Q 2023. NUS’ Rhyz business grew nearly 60% in the quarter versus 1Q 2023, but the company’s Nu Skin core business retreated as the weak macroeconomic environment impacted affiliate and customer growth around the globe.
For the full-year 2024, NUS maintained its sales and non-GAAP EPS forecasts of $1.73-$1.87 billion and $0.95-$1.35, respectively. The comparable figures for full year 2023 are $1.97 billion and $1.85, respectively.
Herbalife Nutrition, Inc. (NYSE: HLF) added 0.9% in June. This marked the second successive month in which HLF was one of the top two performing large cap DSCI components. However, HLF still lost 31.9% of its value over the first half of 2024. Furthermore, the stock is down 67.9% since the establishment of the DSCI on March 1, 2020. This represents the second worst performance for any large-cap DSCI component which has traded continuously since index inception.
In early May, HLF reported 1Q 2024 sales of $1.26 billion, up slightly from $1.25 billion in the year-ago period. The company’s adjusted diluted EPS declined to $0.49 in the just-completed quarter from $0.54 in 1Q 2023. HLF’s 1Q 2024 gross profit margin rose to an impressive 77.5% in 1Q 2024 from 76.2% in 1Q 2023.
In late March, HLF announced a new organizational restructuring plan. It should deliver annual savings of at least $80 million beginning in 2025, with $40 million expected to be achieved in 2024. HLF expects to incur total program pretax expenses of at least $60 million, primarily related to severance expenses.
In late June, HLF appointed e-commerce and media technology executive Perkins Miller to its board of directors. Mr. Miller is the CEO of Fandom, the world’s largest fan platform where fans immerse themselves in imagined worlds across entertainment and gaming.
HLF expects that its 2024 net sales will increase 0% to 5% from $5.062 billion in 2023, and its 2024 adjusted EBITDA will reach $550 to $590 million versus $570.6 million in 2023. The company plans to release its 2Q 2024 financial results after the stock market closes on July 31.
Medifast, Inc. (NYSE: MED) shares dropped 15.2% in June, bringing its YTD loss to 67.5%, the weakest performance of any DSCI member. Since the March 1, 2020 establishment of the DSCI, MED has declined 72.5%.
In late April, MED reported 1Q 2024 revenue of $174.7 million, down 50% from $349.0 million in 1Q 2023. The company’s adjusted diluted EPS fell even more sharply to $0.66 in 1Q 2024 from $3.67 in the year-ago period. The number of active earning OPTAVIA coaches decreased to 37,800 in 1Q 2024 from 58,700 in 1Q 2023. In addition, the average revenue per active earning OPTAVIA coach was $4,623 in 1Q 2024, down from $5,945 in the year-ago period, driven by continued pressure on customer acquisition. MED expects its 2Q 2024 revenue and adjusted diluted EPS will be $150-$170 million and $0.05-$0.40, respectively.
MED is realigning its business to respond to the evolving dynamics of the weight loss industry and to transform its business model. In May, MED launched the first phase of its multimillion-dollar national marketing campaign. The campaign will highlight the GLP-1 Lifestyle Program, a holistic approach to medical weight loss tailored to support the needs of those utilizing GLP-1 medications.
In June, US News and World Report recognized MED as one of the nation’s “Best Companies to Work For” in 2024-2025. This recognition marks MED’s second consecutive year of inclusion on the list.
In June, shares of USANA Health Sciences, Inc. (NYSE: USNA) fell 5.0%, which brought USANA’s YTD loss to 15.6%. Since the creation of the DSCI on March 1, 2020, USANA shares have lost 31.6% compared with gains of 26.5% and 54.0% for the direct selling index and the DJIA, respectively.
In late April, USANA reported 1Q 2024 revenue and diluted EPS of $228 million and $0.86, both down from $248 million and $0.95, respectively, in the year-ago period. USANA posted solid results in China in 1Q 2024 due to a successful sales initiative, but the company’s performance in other markets did not meet management’s expectations. USANA is working to accelerate its business in these markets over the remainder of 2024. Despite a slower-than-expected 1Q 2024, USANA reiterated its full-year 2024 revenue and diluted EPS guidance ranges of $850-$920 million and $2.40-$3.00, respectively.
In June, USANA was approved to join the Direct Selling Association of the Philippines, that country’s national trade association of the companies engaged in the business of direct selling and network marketing. USANA first established a presence in the Philippine market fifteen years ago.
eXp World Holdings, Inc. (NASDAQ: EXPI), the DSCI’s second largest component, inched 0.6% higher in June, cutting its YTD loss to 27.3%. EXPI shares have appreciated an aggregate 136.0% over the 52 months the DSCI has been computed, the best long-term mark of any DSCI member.
In early May, EXPI, the fastest growing real estate brokerage in the world, reported 1Q 2024 revenue and adjusted EBITDA of $943 million and $11.0 million versus $848 million and $14.6 million, respectively, in 1Q 2023. The real estate market remained challenging in 1Q 2024, but increased agent productivity, a rise in average home sales prices, and increased international production allowed EXPI’s revenue to rise in 1Q 2024. Higher operating costs negatively impacted the company’s EBITDA in 1Q 2024.
EXPI’s transaction volume in the just-completed quarter increased 12% to $37.2 billion versus 1Q 2023. Agents and brokers on the company’s platform totaled 85,780 as of March 31, 2024, down 2% from March 31, 2023 due primarily to the exit of unproductive agents.
A leading provider of financial services in the US and Canada, and the largest market cap stock in the DSCI, Primerica, Inc. (NYSE: PRI) increased 4.7% in June, the best mark of any direct selling index member. Year to date, PRI has gained 15.0%, the best return for any large cap DSCI component. Even more important, PRI has increased 115.9% since March 1, 2020, the third best long-term performance for any direct selling stock.
In early May, PRI reported 1Q 2024 revenue of $742.8 million, up 8% from $690.0 million in the year-ago period. The company’s adjusted operating EPS grew at an even faster pace, reaching $3.91 in 1Q 2024 versus $3.57 in 1Q 2023. PRI’s impressive results in the just-completed quarter reflected the stability of its large in-force block of term life insurance, higher investment product sales, appreciation of client asset values, and the positive impact of higher interest rates on net investment income. PRI repurchased about 466,000 of its own shares in 1Q 2024 for $109 million.
Nature’s Sunshine Products, Inc. (NASDAQ: NATR) fell 1.6% in June, bringing its 1H 2024 loss to 12.8%. More constructively, over the 52 months the DSCI has been calculated, NATR has gained 94.1%, the fourth best mark of any direct selling index stock over that period.
In early May, NATR, which markets and distributes nutritional and personal care products in more than 40 countries, reported 1Q 2024 net sales of $111.0 million, up 2% from $108.6 million in the year-ago period. Adjusted EBITDA in 1Q 2024 totaled $9.2 million, up slightly from $9.1 million in 1Q 2023. NATR’s North American business grew 5% in 1Q 2024, helped by strong digital sales. On the other hand, inflationary pressures and volatile foreign exchange rates negatively impacted ingredient costs and therefore gross margins.
NATR continues to expect its full-year 2024 net sales and adjusted EBITDA to range from $455 to $480 million and $42 to $48 million, respectively. Net sales and adjusted EBITDA in 2023 totaled $445.3 million and $40.4 million, respectively.
LifeVantage Corporation (NASDAQ: LFVN) dropped 15.6% in June. This loss trimmed its YTD gain to 7.0%. Since the March 1, 2020 establishment of the DSCI, LFVN has declined 46.1%.
In early May, LFVN reported revenue of $48.2 million in 3Q FY 2024 (the quarter ended March 31, 2024), down 10.2% from $53.7 million in the year-ago period. On the other hand, LFVN’s adjusted EBITDA increased in 3Q FY 2024, reaching $5.1 million compared with $3.3 million in 3Q FY 2023. The operating environment remains challenging, impacting LFVN’s revenue, but productivity gains and improving revenue trends per Consultant allowed the company’s adjusted EBITDA to increase in the quarter.
LFVN reduced its revenue guidance for the full year FY 2024 (twelve months ended June 30, 2024) to $202 to $205 million from the prior $207 to $213 million. The company still expects its FY 2024 adjusted EBITDA to range from $16 to $18 million.

 Note: For the purposes of this report, Direct Selling Capital considers companies with a market capitalization in excess of $1 billion “Large Cap.”
Small Cap
Our small cap tracking set underperformed the large cap DSCI group in June. Only one small cap rose during the month; five fell; and one was unchanged.
Natural Health Trends Corp. (NASDAQ: NHTC), a leading direct-selling and e-commerce company that markets premium quality personal care, wellness, and “quality of life” products, posted the best performance (+2.7%) of any small cap DSCI member in June. This increase added to its impressive YTD gain of 21.2%. In early May, NHTC reported 1Q 2024 revenue and EPS of $11.0 million and $0.02 versus $11.9 million and $0.02, respectively, in 1Q 2023.


Short Interest Data & Analysis
The following chart is an aggregate index of “days to cover” among the entire tracking set. Days to cover (DTC) is a measurement determined by dividing the total outstanding short interest by average daily trading volume.
 As indicated in the chart above, short interest in DSCI stocks was 5.5 days in mid-June, up from 5.3 days at both the end of May and in mid-May. The biggest absolute jump in DTC in mid-June from the end of May for a DSCI component was EXPI’s increase to 19.3 days from 17.6 days.
Short interest can be a difficult indicator to analyze. On the one hand, an increase in short interest can be a bearish sign in that it indicates an increased view among investors that a stock is likely to decline based on any number of factors, such as a belief that the company’s fundamentals are deteriorating or that it has run too far, too fast. On the other hand, as a stock moves higher, a significant short interest can serve as extra fuel on the fire as investors scramble to “buy to cover” their short positions and mitigate losses.
Analyst Sentiment Index
Our Analyst Sentiment Index rose slightly in June from May. The proportion of sell-side analysts maintaining “buy” and “hold” ratings on industry stocks in June was about 91%, up from 90% in May. Conversely, the percentage of stocks which analysts recommended selling was around 9% in June and 10% in May.
 Methodology: The DSCA Analyst Sentiment Index is a consensus tracking tool that aggregates and averages the recommendations of all covering analysts across all public direct selling companies.
 -
May 2024
Brought to you by Direct Selling Capital Advisors
Direct Selling Index Jumps 6.7% in May, Approximately Tripling the 2.3% Gain for the DJIA. DSCI Still Trails the DJIA on a YTD Basis, But the Gap Narrowed in May.
The Direct Selling Capital Advisors Direct Selling Index (DSCI) rose 6.7% in May, its sixth gain in the last seven months. This increase represented a marked outperformance versus the Dow Jones Industrials Average (DJIA), which added 2.3% during May. Over the first five months of 2024, the DSCI fell 2.1%, while the DJIA gained 2.6%.
After April 2024 marked the end of a long streak of large cap DSCI member outperformance versus their smaller cap peers, large cap direct selling stocks as a group reasserted themselves in May. Five of the eight large caps rose in the month, four by more than 10%, while three declined, one by double digit percentage points. Conversely, only three of the eight small cap members gained in May; four lost ground and one was unchanged. Two small caps increased and two fell during the month by more than 10%.
From a longer-term perspective, the DSCI has gained an aggregate 23.9% since its March 1, 2020 inception. The DJIA has outperformed the direct selling index over this period. Since March 1, 2020, the DJIA has increased 52.3%.
After stumbling in April on fears that inflation pressures could be persistent enough that the Federal Reserve may be unable to cut interest rates for some time, the stock market roared back in May (and in the first week of June). As noted above, the DJIA added 2.3% in May. The other major headline indices gained even more: the S&P 500 and the NASDAQ rose 4.8% and 6.9%, respectively, during the month.
The stock market was buoyed, in sequence, in May by: 1) Fed Chairman Powell’s May 1 press conference in which he emphasized that another rate cut this cycle is unlikely and that he expects inflation to continue to come down; 2) a Goldilocks-type April jobs report which included slowing wage increases; and 3) a slight moderation in both consumer and wholesale April inflation readings. In turn, two-year and ten-year Treasury yields each declined about 20 basis points in May.
Another factor which seemed to lift stocks in May was a record quantity of stock buyback announcements. According to Birinyi Associates, a total of 154 companies reported plans to buy back just over $200 billion of their shares during the month. Buybacks have played a major role in the stock market’s strong performance over the first five months of the year. Companies in the S&P 500 Index repurchased $202 billion of their shares in 1Q 2024, the highest mark since $207 billion of repurchases in 3Q 2022.
Looking Forward
The direct selling stocks will not begin reporting their 2Q 2024 results until late July, so the performance of DSCA index components in June will likely be driven by the general direction of the stock market until then. Over the week ended June 7, the headline figures in the May employment report (released June 7), including hourly wage growth, were hotter than expected. On the other hand, ISM manufacturing data for May (released June 3) came in weaker than anticipated. Such macro data releases, together with consumer and wholesale inflation readings, seem likely to continue to be significant market-moving events for some time. The employment and inflation data will likely be key to the interest rate policy statement the Fed releases at the conclusion of its next rate-setting meeting on June 12.
The most likely outcome of all this seems to be a continuation of choppy stock market conditions. Notably, questions about the implications of the upcoming US presidential election and the longer-term direction of Treasury yields and consumer spending may not be resolved for months.
CHARTS & ANALYSIS
Direct Selling Capital Advisors Index
The DSCI is a market capitalization weighted index of all domestic public direct selling companies with a market capitalization of at least $25 million. The index is rebalanced monthly, and no single issue is permitted to represent more than 20% of its total value. In such an event, the excess weighting would be redistributed among the other index components.
The DSCI rose in May and outperformed the DJIA during the month. The DSCI gained 6.7% in May, about triple the 2.3% increase for the DJIA. DSCI data is tracked back to March 1, 2020. The direct selling index has risen 23.9% since that date versus the 52.3% appreciation of the DJIA over the same period.

Large Cap
Betterware de Mexico (NASDAQ: BWMX) inched 1.0% lower in May, cutting its YTD gain to 19.5%. Nevertheless, BWMX’s performance over the first five months of 2024 made it the best performing large cap DSCI member over that period. Since the March 1, 2020 DSCI inception, BWMX is up 76.9%.
In late April, BWMX reported 1Q 2024 consolidated net revenue and EBITDA of 3.60 billion pesos and 755.4 million pesos, up 10.4% and 15.4% from 3.26 billion pesos and 654.6 million pesos, respectively, in 1Q 2023. Growth in BMWX’s Betterware and Jafra brands in Mexico boosted both sales and cash flow in 1Q 2024. Furthermore, EBITDA increased markedly in 1Q 2024 despite a temporary increase in Betterware Mexico’s distribution costs. BWMX projects full year 2024 net revenue of 13.8-14.4 billion pesos, up from 13.01 billion pesos in 2023. Similarly, the company’s EBITDA is expected to grow in 2024, reaching 2.9-3.1 billion pesos compared with 2.72 billion pesos in 2023.
Betterware de Mexico transferred its stock listing to the NYSE from the NASDAQ on June 7, 2024. Its symbol, BWMX, remains the same. BWMX believes the NYSE platform, which combines world-class technology with human insight, will create long-term value for its shareholders.
BWMX began trading in March 2020 after the company’s merger with SPAC sponsor DD3 Acquisition Corp. BWMX specifically targets the Mexican market; it serves three million households through distributors and associates in approximately 800 communities throughout Mexico.
Nu Skin Enterprises, Inc. (NYSE: NUS) rose 13.5% in May, slicing its YTD loss to 31.3%. Since the March 2020 establishment of the DSCI, NUS is down 43.4%. In comparison, the direct selling stock index and the Dow Jones Industrial Average have gained 23.9% and 52.3%, respectively, over this 4 ¼-year period.
On May 8, NUS reported 1Q 2024 revenue and adjusted EPS of $417.3 million and $0.09, down from $481.5 million and $0.37, respectively, in the year ago period. Gross margin slipped to 70.5% in 1Q 2024 versus 72.3% in 1Q 2023. NUS’ Rhyz business grew nearly 60% in the quarter versus 1Q 2023, but the company’s Nu Skin core business retreated as the weak macroeconomic environment impacted affiliate and customer growth around the globe.
For the full-year 2024, NUS maintained its sales and non-GAAP EPS forecasts of $1.73-$1.87 billion and $0.95-$1.35, respectively. The comparable figures for full year 2023 are $1.97 billion and $1.85, respectively.
Herbalife Nutrition, Inc. (NYSE: HLF) popped 19.1% in May, making it the sharpest gaining large cap DSCI component during the month and continuing its volatile recent trading pattern. HLF gained 15.7% in March and fell 13.9% in April before its jump in May. Year to date, HLF has lost 32.5% of its value. Furthermore, the stock is down 68.2% since the establishment of the DSCI 4 ¼ years ago. This represents the worst performance for any large-cap DSCI component which has traded continuously since index inception.
In early May, HLF reported 1Q 2024 sales of $1.26 billion, up slightly from $1.25 billion in the year-ago period. The company’s adjusted diluted EPS declined to $0.49 in the just-completed quarter from $0.54 in 1Q 2023. HLF’s 1Q 2024 gross profit margin rose to a very impressive 77.5% in 1Q 2024 from 76.2% in 1Q 2023.
In late March, HLF announced a new organizational restructuring plan. It should deliver annual savings of at least $80 million beginning in 2025, with $40 million expected to be achieved in 2024. HLF expects to incur total program pretax expenses of at least $60 million, primarily related to severance expenses.
HLF expects that its 2024 net sales will increase 0% to 5% from $5.062 billion in 2023 and its 2024 adjusted EBITDA will reach $550 to $590 million versus $570.6 million in 2023.
Medifast, Inc. (NYSE: MED) shares declined 6.5% in May, bringing its YTD loss to 61.7%, the weakest performance of any DSCI member. Since the March 1, 2020 establishment of the DSCI, MED has declined 67.6%.
In late April, MED reported 1Q 2024 revenue of $174.7 million, down 50% from $349.0 million in 1Q 2023. The company’s adjusted diluted EPS fell even more sharply to $0.66 in 1Q 2024 from $3.67 in the year-ago period. The number of active earning OPTAVIA coaches decreased to 37,800 in 1Q 2024 from 58,700 in 1Q 2023. In addition, the average revenue per active earning OPTAVIA coach was $4,623 in 1Q 2024, down from $5,945 in the year-ago period, driven by continued pressure on customer acquisition.
MED is realigning its business to respond to the evolving dynamics of the weight loss industry and to transform its business model. On May 20, MED launched the first phase of its multimillion-dollar national marketing campaign. The campaign will highlight the GLP-1 Lifestyle Program, a holistic approach to medical weight loss tailored to support the needs of those utilizing GLP-1 medications.
MED expects its 2Q 2024 revenue and adjusted diluted EPS will be $150-$170 million and $0.05-$0.40, respectively.
In May, shares of USANA Health Sciences, Inc. (NYSE: USNA) rose 14.6%, the second best mark of any large cap DSCI component. USANA’s gain in May reduced its YTD loss to 11.2%. Since the creation of the DSCI on March 1, 2020, USANA shares have lost 28.0% compared with gains of 23.9% and 52.3% for the direct selling index and the DJIA, respectively.
In late April, USANA reported 1Q 2024 revenue and diluted EPS of $228 million and $0.86, both down from $248 million and $0.95, respectively, in the year-ago period. USANA posted solid results in China in 1Q 2024 due to a successful sales initiative, but the company’s performance in other markets did not meet management’s expectations. USANA is working to accelerate its business in these markets over the remainder of 2024. Despite the slower-than-expected 1Q 2024, USANA reiterated its full-year 2024 revenue and diluted EPS guidance ranges of $850-$920 million and $2.40-$3.00, respectively.
eXp World Holdings, Inc. (NASDAQ: EXPI), the DSCI’s second largest component, jumped 12.6% in May, cutting its YTD loss to 27.8%. EXPI shares have appreciated an aggregate 134.5% over the 51 months the DSCI has been computed, the best long-term mark of any DSCI member.
In early May, EXPI, the fastest growing real estate brokerage in the world, reported 1Q 2024 revenue and adjusted EBITDA of $943 million and $11.0 million versus $848 million and $14.6 million, respectively, in 1Q 2023. The real estate market remained challenging in 1Q 2024, but increased agent productivity, a rise in average home sales prices, and increased international production allowed EXPI’s revenue to rise in 1Q 2024. Higher operating costs negatively impacted the company’s EBITDA in 1Q 2024.
EXPI’s transaction volume in the just-completed quarter increased 12% to $37.2 billion versus 1Q 2023. Agents and brokers on the company’s platform totaled 85,780 as of March 31, 2024, down 2% from March 31, 2023 due primarily to the exit of unproductive agents.
A leading provider of financial services in the US and Canada, and the largest market cap stock in the DSCI, Primerica, Inc. (NYSE: PRI) increased 6.6% in May, partially reversing a 16.2% decline in April. Year to date, PRI has gained 9.8%. Even more importantly, PRI has increased 106.2% since March 1, 2020, the third best long-term performance for any DSCI component.
On May 6, PRI reported 1Q 2024 revenue of $742.8 million, up 8% from $690.0 million in the year-ago period. The company’s adjusted operating EPS grew at an even faster pace, reaching $3.91 in 1Q 2024 versus $3.57 in 1Q 2023. PRI’s impressive results in the just-completed quarter reflected the stability of its large in-force block of term life insurance, higher investment product sales, appreciation of client asset values, and the positive impact of higher interest rates on net investment income. PRI repurchased about 466,000 of its own shares in 1Q 2024 for $109 million.
Nature’s Sunshine Products, Inc. (NASDAQ: NATR) dropped 21.2% in May, making it the worst performing direct selling index large cap member during the month. With the noticeable drop in May, NATR went from being the best performing large cap DSCI component through the first four months of 2024 (+12.5% through April 2024) to an 11.4% loss for the five months ended May 31, 2024. More constructively, over the 51 months the DSCI has been calculated, NATR has gained 97.3%, the fourth best mark of any direct selling index stock over that period.
On May 7, NATR, which markets and distributes nutritional and personal care products in more than 40 countries, reported 1Q 2024 net sales of $111.0 million, up 2% from $108.6 million in the year-ago period. Adjusted EBITDA in 1Q 2024 totaled $9.2 million, up slightly from $9.1 million in 1Q 2023. NATR’s North American business grew 5% in 1Q 2024, helped by strong digital sales. On the other hand, inflationary pressures and volatile foreign exchange rates negatively impacted ingredient costs and therefore gross margins.
NATR continues to expect its full-year 2024 net sales and adjusted EBITDA to range from $455 to $480 million and $42 to $48 million, respectively. Net sales and adjusted EBITDA in 2023 totaled $445.3 million and $40.4 million, respectively.


Note: For the purposes of this report, Direct Selling Capital considers companies with a market capitalization in excess of $1 billion “Large Cap.”
Small Cap
Our small cap tracking set underperformed the large cap DSCI group in May. Three small caps rose during the month, four fell, and one was unchanged.
Tupperware Brands Corporation (NYSE: TUP), the designer and manufacturer of iconic storage products, posted the best performance (+64.2%) of any DSCI component in May. Nevertheless, TUP is still down 13.0% YTD. Following the engagement of its new auditor, KPMG LLC, in January 2024, TUP has filed 10-Q reports for each of the first three quarters of 2023. Furthermore, TUP announced in April 2024 that it is working to complete the preparation and filing of its 2023 10-K for the year ended December 30, 2023.


Short Interest Data & Analysis
The following chart is an aggregate index of “days to cover” among the entire tracking set. Days to cover (DTC) is a measurement determined by dividing the total outstanding short interest by average daily trading volume.

As indicated in the chart above, short interest in DSCI stocks was 5.3 days in mid-May, flat versus 5.3 days at the end of April, and up from 5.0 days in mid-April. The biggest absolute jump in DTC in mid-May from the end of April for a DSCI component was HLF’s increase to 7.1 days from 5.9 days.
Short interest can be a difficult indicator to analyze. On the one hand, an increase in short interest can be a bearish sign in that it indicates an increased view among investors that a stock is likely to decline based on any number of factors, such as a belief that the company’s fundamentals are deteriorating or that it has run too far, too fast. On the other hand, as a stock moves higher, a significant short interest can serve as extra fuel on the fire as investors scramble to “buy to cover” their short positions and mitigate losses.
Analyst Sentiment Index
Our Analyst Sentiment Index was about flat for a third consecutive month in May. The proportion of sell-side analysts maintaining “buy” and “hold” ratings on industry stocks in March, April and May was about 90% in each month. Conversely, the percentage of stocks which analysts recommended selling was around 10% in each of the last three months.

Methodology: The DSCA Analyst Sentiment Index is a consensus tracking tool that aggregates and averages the recommendations of all covering analysts across all public direct selling companies.
-
April 2024
Brought to you by Direct Selling Capital Advisors
Direct Selling Index Drops 15.6% in April, Ending a Streak of Five Consecutive Monthly Gains. The DSCI Flips from Outperforming the DJIA in 1Q 2024 to Underperforming over the First Four Months of 2024.
The Direct Selling Capital Advisors Direct Selling Index (DSCI) dropped 15.6% in April, abruptly ending a five-month winning streak. The Dow Jones Industrials Average (DJIA) also fell during the month, but its 5.0% decline was much less severe. Over the first four months of 2024, the DSCI is down 8.2%, while the DJIA eked out a 0.3% gain.
In a departure from a pattern that has held for most of the last twelve months, the large cap segment of the DSCI markedly underperformed the small cap group in April. All eight large caps fell during the month, six by more than 10%. Conversely, five of the eight small caps posted gains in April, two declined, and one was unchanged. One small cap component fell by double digit percentage points during the month.
From a longer-term perspective, the DSCI has gained an aggregate 16.1% since its March 1, 2020 inception. The DJIA has outperformed the direct selling index over this period. Since March 1, 2020, the DJIA has increased 48.8%.
Rising geopolitical tensions in the Middle East and consumer and wholesale inflation readings that stay stubbornly high, proved to be hurdles the stock market had difficultly surmounting in April. All market indices struggled. Even seemingly impregnable NVIDIA Corporation shares faced concerted selling in April. At one point, the stock was down 15% during the month—though it cut those losses during the last few trading days of April.
Perhaps the chief impediment to bringing inflation down to an acceptable level is the remarkable and durable strength of the economy. For example, retail sales were up a robust 0.7% in March 2024 (4% on a year-over-basis), and the TSA reports that 8% more people boarded airliners in 1Q 2024 versus the year-ago period (206 million passengers in 1Q 2024 compared with 191 million in 1Q 2023).
In turn, bond investors pushed interest rates higher; the ten-year Treasury yield reached 4.69% at the end of April, up nearly 50 basis points since the end of March. There are obvious positive aspects of this data, but the upshot seems to be that any Fed rate cuts will be delayed until later in 2024 (see below).
Looking Forward
The direct selling stocks have mostly completed reporting their 1Q 2024 results, so the trading patterns of the DSCA index components in May will likely be greatly influenced by the general direction of the overall stock market. Constructively, two major events in late April/early May seem to have reinvigorated investor optimism.
First, at his April 30 news conference, Fed Chairman Powell pushed back against stagflation worries. He noted that while the central bank is not yet prepared to cut interest rates, the Fed does not see the need to increase rates given its “sufficiently restrictive” current monetary policy stance.
Second, the April jobs report, which was released on May 3, had a “Goldilocks” feel—not too hot, not too cold. Employers added 175,000 jobs during the month, and monthly wages increased at a fairly measured 0.2% pace in April, down from a 0.3% increase in March. On a year-over-year basis, wages have grown at a 3.9% rate, the slowest increase in two years. Many investors believe this report effectively eliminates the chance of a near-term rate hike and increases the chances of one or more rate cuts by the end of the year.
CHARTS & ANALYSIS
Direct Selling Capital Advisors Index
The DSCI is a market capitalization weighted index of all domestic public direct selling companies with a market capitalization of at least $25 million. The index is rebalanced monthly, and no single issue is permitted to represent more than 20% of its total value. In such an event, the excess weighting would be redistributed among the other index components.
The DSCI fell in April and underperformed the DJIA during the month. The DSCI lost 15.6% in April versus a 5.0% decrease for the DJIA. DSCI data is tracked back to March 1, 2020. The direct selling index has risen 16.1% since that date, less than the 48.8% appreciation of the DJIA over the same period.

Large Cap
Betterware de Mexico (NASDAQ: BWMX) dropped 15.8% in April; nevertheless, over the first four months of 2024 the stock still gained 20.7%, the best mark of any large cap DSCI member. Since the March 1, 2020 DSCI inception, BWMX is up 78.6%.
On April 25, BWMX reported 1Q 2024 consolidated net revenue and EBITDA of 3.60 billion pesos and 755.4 million pesos, up 10.4% and 15.4% from 3.26 billion pesos and 654.6 million pesos, respectively in 1Q 2023. Growth in BMWX’s Betterware and Jafra brands in Mexico boosted both sales and cash flow in 1Q 2024. Furthermore, EBITDA increased markedly in 1Q 2024 despite a temporary increase in Betterware Mexico’s distribution costs.
BWMX maintained its full-year 2024 guidance ranges. The company projects 2024 net revenue of 13.8-14.4 billion pesos, up from 13.01 billion pesos in 2023. Similarly, the company’s EBITDA is expected to grow in 2024, reaching 2.9-3.1 billion pesos compared with 2.72 billion pesos in 2023.
BWMX began trading in March 2020 after the company’s merger with SPAC sponsor DD3 Acquisition Corp. BWMX specifically targets the Mexican market; it serves three million households through distributors and associates in approximately 800 communities throughout Mexico.
Nu Skin Enterprises, Inc. (NYSE: NUS) lost 15.0% in April, adding to its 39.4% YTD loss. Since the March 2020 establishment of the DSCI, NUS is down 50.2%. In comparison, the direct selling stock index and the Dow Jones Industrial Average have gained 16.1% and 48.8%, respectively, over this 50-month period.
In mid-February, NUS reported 4Q 2023 revenue and adjusted EPS of $488.6 million and $0.37 versus $522.3 million and $0.89, respectively, in 4Q 2022. NUS’s 4Q 2023 results were affected by persistent macroeconomic pressures and disruptions associated with transforming the company’s business. As part of its 4Q 2023 earnings release, NUS slashed its dividend to a $0.24 annualized rate from $1.56.
For the full-year 2024, NUS projects sales and non-GAAP EPS of $1.73-$1.87 billion and $0.95-$1.35, both down from 2023 results of $1.97 billion and $1.85, respectively. The company plans to release its 1Q 2024 financial results after the stock market closes on May 8.
Herbalife Nutrition, Inc. (NYSE: HLF) fell 13.9% in April, reversing its 15.7% gain in March. Year to date, HLF has lost 43.3% of its value. Furthermore, the stock is down 73.3% since the establishment of the DSCI 4+ years ago. This represents the worst performance for any large-cap DSCI component which has traded continuously since index inception.
On May 1, HLF reported 1Q 2024 sales of $1.26 billion, up slightly from $1.25 billion in the year-ago period. This represents HLF’s second consecutive quarter of year-over-year sales growth. The company’s adjusted diluted EPS declined to $0.49 in the just-completed quarter from $0.54 in 1Q 2023. HLF’s 1Q 2024 gross profit margin rose to a very impressive 77.5% in 1Q 2024 from 76.2% in 1Q 2023.
On March 20, HLF announced a new organizational restructuring plan. It should deliver annual savings of at least $80 million beginning in 2025, with $40 million expected to be achieved in 2024. HLF expects to incur total program pretax expenses of at least $60 million, primarily related to severance expenses.
HLF reaffirmed that its 2024 net sales will increase 0% to 5% from $5.062 billion in 2023 and raised its projected 2024 adjusted EBITDA range by $10 million to $550 to $590 million versus $570.6 million in 2023.
Medifast, Inc. (NYSE: MED) shares dropped a DSCI-worst 28.2% in April. This brought its YTD loss to 59.0%, also the weakest performance of any DSCI member. Since the March 1, 2020 establishment of the DSCI, MED has declined 65.4%.
On April 29, MED reported 1Q 2024 revenue of $174.7 million, down 50% from $349.0 million in 1Q 2023. The company’s adjusted diluted EPS fell even more sharply to $0.66 in 1Q 2024 from $3.67 in the year-ago period. The number of active earning OPTAVIA coaches decreased to 37,800 in 1Q 2024 from 58,700 in 1Q 2023. In addition, the average revenue per active earning OPTAVIA coach was $4,623 in 1Q 2024, down from $5,945 in the year-ago period, driven by continued pressure on customer acquisition.
MED is realigning its business to respond to the evolving dynamics of the weight loss industry and to transform its business model. The company expects its 2Q 2024 revenue and adjusted diluted EPS will be $150-$170 million and $0.05-$0.40, respectively.
USANA Health Sciences, Inc. (NYSE: USNA) lost 14.4% in April, bringing its YTD loss to 22.5%. Since the creation of the DSCI on March 1, 2020, USANA shares have lost 37.2% compared with gains of 16.1% and 48.8% for the direct selling index and the DJIA, respectively.
On April 30, USANA reported 1Q 2024 revenue and diluted EPS of $228 million and $0.86, both down from $248 million and $0.95, respectively, in the year-ago period. USANA posted solid results in China in 1Q 2024 due to a successful sales initiative, but the company’s performance in other markets did not meet internal expectations. USANA is working to accelerate its business in these markets over the remainder of 2024. Despite the slower-than-expected 1Q 2024, USANA reiterated its full-year 2024 revenue and diluted EPS guidance ranges of $850-$920 million and $2.40-$3.00, respectively.
eXp World Holdings, Inc. (NASDAQ: EXPI), the DSCI’s second largest component, fell 3.6% in April. Despite the decline, EXPI was the best performing large cap DSCI member during the month, as the direct selling index lost 15.6% in April. YTD, EXPI is down 35.8%. More constructively, EXPI shares have appreciated an aggregate 108.4% over the 50 months the DSCI has been computed.
On May 1, EXPI, the fastest growing real estate brokerage in the world, reported 1Q 2024 revenue and adjusted EBITDA of $943 million and $11.0 million versus $848 million and $14.6 million, respectively, in 1Q 2023. The real estate market remained challenging in 1Q 2024, but increased agent productivity, a rise in average home sales prices, and increased international production allowed EXPI’s revenue to rise in 1Q 2024. Higher operating costs negatively impacted the company’s EBITDA in 1Q 2024.
EXPI’s transaction volume in the just-completed quarter increased 12% to $37.2 billion versus 1Q 2023. Agents and brokers on the company’s platform totaled 85,780 as of March 31, 2024, down 2% from March 31, 2023 due primarily to the exit of unproductive agents.
A leading provider of financial services in the U.S. and Canada, and the largest market cap stock in the DSCI, Primerica, Inc. (NYSE: PRI) fell 16.2% in April, slicing its YTD gain to 3.0%. Despite its marked drop in April, PRI has increased 93.4% since March 1, 2020, the fourth best mark of any DSCI component.
On May 6, PRI reported 1Q 2024 revenue of $742.8 million, up 8% from $690.0 million in the year-ago period. The company’s adjusted operating EPS grew at an even faster pace, reaching $3.91 in 1Q 2024 versus $3.57 in 1Q 2023.PRI’s impressive results in the just-completed quarter reflected the stability of its large in-force block of term life insurance, higher investment product sales, appreciation of client asset values, and the positive impact of higher interest rates on net investment income. PRI repurchased about 466,000 of its own shares in 1Q 2024 for $109 million.
Nature’s Sunshine Products, Inc. (NASDAQ: NATR) fell 6.4% in April. Over the first four months of 2024, NATR appreciated 12.5%, the best performance of any large cap DSCI member. Furthermore, over the 50 months the DSCI has been calculated, NATR has gained 150.5%, the best mark of any direct selling index stock over that period.
In mid-March, NATR, which markets and distributes nutritional and personal care products in more than 40 countries, reported 4Q 2023 net sales of $108.9 million, up 6% from $102.7 million in the year-ago period. Adjusted EBITDA increased at a faster pace reaching $9.7 million in 4Q 2023, up 21% from $8.0 million in 4Q 2022.
NATR expects its full-year 2024 net sales and adjusted EBITDA to range from $465 to $480 million and $42 to $48 million, respectively. Net sales and adjusted EBITDA in 2023 totaled $445.3 million and $40.4 million, respectively.
NATR plans to release its 1Q 2024 financial results after the stock market closes on May 7.


Note: For the purposes of this report, Direct Selling Capital considers companies with a market capitalization in excess of $1 billion “Large Cap.”
Small Cap
Our small cap tracking outperformed the large cap DSCI group in March. Five small caps rose during the month, two fell, and one was unchanged.
Educational Development Corporation (NASDAQ: EDUC), a publishing company specializing in books and educational products for children, posted both the best April 2024 and YTD stock performance of any DSCI component, gaining 4.3% and 86.2%, respectively, over those periods. In mid-January 2024, EDUC reported 3Q FY 2024 (quarter ended November 30, 2023) revenue and pretax earnings of $16.9 million and $2.7 million versus $30.3 million and just above breakeven, respectively, in 3Q FY 2023. EDUC will report its 4Q FY 2024 results on May 21.


Short Interest Data & Analysis
The following chart is an aggregate index of “days to cover” among the entire tracking set. Days to cover (DTC) is a measurement determined by dividing the total outstanding short interest by average daily trading volume.

As indicated in the chart above, short interest in DSCI stocks was 5.0 days in mid-April, down from 5.4 days at both the end of March and in mid-March. The biggest absolute decrease in DTC to mid-April from the end of March for a DSCI component was PRI’s decline to 2.2 days from 3.0 days.
Short interest can be a difficult indicator to analyze. On the one hand, an increase in short interest can be a bearish sign in that it indicates an increased view among investors that a stock is likely to decline based on any number of factors, such as a belief that the company’s fundamentals are deteriorating or that it has run too far, too fast. On the other hand, as a stock moves higher, a significant short interest can serve as extra fuel on the fire as investors scramble to “buy to cover” their short positions and mitigate losses.
Analyst Sentiment Index
Our Analyst Sentiment Index was about flat in April versus March. The proportion of sell-side analysts maintaining “buy” and “hold” ratings on industry stocks in both months was about 90%. Conversely, the percentage of stocks which analysts recommended selling was around 10% in both March and April.

Methodology: The DSCA Analyst Sentiment Index is a consensus tracking tool that aggregates and averages the recommendations of all covering analysts across all public direct selling companies.
-
March 2024
Brought to you by Direct Selling Capital Advisors
Direct Selling Index Increased 2.5% in March, Marking its Fifth Consecutive Monthly Gain. The DSCI Outperformed the DJIA Both in March and the First Quarter of 2024.
The Direct Selling Capital Advisors Direct Selling Index (DSCI) rose for a fifth successive month in March, gaining 2.5%. Furthermore, the index modestly outperformed the Dow Jones Industrials Average (DJIA), which registered a 2.2% increase during the month. Over the first three months of 2024, the DSCI and DJIA gained 8.7% and 5.6%, respectively.
Both large and small cap members of the DSCI performed well in March. Six large caps in the direct selling index rose during the month, while only two fell. Similarly, four small components gained ground in the last month of the first quarter, two fell, and two were unchanged. Consistent with recent trading patterns, the direct selling stocks were quite volatile in March. Nine of the 16 stocks moved by more than 10% during the period: seven rose and two fell by double figure percentage points.
From a longer-term perspective, the DSCI has gained an aggregate 37.6% since its March 1, 2020 inception. However, the DJIA has outperformed the direct selling index over this period. Since March 1, 2020, the DJIA has increased 56.7%.
Federal Reserve Chairman Jerome Powell provided a big assist to what seemed to be a faltering stock market in mid-March with his press conference remarks after the Central Bank’s March 20th rate setting meeting. The Fed kept its key overnight interest rate at 5.25%-5.50%, but its updated “dot plot” still pointed to three 25-basis point (bp) rate cuts in 2024. After the January and February 2024 CPI reports which showed hotter than expected core inflation, many investors had feared the rate-setting body would signal fewer (and later) rate reductions this year.
Instead, Chairman Powell adopted a dovish tone at his press conference with financial journalists on that date. He thinks the January and February data points were merely “bumps” on the path to a 2% inflation goal. (On April 9, the U.S Bureau of Labor Statistics reported that CPI inflation increased more rapidly than expected for a third consecutive month in March; it is not clear if this changes Mr. Powell’s views.). Equally important, he did not cite robust equity markets, a continued strong labor market, or recent data showing housing prices starting to rise again as reasons to defer cutting rates. Indeed, the Fed still expects 75 bp of rate cuts this year after raising its 2024 GDP growth forecast to 2.1% from its December estimate of just 1.4%.
To further reinforce the Fed’s determination to ease monetary policy, Chairman Powell said the Fed will likely soon slow the pace of its balance sheet reduction program (quantitative tightening). The Fed’s current holdings total around $7.5 trillion, down from a peak of $9 trillion in April 2022.
Looking Forward
The direct selling stocks will start reporting their 1Q 2024 results late this month. Until then, the trading patterns of the DSCA index components will likely be greatly influenced by the general direction of the overall stock market. And that likely direction still seems higher—despite declines in the major indices over the first seven trading days of April.
Most importantly, the Fed seems determined to be friendly for stocks. As Mizuho economists wrote in their summary of the Fed meeting, “Policymakers really, really, really want to cut rates, and it is not a matter of if, but how soon.” As a side note, the European Central Bank and the Bank of England also seem poised to cut interest rates. Based on all this, and emphasizing how central a factor Fed policy has become for the US (and global) stock markets, the medium-term outlook for stock market still looks constructive.
CHARTS & ANALYSIS
Direct Selling Capital Advisors Index
The DSCI is a market capitalization weighted index of all domestic public direct selling companies with a market capitalization of at least $25 million. The index is rebalanced monthly, and no single issue is permitted to represent more than 20% of its total value. In such an event, the excess weighting would be redistributed among the other index components.
The DSCI rose in March and outperformed the DJIA during the month. The DSCI gained 2.5% in March versus a 2.2% increase for the DJIA. DSCI data is tracked back to March 1, 2020. The direct selling index has risen 37.6% since that date, less than the 56.7% appreciation of the DJIA over the same period.
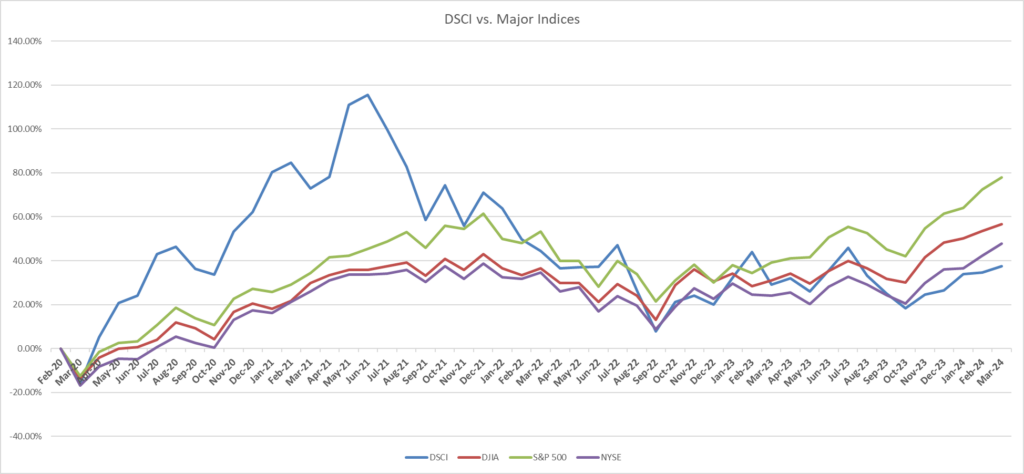
Large Cap
Betterware de Mexico (NASDAQ: BWMX) jumped 15.3% in March. This performance was especially impressive as it came on the heels of a 22.9% gain in February. BWMX boasts the strongest YTD performance (+43.3%) of any large cap DSCI member. Since the March 1, 2020 DSCI inception, BWMX is up 112.1%.
In late February, BWMX reported 4Q 2023 consolidated net revenue and EBITDA of 3.40 billion pesos and 819.5 million pesos, up 5.2% and 36.7% from 3.23 billion pesos and 599.3 million pesos, respectively, in 4Q 2022. The company’s impressive results were supported by growth in both the Betterware and Jafra brands in Mexico. BWMX’s EBITDA margin jumped to 24.1% in 4Q 2023 from 18.5% in 4Q 2022.
BWMX projects full-year 2024 net revenue of 13.8-14.4 billion pesos, up from 13.01 billion pesos in 2023. Similarly, the company’s EBITDA is expected to grow in 2024, reaching 2.9-3.1 billion pesos compared with 2.72 billion pesos in 2023.
BWMX began trading in March 2020 after the company’s merger with SPAC sponsor DD3 Acquisition Corp. BWMX specifically targets the Mexican market; it serves three million households through distributors and associates in approximately 800 communities throughout Mexico.
Nu Skin Enterprises, Inc. (NYSE: NUS) rose 11.7% in March, partially reversing a 33.3% decline in February and cutting its YTD loss to 28.8%. Since the March 2020 establishment of the DSCI, NUS is down 41.4%. In comparison, the direct selling stock index and the Dow Jones Industrial Average have gained 37.6% and 56.7%, respectively, over this period.
In mid-February, NUS reported 4Q 2023 revenue and adjusted EPS of $488.6 million and $0.37 versus $522.3 million and $0.89, respectively, in 4Q 2022. NUS’s 4Q 2023 results were affected by persistent macroeconomic pressures and disruptions associated with transforming the company’s business. As part of its 4Q 2023 earnings release, NUS slashed its quarterly dividend (which was paid March 6) to $0.06 per share ($0.24 annualized) from $0.39, or $1.56 on an annual basis.
For the full-year 2024, NUS projects sales and non-GAAP EPS of $1.73-$1.87 billion and $0.95-$1.35, both down from 2023 results of $1.97 billion and $1.85, respectively. The company plans to release its 1Q 2024 financial results on May 8.
Herbalife Nutrition, Inc. (NYSE: HLF) jumped 15.7% in March. This gain cut HLF’s YTD loss to 34.1%. Nevertheless, the stock is down 68.9% since the establishment of the DSCI 4+ years ago. This represents the worst performance for any large-cap DSCI component which has traded continuously since index inception.
In mid-February, HLF reported 4Q 2023 net sales of $1.22 billion, up slightly from $1.18 billion in the year-ago period. The company’s adjusted diluted EPS declined to $0.28 in the just-completed quarter from $0.53 in 4Q 2022. HLF’s Chairman and CEO Michael Johnson says management continues to maintain “a sharp focus on top-line growth and margin expansion for 2024.” HLF’s Transformation Program, which was initiated in 2021 to strategically optimize the company’s global business processes, delivered about $70 million of cost savings in 2023, about $27 million of which was realized in 4Q 2023. HLF now expects the program to deliver total run-rate savings of at least $115 million in 2024.
On March 20, HLF re-appointed John DeSimone to the position of CFO, succeeding Alex Amezquita, who will remain with the company. Mr. DeSimone had previously been HLF’s CFO over the period 2010-2018.
Also on March 20, HLF said that it is observing sufficient stability in its business to allow the company to introduce sales and adjusted EBITDA guidance for 2024. HLF expects its 2024 net sales to increase 0% to 5% from $5.062 billion in 2023 and projects that its 2024 adjusted EBITDA will range from $540 to $580 million versus $570.6 million in 2023. HLF will report its 1Q 2024 results on May 1.
On April 1, HLF announced plans to offer $700 million of senior secure notes which mature in 2029. The proceeds from the sale will be used partly to repay other indebtedness and partly for general corporate purposes.
Medifast, Inc. (NYSE: MED) shares dropped 5.5% in March, bringing its YTD loss to 43.0%, the weakest 1Q 2024 performance of any DSCI member. Since the March 1, 2020 establishment of the DSCI, MED has declined 51.8%.
In late February, MED reported 4Q 2023 revenue of $191.0 million, down from $337.2 million in 4Q 2022. Similarly, diluted EPS in the fourth quarter fell to $1.09 from $2.41 in the year-ago period. The average revenue per active earning OPTAVIA coach was $4,658 in 4Q 2023, down from $5,538 in the year-ago period, driven by continued pressure on customer acquisition.
MED is realigning its business to respond to the evolving dynamics of the weight loss industry and to transform its business model. The company expects its 1Q 2024 revenue and diluted EPS will be $155-$175 million and $0.25-$0.95, respectively.
SANA Health Sciences, Inc. (NYSE: USNA) inched 0.9% higher in March, cutting its YTD loss to 9.5%. Since the creation of the DSCI on March 1, 2020, USANA shares have lost 26.6% compared with gains of 37.6% and 56.7% for the direct selling index and the DJIA, respectively.
In early February, USANA reported 4Q 2023 revenue and diluted EPS of $221 million and $0.87 versus $228 million and $0.66, respectively, in the year-ago period. USANA’s 4Q 2023 results exceeded management’s expectations as sales strengthened in response to a global incentive offering that was especially effective in China. In 4Q 2023, the number of USANA’s Chinese active customers increased by double-digit percentage points from 3Q 2023.
USANA estimates that full-year 2024 revenue and diluted EPS will be in the ranges of $850-$920 million and $2.40-$3.00, respectively. These figures assume that economic conditions in many of the company’s markets remain challenging this year. USANA will release its 1Q 2024 earnings on April 30.
eXp World Holdings, Inc. (NASDAQ: EXPI), the DSCI’s second largest component, fell 18.5% in March. With this decline, EXPI lost 33.4% of its value in 1Q 2024. More constructively, EXPI shares have appreciated an aggregate 116.1% over the 49 months the DSCI has been computed.
In late February, EXPI, the fastest growing real estate brokerage in the world, reported 4Q 2023 revenue and adjusted EBITDA of $983 million and $0.5 million versus $933 million and $3.6 million, respectively, in 4Q 2022. Despite a difficult real estate market, EXPI gained market share in 4Q 2023 and maintained positive adjusted EBITDA during the period.
EXPI’s transaction volume in the just-completed quarter increased 3% to $38.9 billion versus 4Q 2022. Agents and brokers on the company’s platform totaled 87,515 as of year-end 2023, up 2% from December 31, 2022. In the full-year 2023, EXPI paid its agents a total of $232.6 million in revenue share and equity benefits through its compensation framework.
A leading provider of financial services in the US and Canada, and the largest market cap stock in the DSCI, Primerica, Inc. (NYSE: PRI) rose 3.1% in March, adding to its YTD gain of 22.9%. Since March 1, 2020, PRI has increased 130.9%, the second best mark of any DSCI component.
In mid-February, PRI reported 4Q 2023 adjusted operating revenue of $724.3 million, about 6% higher than $684.5 million in the year-ago period. Furthermore, the company’s adjusted operating EPS reached $4.25 in 4Q 2023, a 9% increase from $3.89 in 4Q 2022. PRI’s impressive 4Q 2023 results were boosted by the company’s large and stable block of in-force life insurance policies, higher investment product sales, a growth in the size of its investment portfolio, and an increase in interest rates.
Nature’s Sunshine Products, Inc. (NASDAQ: NATR) was the best performing DSCI component in March, rising 17.8%. Over the first three months of 2024, NATR appreciated 20.1%. Furthermore, over the 49 months the DSCI has been calculated, NATR gained 167.5%, making it the best performing direct selling index stock over that period.
On March 12, NATR. which markets and distributes nutritional and personal care products in more than 40 countries, reported 4Q 2023 net sales of $108.9 million, up 6% from $102.7 million in the year-ago period. Adjusted EBITDA increased at a faster pace, reaching $9.7 million in 4Q 2023, up 21% from $8.0 million in 4Q 2022. The positive momentum in NATR’s business continued in 4Q 2023, as sales in North America increased by nearly 13% and net income more than tripled to $9.3 million.
NATR expects its full-year 2024 net sales and adjusted EBITDA to range from $465 to $480 million and $42 to $48 million, respectively. Net sales and adjusted EBITDA in 2023 totaled $445.3 million and $40.4 million, respectively.
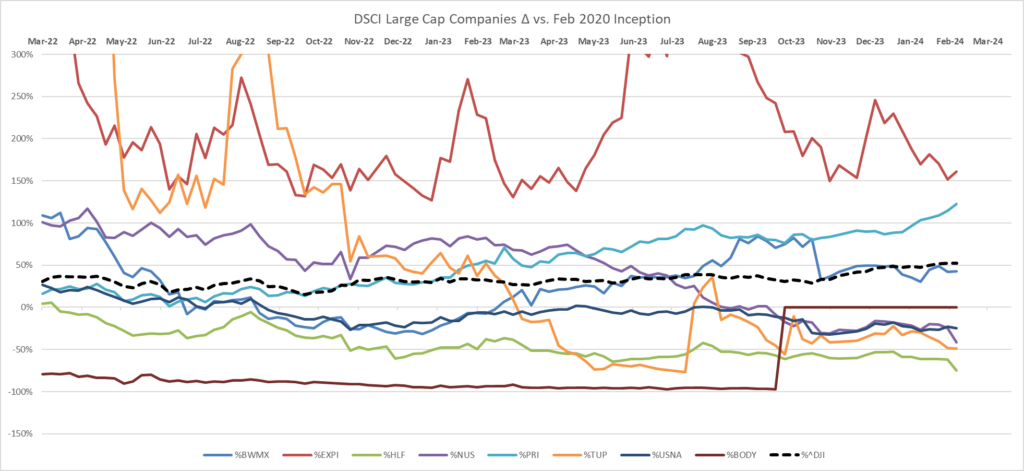
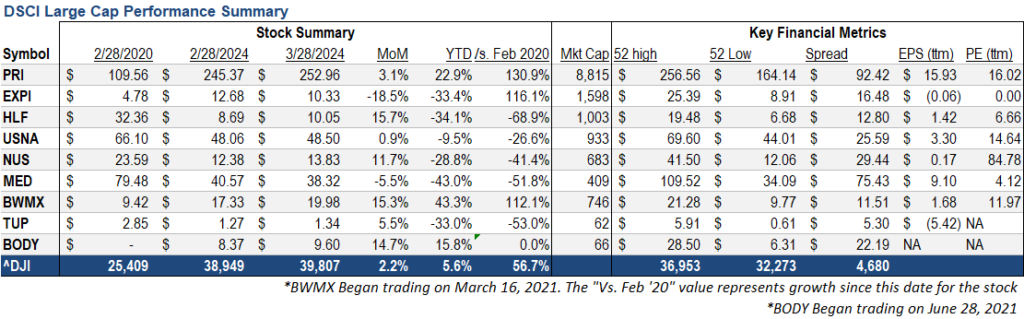 Note: For the purposes of this report, Direct Selling Capital considers companies with a market capitalization in excess of $1 billion “Large Cap.”
Small Cap
Our small cap tracking performed about in line with the large cap DSCI group in March. Four small caps rose during the month, two fell, and two were unchanged. Four of the eight small cap stocks moved by double-digit percentage points (three up and one down) in the final month of the first quarter.
Educational Development Corporation (NASDAQ: EDUC), a publishing company specializing in books and educational products for children, posted the best 1Q 2024 stock performance of any DSCI component, gaining 78.4%. In mid-January 2024, EDUC reported 3Q FY 2024 (quarter ended November 30, 2023) revenue and pretax earnings of $16.9 million and $2.7 million versus $30.3 million and just above breakeven, respectively, in 3Q FY 2023.
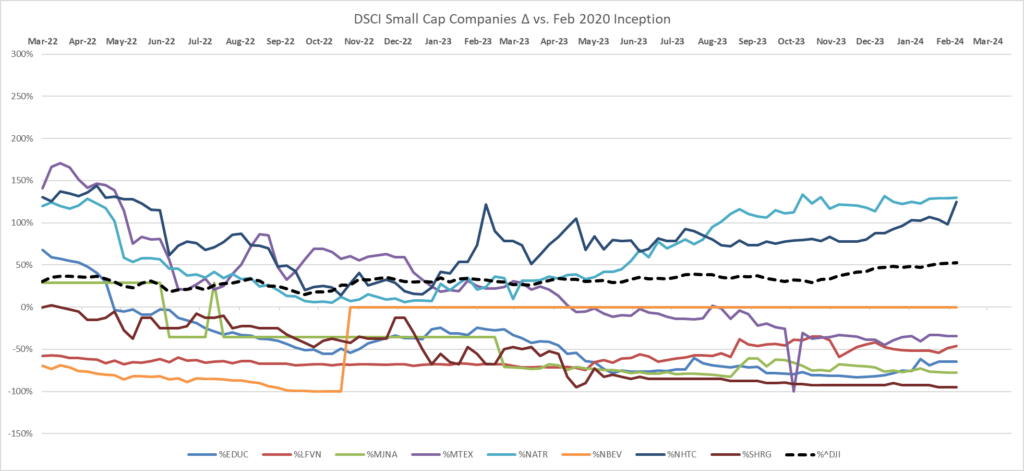
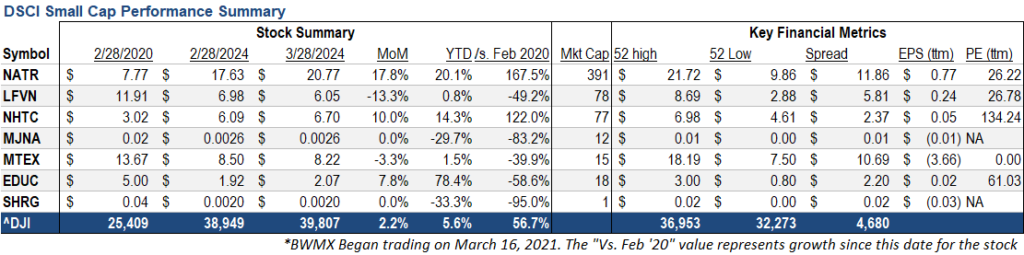
Short Interest Data & Analysis
The following chart is an aggregate index of “days to cover” among the entire tracking set. Days to cover (DTC) is a measurement determined by dividing the total outstanding short interest by average daily trading volume.
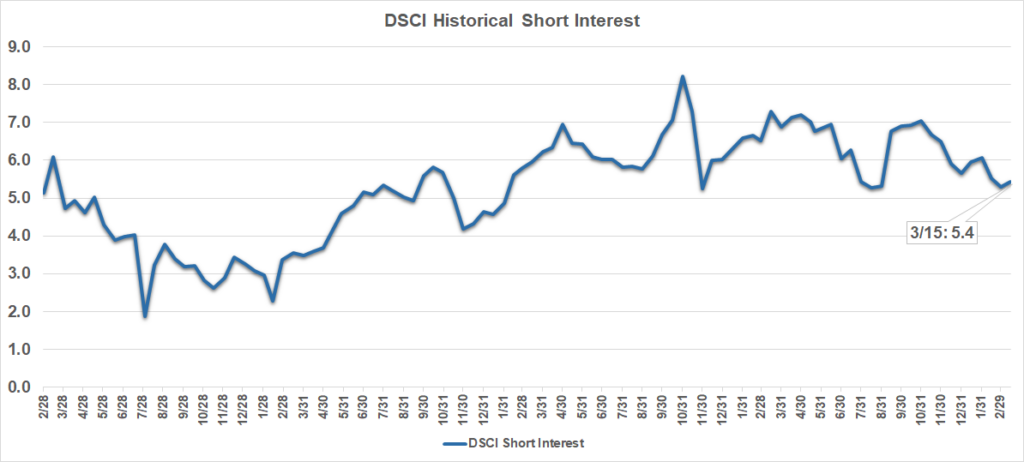 As indicated in the chart above, short interest in DSCI stocks was 5.4 days in mid-March, up from 5.3 days at the end of February and down slightly from 5.5 days in mid-February. The biggest absolute increase in DTC to mid-March from the end of February for a DSCI component was USANA’s increase to 3.3 days from 2.2 days.
Short interest can be a difficult indicator to analyze. On the one hand, an increase in short interest can be a bearish sign in that it indicates an increased view among investors that a stock is likely to decline based on any number of factors, such as a belief that the company’s fundamentals are deteriorating or that it has run too far, too fast. On the other hand, as a stock moves higher, a significant short interest can serve as extra fuel on the fire as investors scramble to “buy to cover” their short positions and mitigate losses.
Analyst Sentiment Index
Our Analyst Sentiment Index declined in March from February. The proportion of sell-side analysts maintaining “buy” and “hold” ratings on industry stocks was about 90% in March and 97% in February. Conversely, the percentage of stocks which analysts recommended selling was 10% and 3% in March and February, respectively.
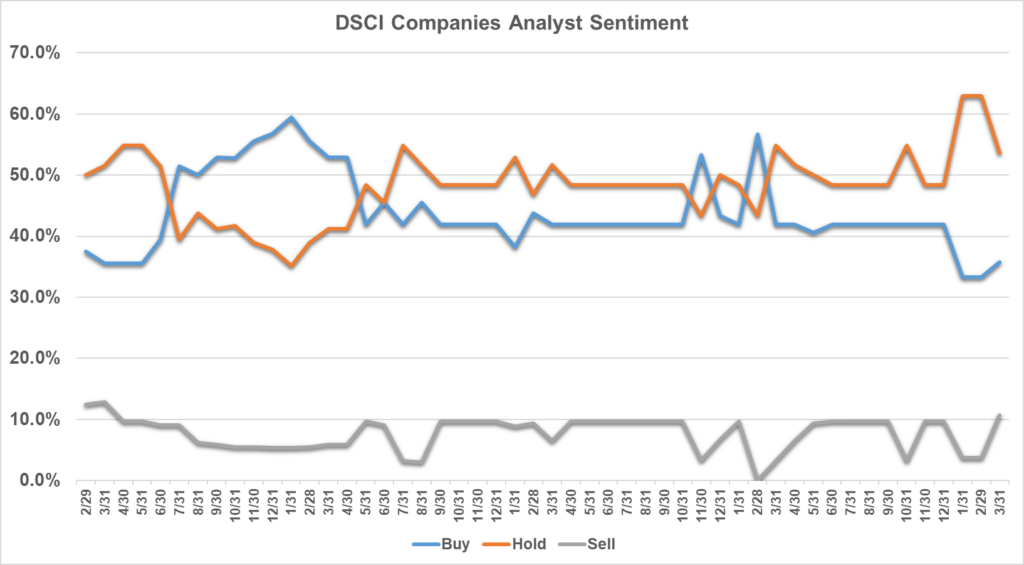 Methodology: The DSCA Analyst Sentiment Index is a consensus tracking tool that aggregates and averages the recommendations of all covering analysts across all public direct selling companies.
 -
February 2024
Brought to you by Direct Selling Capital Advisors
Direct Selling Index Increased 0.3% in February, Marking Its Fourth Consecutive Monthly Gain. The DSCI Underperformed the DJIA in February but Has Handily Outperformed It over the First Two Months of 2024.
The Direct Selling Capital Advisors Direct Selling Index (DSCI) rose for the fourth successive month in February. The index eked out a 0.3% gain during the month but underperformed the Dow Jones Industrials Average (DJIA), which registered a 2.1% increase in February. Over the first two months of 2024, the DSCI and DJIA have risen 6.1% and 3.3%, respectively.
The large cap members of the DSCI generally outperformed their small cap peers in February. Five of the eight large caps in the direct selling index rose during the month, while only two of the eight smaller cap DSCI stocks registered gains. Interestingly, the direct selling stocks were quite volatile in February. Nine of the 16 stocks moved by more than 10% during the period; three rose and six fell by double figure percentage points.
From a longer-term perspective, the DSCI has gained an aggregate 34.3% since its March 1, 2020 inception. However, the DJIA has outperformed the direct selling index over this period; since March 1, 2020, the DJIA has increased 53.3%.
The stock market’s relentless advance paused in mid-February after a period when all major indices posted gains in 14 of 15 weeks. Hotter than expected January consumer and wholesale inflation readings released during the week of February 12th-16th caused investors to recalibrate their expectations of both the number of Fed rate cuts this year and the timing of these reductions.
However, NVIDIA Corporation’s blockbuster quarterly earnings report which was released on February 21, reinvigorated investor confidence, which in turn has fueled a stock market rally to near all-time highs on all major indices. Some of the highest risk industry groups, including semiconductor manufacturers and homebuilders, continue to lead the stock market’s advance.
Looking Forward
Almost all the direct selling stocks have reported their 4Q 2023 earnings, so their performance in March will be heavily impacted by the performance of the overall stock market. After the market’s remarkable run—the S&P 500 Index is up around 25% since late October 2023. It is possible that a short-term reversal could be just around the corner. Nevertheless, key economic and consumer sentiment trends remain quite favorable, and the stock market seems unlikely to correct significantly until these statistics begin to roll over. More specifically, while still too high at 3.9%, the most recent annual Consumer Price Index (CPI) ex-food and energy has consistently declined after peaking at 5.7% in December 2022. Annual wage growth, 5% in January 2024, remains high; and the February jobless report (non-farm payrolls increased by 275,000 but the unemployment rate rose to 3.9%) had a Goldilocks feel to it. Finally, the Index of Consumer Sentiment computed by the University of Michigan is 79.6, up markedly from 61.3 in November 2023 and a cycle low of 50 in June 2022.
Moreover, recent anecdotal evidence looks supportive for the market. For example, many economically sensitive regional banks reported solid 4Q 2023 earnings results, and a host of companies successfully raised funds via bond and loan issuances in January. Indeed, January 2024 corporate bond issuances of $189 billion represented the largest total ever recorded in the first month of any year, according to Bloomberg News.
CHARTS & ANALYSIS
Direct Selling Capital Advisors Index
The DSCI is a market capitalization weighted index of all domestic public direct selling companies with a market capitalization of at least $25 million. The index is rebalanced monthly, and no single issue is permitted to represent more than 20% of its total value. In such an event, the excess weighting would be redistributed among the other index components.
The DSCI rose in February but underperformed the DJIA during the month. The DSCI gained 0.3% in February versus a 2.1% increase for the DJIA. DSCI data is tracked back to March 1, 2020. The direct selling index has risen 34.3% since that date, less than the 53.3% appreciation of the DJIA over the same period.
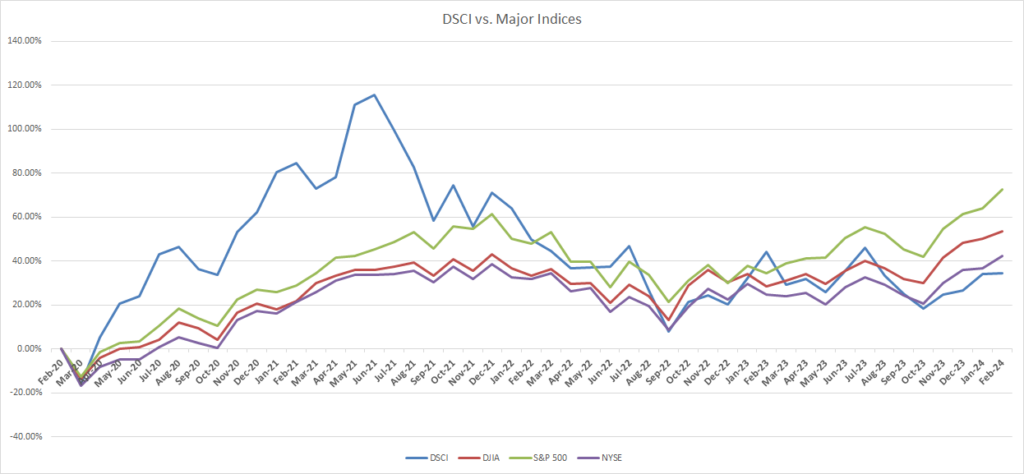
Large Cap
Betterware de Mexico (NASDAQ: BWMX) soared 22.9% in February, making it by far the best performing large cap DSCI component during the month. BWMX likewise boasts the strongest YTD performance (+24.3%) of the large cap DSCI members. Since the March 1, 2020 DSCI inception, BWMX is up 84.0%.
On February 22, BWMX reported 4Q 2023 consolidated net revenue and EBITDA of 3.40 billion pesos and 819.5 million pesos, up 5.2% and 36.7% from 3.23 billion pesos and 599.3 million pesos, respectively, in 4Q 2022. The company’s impressive results were supported by growth in both the Betterware and Jafra brands in Mexico. BWMX’s EBITDA margin jumped to 24.1% in 4Q 2023 from 18.5% in 4Q 2022.
BWMX projects full-year 2024 net revenue of 13.8-14.4 billion pesos, up from 13.01 billion pesos in 2023. Similarly, the company’s EBITDA is expected to grow in 2024, reaching 2.9-3.1 billion pesos compared with 2.72 billion pesos in 2023.
BWMX began trading in March 2020 after the company’s merger with SPAC sponsor DD3 Acquisition Corp. BWMX specifically targets the Mexican market; it serves three million households through distributors and associates in approximately 800 communities throughout Mexico.
Nu Skin Enterprises, Inc. (NYSE: NUS) dropped 33.3% in February, which was the weakest performance of any DSCI component. Year to date, the stock has lost 36.3% of its value. Since the March 2020 establishment of the DSCI, NUS is down 47.5%. In comparison, the direct selling stock index and the Dow Jones Industrial Average gained 34.3% and 53.3%, respectively, over this period.
On February 14, NUS reported 4Q 2023 revenue and adjusted EPS of $488.6 million and $0.37 versus $522.3 million and $0.89, respectively, in 4Q 2022. NUS’s 4Q 2023 results were affected by persistent macroeconomic pressures and disruptions associated with transforming the company’s business. On a granular basis, NUS’s revenue and earnings declined in the just-completed quarter compared with the year-ago period in the company’s Americas, South Korea and Europe & Africa segments.
As part of its 4Q 2023 earnings release, NUS slashed its quarterly dividend (which was paid March 6) to $0.06 per share ($0.24 annualized) from $0.39 (or $1.56 on an annual basis).
For the full-year 2024, NUS projects sales and non-GAAP EPS of $1.73-$1.87 billion and $0.95-$1.35, both down from 2023 results of $1.97 billion and $1.85, respectively.
Herbalife Nutrition, Inc. (NYSE: HLF) fell 27.9% in February, making it was the second worst performing large cap DSCI component during the month. Over the first two months of 2024, HLF has dropped a direct selling index-worst 43.1%. Since the establishment of the DSCI `four years ago, DSCI has lost 73.1% of its value, the weakest result for any large-cap DSCI component which has traded continuously since index inception.
On February 14, HLF reported 4Q 2023 net sales of $1.22 billion, up slightly from $1.18 billion in the year-ago period. The company’s adjusted diluted EPS declined to $0.28 in the just-completed quarter from $0.53 in 4Q 2022. HLF’s Chairman and CEO Michael Johnson says management continues to maintain “a sharp focus on top-line growth and margin expansion for 2024.”
HLF’s Transformation Program, which was initiated in 2021 to strategically optimize the company’s global business processes, delivered about $70 million of cost savings in 2023, about $27 million of which was realized in 4Q 2023. HLF now expects the program to deliver total run-rate savings of at least $115 million in 2024.
Medifast, Inc. (NYSE: MED) shares declined 25.8% in February, bringing its YTD loss to 39.6%. Since the March 1, 2020 establishment of the DSCI, MED has declined 49.0%, the second worst mark of any large cap DSCI component.
On February 20, MED reported 4Q 2023 revenue of $191.0 million, down from $337.2 million in 4Q 2022. Similarly, diluted EPS in the fourth quarter fell to $1.09 from $2.41 in the year-ago period. The average revenue per active earning OPTAVIA coach was $4,658 in 4Q 2023, down from $5,538 in the year-ago period, driven by continued pressure on customer acquisition. MED is realigning its business to respond to the evolving dynamics of the weight loss industry and to transform its business model. The company expects its 1Q 2024 revenue and diluted EPS will be $155-$175 million and $0.25-$0.95, respectively.
In mid-December, MED announced an expansion into the fast-growing medically supported weight loss market through a collaboration with LifeMD Inc. (NASDAQ: LFMD), a leading provider of virtual primary care. The medically supported weight loss market could reach $100 billion by 2030 according to projections by some analysts. MED has committed to make a $20 million investment in LFMD and to purchase $10 million of LFMD’s common stock.
USANA Health Sciences, Inc. (NYSE: USNA) rose 2.6% in February, cutting its YTD loss to 10.3%. Since the creation of the DSCI four years ago, USANA shares have lost 27.3% compared with gains of 34.3% and 53.3% for the direct selling index and the DJIA, respectively.
In early February, USANA reported 4Q 2023 revenue and diluted EPS of $221 million and $0.87 versus $228 million and $0.66, respectively, in the year-ago period. USANA’s 4Q 2023 results exceeded management’s expectations as sales strengthened in response to a global incentive offering that was especially effective in China. In 4Q 2023, the number of USANA’s Chinese active customers increased by double-digit percentage points from 3Q 2023.
USANA estimates that full-year 2024 revenue and diluted EPS will be in the ranges of $850-$920 million and $2.40-$3.00, respectively. These figures assume that economic conditions in many of the company’s markets remain challenging this year.
eXp World Holdings, Inc. (NASDAQ: EXPI), the DSCI’s second largest component and its best performer since its March 2020 establishment, increased 2.4% in February, cutting its loss over the first two months of 2024 to 18.3%. EXPI shares have appreciated an aggregate 165.3% over the 48 months that the DSCI has been computed.
On February 22, EXPI, the fastest growing real estate brokerage in the world, reported 4Q 2023 revenue and adjusted EBITDA of $983 million and $0.5 million versus $933 million and $3.6 million, respectively, in 4Q 2022. Despite a difficult real estate market, EXPI gained market share in 4Q 2023 and maintained positive adjusted EBITDA during the period.
EXPI’s transaction volume in the just-completed quarter increased 3% to $38.9 billion versus 4Q 2022. Agents and brokers on the company’s platform totaled 87,515 as of year-end 2023, up 2% from December 31, 2022.
A leading provider of financial services in the U.S. and Canada, and the largest market cap stock in the DSCI, Primerica, Inc. (NYSE: PRI) jumped 4.8% in February. This strong performance added to its 19.3% YTD gain. Since March 1, 2020, PRI has increased 124.0%, a gain which nearly quadruples the 34.3% increase for the direct selling index over the last four years.
On February 13, PRI reported 4Q 2023 adjusted operating revenue of $724.3 million, about 6% higher than $684.5 million in the year-ago period. Furthermore, the company’s adjusted operating EPS reached $4.25 in 4Q 2023, a 9% increase from $$3.89 in 4Q 2022. PRI’s impressive 4Q 2023 results were boosted by the company’s large and stable block of in-force life insurance policies, higher investment product sales, a growth in the size of its investment portfolio and an increase in interest rates.
Nature’s Sunshine Products, Inc. (NASDAQ: NATR) rose 1.3% in February, which brought the stock’s YTD increase to 2.0% and its gain since the March 1, 2020 establishment of the direct selling index to 127.0%. Among all DSCI members, NATR trails only EXPI in terms of share price appreciation over the last 48 months.
In November 2023, NATR, which markets and distributes nutritional and personal care products in more than 40 countries, reported 3Q 2023 net sales of $111.2 million, up 6% from $104.5 million in the year-ago period. Adjusted EBITDA increased at a much faster pace, reaching $10.3 million in 3Q 2023, up 50% from $6.8 million in 3Q 2022.
NATR plans to release in 4Q 2023 financial results after the stock market closes on March 12. The company will hold an investor conference call to discuss the results on the same day.
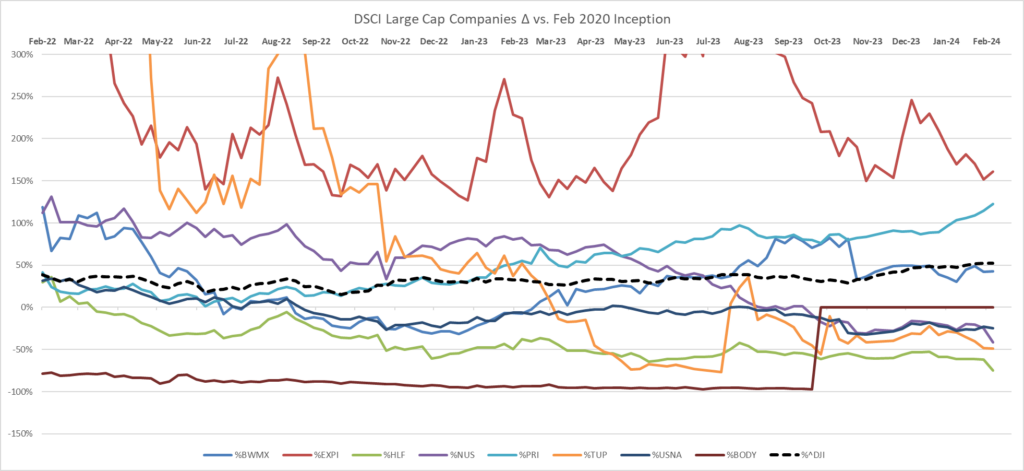
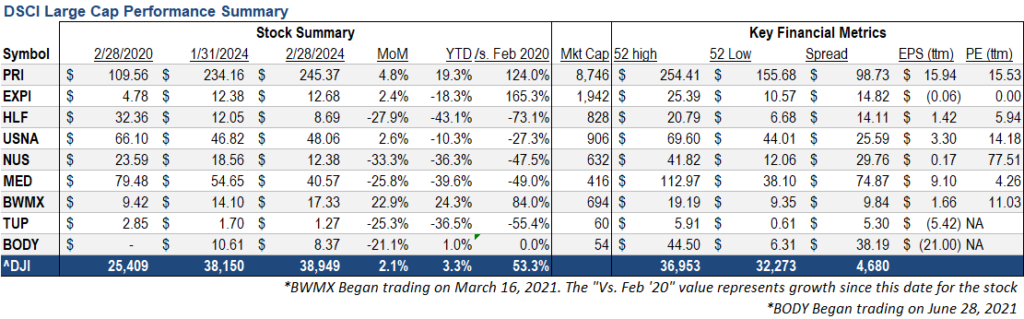 Note: For the purposes of this report, Direct Selling Capital considers companies with a market capitalization in excess of $1 billion “Large Cap.”
Small Cap
Our small cap tracking set generally underperformed the large cap DSCI group in February. Two small caps rose during the month, five fell and one was unchanged. Five of the eight small cap stocks moved by double-digit percentage points (two up and three down) in February.
LifeVantage Corporation (NASDAQ: LFVN), a leading health and wellness company with products designed to activate optimal health processes at the cellular level, rose 31.5% in February, making it the best performing direct selling stock, large or small cap, during the month. On January 30, LFVN reported 2Q FY 2024 (quarter ended December 31, 2023) revenue and adjusted EPS of $51.6 million and positive $0.10 versus $53.7 million and a loss of $0.07, respectively, in the year-ago period.
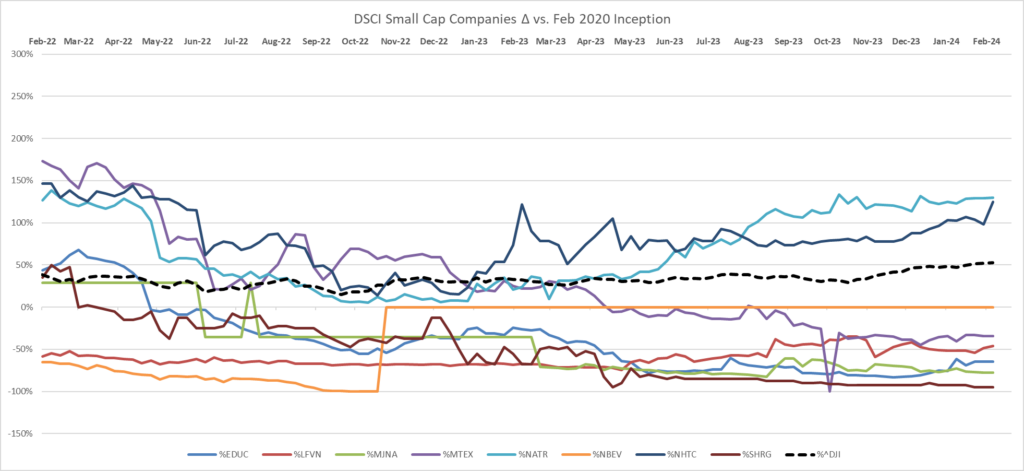
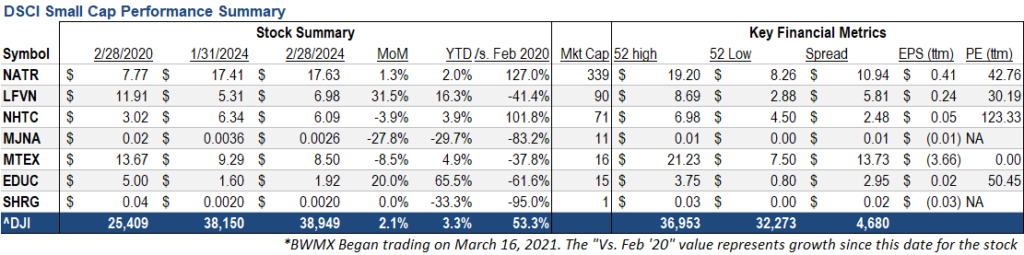
Short Interest Data & Analysis
The following chart is an aggregate index of “days to cover” among the entire tracking set. Days to cover (DTC) is a measurement determined by dividing the total outstanding short interest by average daily trading volume.
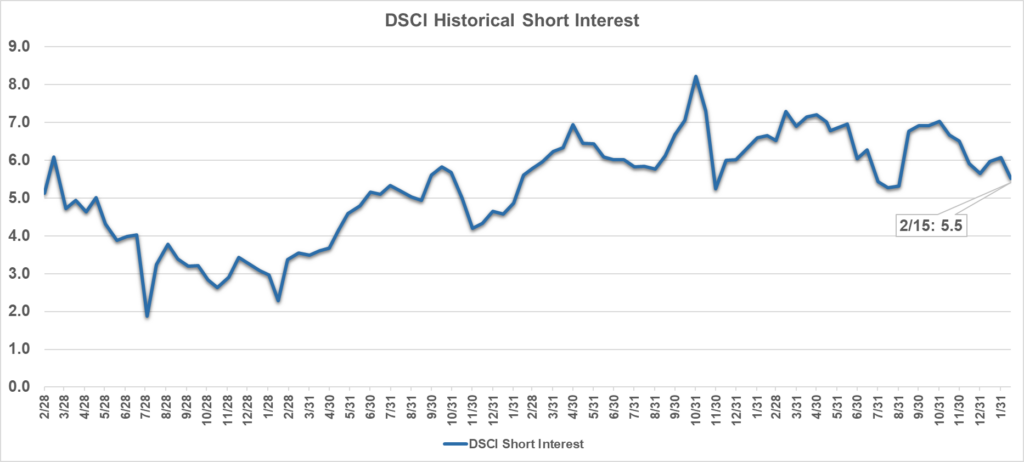
As indicated in the chart above, short interest in DSCI stocks was 5.5 days in mid-February, down from 6.1 days at the end of January and 6.0 days in mid-January. The biggest absolute decrease in DTC from the end of January to mid-February for a DSCI component was HLF’s decrease to 7.2 days from 10.0 days.
Short interest can be a difficult indicator to analyze. On the one hand, an increase in short interest can be a bearish sign in that it indicates an increased view among investors that a stock is likely to decline based on any number of factors, such as a belief that the company’s fundamentals are deteriorating or that it has run too far, too fast. On the other hand, as a stock moves higher, a significant short interest can serve as extra fuel on the fire as investors scramble to “buy to cover” their short positions and mitigate losses.
Analyst Sentiment Index
Our Analyst Sentiment Index was unchanged in February versus January. The proportion of sell-side analysts maintaining “buy” and “hold” ratings on industry stocks was about 97% in both months. Conversely, the percentage of stocks which analysts recommended selling was just 3% in both January and February.
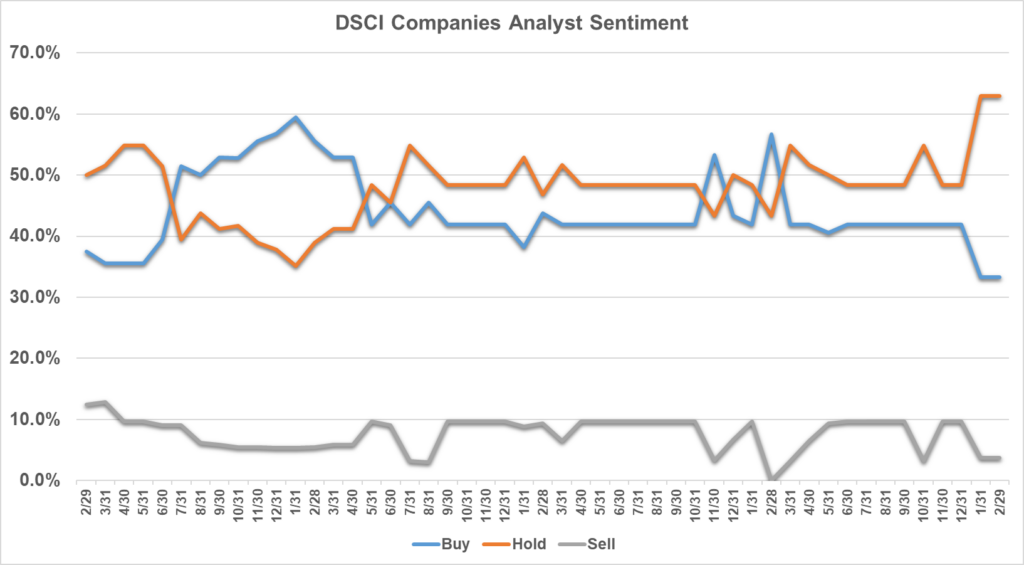
Methodology: The DSCA Analyst Sentiment Index is a consensus tracking tool that aggregates and averages the recommendations of all covering analysts across all public direct selling companies.
-
January 2024
Brought to you by Direct Selling Capital Advisors
Direct Selling Index Rose 5.8% in January, Marking its Third Straight Monthly Gain. Led by Primerica, the DSCI Handily Outperformed the DJIA in the First Month of 2024.
The Direct Selling Capital Advisors Direct Selling Index (DSCI) rose for the third consecutive month in January 2024. Furthermore, the index’s 5.8% gain during the month notably exceeded the 1.2% increase recorded by the Dow Jones Industrials Average (DJIA).
The DSCI’s strong January performance was driven almost solely by Primerica, Inc. (NYSE: PRI), by far the DSCI’s largest component. PRI shares jumped 13.8% during January. However, only two other large cap members rose during the month, while five large caps lost ground, four by double-digit percentage points. As a group, small cap DSCI components outperformed their large peers in January. Four small cap members rose, and an equal number fell. Interestingly, six of the eight small caps moved by more than 10% during January, three up and three down.
From a longer-term perspective, the DSCI has gained an aggregate 33.9% since its March 1, 2020 inception. However, the DJIA has outperformed the direct selling index over this period; since March 1, 2020, the DJIA has increased 50.1%.
The US stock market began 2024 in much the same (positive) way that 2023 ended. As noted above, the DJIA rose 1.2% in January, and the S&P 500 and NASDAQ indices posted even larger gains. Investors’ belief in the tremendous growth potential of all things related to artificial intelligence has remained the market’s dominant investment theme. In turn, stock market participants expect business for semi-conductor manufacturers will soar as they produce the chipsets necessary to power cloud computing, the Internet of Things (IOT), and the metaverse.
A particularly interesting aspect of the stock market’s impressive January 2024 YTD performance was investors’ willingness over the last few weeks to accept that the Fed will quite likely implement fewer (and later) interest rate cuts in 2024 versus a consensus of more and earlier cuts than the market expected in December. The expectation of a very easy Fed in 2024, which emerged especially after details of the Fed’s December 13th rate-setting meeting were released, fueled an explosive “Santa Claus” market rally over the last half of December, which continued in a more measured way in January 2024.
Looking Forward
Since a combination of the historic series of Fed rate increases in 2023, geopolitical turmoil (the Israel-Palestine and Russia-Ukraine conflicts), and significant US political uncertainties (especially the upcoming coin flip US presidential election) did not break the economy or the stock market, or slow the labor market in 2023, investors and analysts continue to believe the stock market offers more reward than risk. Furthermore, most recent government economic releases, particularly related to inflation and the labor market, have been constructive and point to an economic soft landing (or even no landing). Consequently, the stock market could continue to perform well in 2024, and direct selling stocks could benefit from the market’s tailwinds this year in much the same way they did in 2023.
Most direct selling stocks will begin releasing their 4Q 2023 earnings this month. (USANA Health Sciences, Inc. [NYSE: USNA] has already announced its 4Q 2023 results; see below). The 4Q 2023 reported figures will of course be important for DSCI members, but the 2024 revenue and earnings guidance ranges that many management teams will put forth will likely be even more impactful.
CHARTS & ANALYSIS
Direct Selling Capital Advisors Index
The DSCI is a market capitalization weighted index of all domestic public direct selling companies with a market capitalization of at least $25 million. The index is rebalanced monthly, and no single issue is permitted to represent more than 20% of its total value. In such an event, the excess weighting would be redistributed among the other index components.
The DSCI rose in January and outperformed the DJIA during the month. The DSCI gained 5.8% in January versus a 1.2% increase for the DJIA. DSCI data is tracked back to March 1, 2020. The direct selling index has risen 33.9% since that date, less than the 50.1% appreciation of the DJIA over the same period.
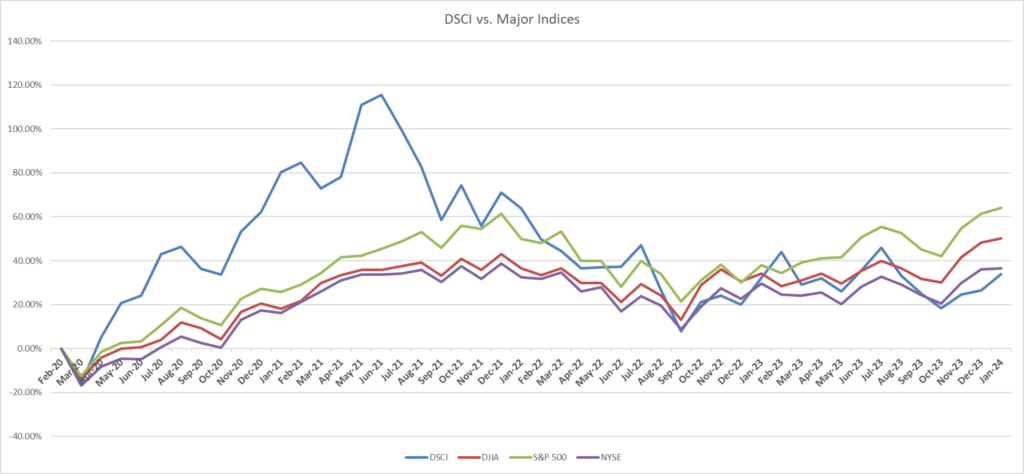 Large Cap
Betterware de Mexico (NASDAQ: BWMX) gained 1.1% in January, making it the second best performing large cap DSCI member for the month. In the full year 2023, BWMX soared 117.1%, the best mark of large or small cap direct selling index member. Since the March 1, 2020 DSCI inception, BWMX is up 49.7%.
In late October, BWMX reported 3Q 2023 consolidated net revenue and EBITDA of 3.12 billion pesos and 529.4 million pesos, both down slightly from 3.17 billion pesos and 534.9 million pesos, respectively, in the year-ago period. The company projects full-year 2023 revenue and EBITDA will total 12.5-12.8 billion pesos and 2.4-2.5 billion pesos, respectively. In early January, Andres Campos assumed the CEO role at BWMX. He will report to Chairman Luis Campos.
BWMX began trading in March 2020 after the company’s merger with SPAC sponsor DD3 Acquisition Corp. BWMX specifically targets the Mexican market; it serves three million households through distributors and associates in approximately 800 communities throughout Mexico.
Nu Skin Enterprises, Inc. (NYSE: NUS) dropped 4.4% in January, reversing about a third of the 14.1% gain it posted in December. Since the March 2020 establishment of the DSCI, NUS has lost 21.3% of its value. In contrast, the direct selling stock index and the Dow Jones Industrial Average gained 33.9% and 50.1%, respectively, over this period.
In November, NUS reported 3Q 2023 revenue and adjusted EPS of $498.8 million and $0.56 versus $537.8 million and $0.47, respectively, in 3Q 2022. Continued US dollar strength and macroeconomic challenges in several key markets negatively affected consumer spending and customer acquisition, particularly in NUS’s Mainland China and Americas segments.
NUS plans to release its fourth quarter and full-year 2023 earnings after the stock market closes on February 14th. Management estimates full-year 2023 revenue and adjusted EPS will fall within the ranges of $1.92-$1.96 billion and $1.62-$1.77, respectively.
In late November, NUS opened a new manufacturing facility in Shanghai, China. The plant, which carries a price tag of about $55 million, will increase the company’s production capacity and supply chain responsiveness in China and other Asian markets.
Herbalife Nutrition, Inc. (NYSE: HLF) was the worst performing large cap DSCI component in January. The stock’s 21.0% loss during the month reversed an 18.5% gain in December 2023. Since the establishment of the DSCI nearly four years ago, DSCI has lost 62.8% of its value, the worst result of any large-cap DSCI component which has traded continuously since index inception.
In early November, HLF reported 3Q 2023 net sales of $1.28 billion, down slightly from $1.30 billion in the year-ago period. The company’s adjusted diluted EPS also declined, falling to $0.65 in 3Q 2023 versus $0.91 in 3Q 2022. Nevertheless, HLF management says the company’s momentum is building steadily and that it is on a path to achieve sustainable growth. HLF will release its 4Q 2023 results after the market closes on February 14th.
In early January, Stephan Paulo Gratziani was appointed President of HLF. Mr. Gratziani was previously the company’s Chief Strategy Officer.
Medifast, Inc. (NYSE: MED) shares dropped 18.7% in January. Since the March 1, 2020 establishment of the DSCI, MED has declined 31.2%, the second worst mark of any large cap DSCI member.
In November, MED reported 3Q 2023 revenue of $235.9 million, down from $390.4 million in 3Q 2022. Similarly, diluted EPS in the third quarter fell to $2.12 from $3.27 in the year-ago period. Revenue and earnings in 3Q 2023 were negatively impacted by a decrease in the number of active earning OPTAVIA Coaches and a decline in the productivity per OPTAVIA Coach.
In mid-December, MED announced an expansion into the fast-growing medically supported weight loss market through a collaboration with LifeMD Inc. (NASDAQ: LFMD), a leading provider of virtual primary care. The medically supported weight loss market could reach $100 billion by 2030 according to projections by some analysts. MED has committed to make a $20 million investment in LFMD and to purchase $10 million of LFMD’s common stock.
As part of its December 13th announcement, MED discontinued payment of its quarterly dividend. Instead, MED intends to invest in initiatives aimed at driving customer acquisition and customer experience to reignite growth.
USANA Health Sciences, Inc. (NYSE: USNA) fell 12.6% in January, ending a two-month winning streak. Since the creation of the DSCI nearly four years ago, USANA shares have lost 29.2% compared with increases of 33.9% and 50.1% for the direct selling index and the DJIA, respectively.
On February 6, USANA reported 4Q 2023 revenue and diluted EPS of $221 million and $0.87 versus $228 million and $0.66, respectively, in the year-ago period. USANA’s 4Q 2023 results exceeded management’s expectations as sales strengthened in response to a global incentive offering that was especially effective in China. In 4Q 2023, the number of USANA’s Chinese active customers increased by double-digit percentage points from 3Q 2023.
USANA introduced full-year 2024 revenue and diluted EPS guidance ranges of $850-$920 million and $2.40-$3.00, respectively. Even the high ends of both ranges are below full year 2023 sales and diluted EPS of $921 million and $3.30, respectively. The company expects economic conditions in many of its markets to be challenging in 2024, just they were in 2023.
eXp World Holdings, Inc. (NASDAQ: EXPI), the DSCI’s second largest component and its best performer since its March 2020 establishment, fell 20.2% in January, reversing much of its 28.2% gain in December. Still, EXPI shares have appreciated an aggregate 159.0% over the 47 months since the DSCI has been computed.
In November, EXPI, the fastest growing real estate brokerage in the world, reported 3Q 2023 revenue and adjusted EBITDA of $1.21 billion and $19.0 million versus $1.24 billion and $12.3 million, respectively, in 3Q 2022. Transaction volume in 3Q 2023 declined 4% versus the year-ago period to $48.5 billion as persistently high mortgage rates kept many buyers sidelined. EXPI will release its 4Q 2023 results after the stock market closes on February 22nd.
In early November, EXPI announced that CFO Jeff Whiteside stepped down from his position. He remained with the company through November 30. Until EXPI can identify a successor, Chief Accounting Officer Kent Cheng will assume the role of Principal Financial Officer.
A leading provider of financial services in the U.S. and Canada, and the largest market cap stock in the DSCI, Primerica, Inc. (NYSE: PRI) soared 13.8% in January, making it by far the best performing large cap DSCI component during the month. Since March 1, 2020,
PRI has gained 113.7%. This long-term gain more than triples the 33.9% increase for the direct selling index over this period.
In November, PRI reported 3Q 2023 adjusted operating revenue of $713.2 million, up 5% from $676.1 million in the year-ago period. In addition, the company’s adjusted diluted operating EPS reached $4.28 in 3Q 2023, a 14% increase from $3.76 in 3Q 2022. PRI’s key business units posted impressive results in 3Q 2023. Profits in its Term Life segment benefitted from the size and stability of predictable margins and strong sales during the quarter. PRI’s Investment and Savings Products group likewise posted positive results as client asset values increased during the period. PRI will release its 4Q 2023 earnings on February 14th.
In mid-December, PRI announced the promotion of EVP of Finance Tracy Tan to the position of CFO. This move represented a normal succession process at the company as PRI had previously reported that Ms. Tan would succeed Alison Rand as CFO no later than April 1, 2024.
Nature’s Sunshine Products, Inc. (NASDAQ: NATR) eked out a 0.7% gain in January. This gain added to the stock’s 124.2% increase since the March 1, 2020 establishment of the direct selling index. Among all DSCI members, NATR trails only EXPI in terms of share price appreciation over the last 47 months.
In November, NATR, which markets and distributes nutritional and personal care products in more than 40 countries, reported 3Q 2023 net sales of $111.2 million, up 6% from $104.5 million in the year-ago period. Adjusted EBITDA increased at a much faster pace reaching $10.3 million in 3Q 2023, up 50% from $6.8 million in 3Q 2022. Orders in NATR’s Asia/Pacific region rose 12% in the quarter on a local currency basis, and NATR’s North American business grew 11% in 3Q 2023 due to the company’s digital investments and improved field activation.
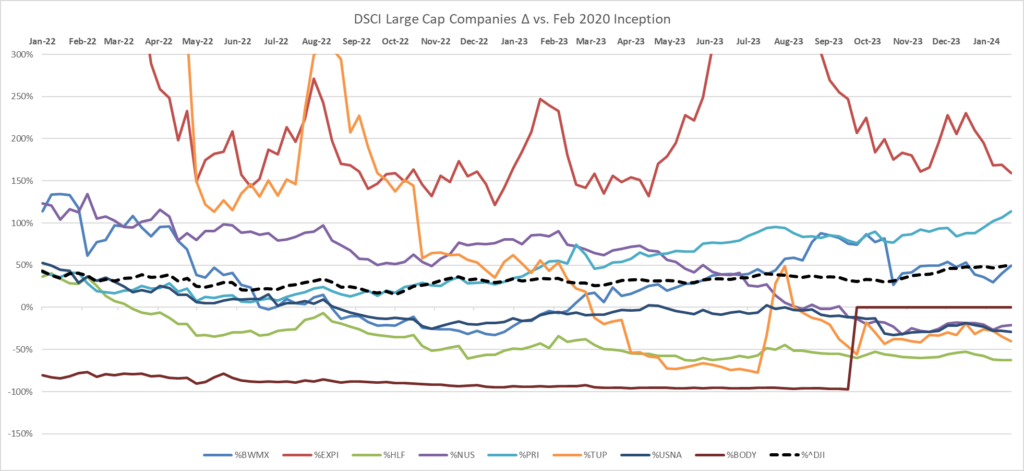
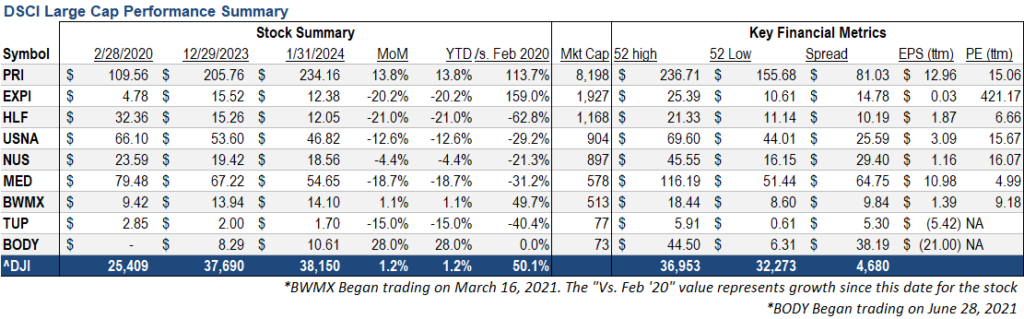 Note: For the purposes of this report, Direct Selling Capital considers companies with a market capitalization in excess of $1 billion “Large Cap.”
 Small Cap
Our small cap tracking set generally outperformed their large cap DSCI peers in January. Four small caps rose during the month, and the same number fell. Six of the eight small cap stocks moved by double-digit percentage points (three up and three down) during the month.
January marked the second consecutive month during which Educational Development Corporation (NASDAQ: EDUC), a publishing company specializing in books and educational products for children, posted the best stock performance of any DSCI component. EDUC’s 37.9% jump in January followed a 36.5% gain in December. In mid-January 2024, EDUC reported 3Q FY 2024 (quarter ended November 30, 2023) revenue and pretax earnings of $16.9 million and $2.7 million versus $30.3 million and just above breakeven, respectively, in 3Q FY 2023.
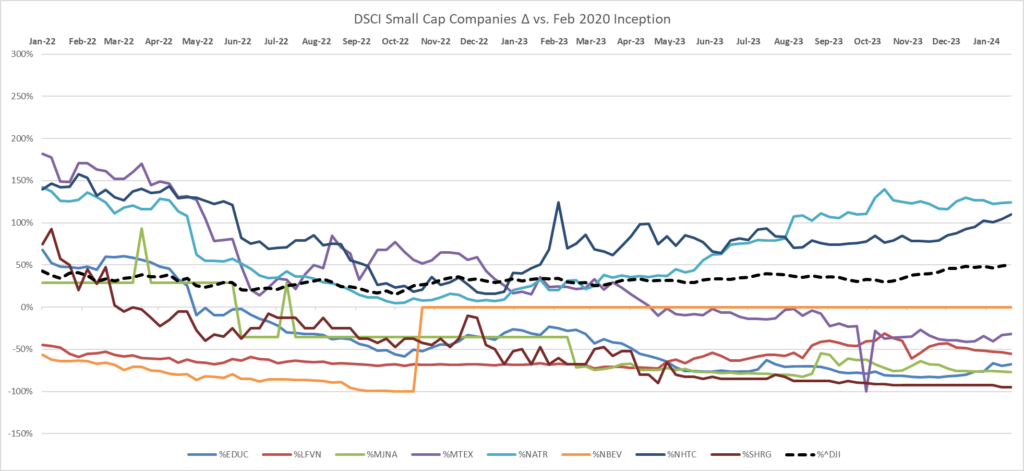
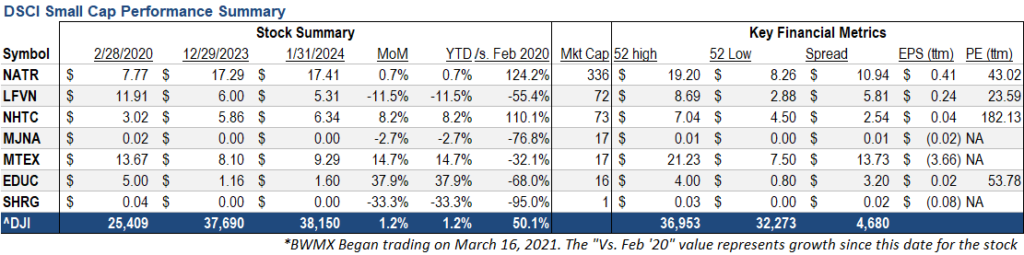 Short Interest Data & Analysis
 The following chart is an aggregate index of “days to cover” among the entire tracking set. Days to cover (DTC) is a measurement determined by dividing the total outstanding short interest by average daily trading volume.
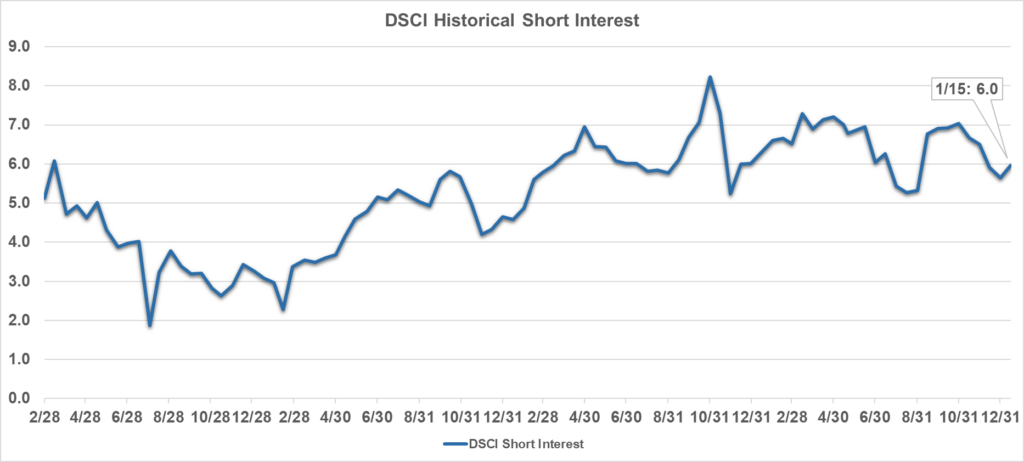 As indicated in the chart above, short interest in DSCI stocks was 6.0 days in mid-January, up slightly from 5.7 days at the end of December and 5.9 days in mid-December. The biggest absolute increase in DTC from the end of December to mid-January for a DSCI component was HLF’s increase to 8.8 days from 7.7 days.
Short interest can be a difficult indicator to analyze. On the one hand, an increase in short interest can be a bearish sign in that it indicates an increased view among investors that a stock is likely to decline based on any number of factors, such as a belief that the company’s fundamentals are deteriorating or that it has run too far, too fast. On the other hand, as a stock moves higher, a significant short interest can serve as extra fuel on the fire as investors scramble to “buy to cover” their short positions and mitigate losses.
Analyst Sentiment Index
Our Analyst Sentiment Index rose in January from December. The proportion of sell-side analysts maintaining “buy” and “hold” ratings on industry stocks was about 97% in January, up from 90% in December. Conversely, the percentage of stocks which analysts recommended selling was just 3% in January versus 10% in December.
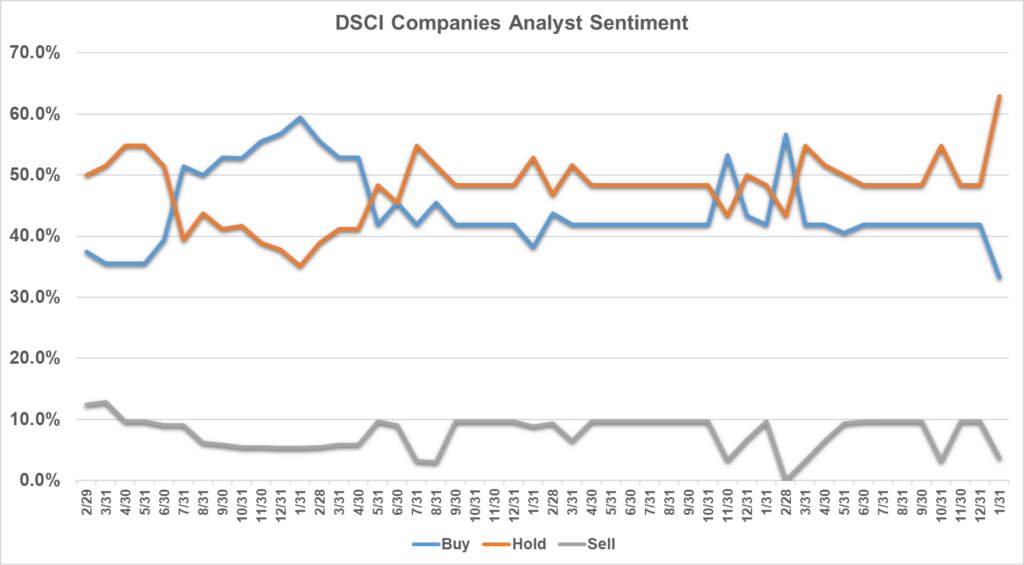
Methodology: The DSCA Analyst Sentiment Index is a consensus tracking tool that aggregates and averages the recommendations of all covering analysts across all public direct selling companies.
-
December 2023
Brought to you by Direct Selling Capital Advisors
Direct Selling Index Rose 1.5% in December and 8.9% in the Full-Year 2023, Modestly Underperformed the DJIA Over Both Periods
The Direct Selling Capital Advisors Direct Selling Index (DSCI) rose for the second consecutive month in December. However, the DSCI’s 1.5% gain during the month trailed the 4.8% increase posted by the Dow Jones Industrials. Over the full-year 2023, the direct selling index added 8.9% but that fell shy of the 13.7% annual gain registered by the market index representing 30 of the world’s biggest and most well-known corporations.
The DSCI’s modest 1.5% gain in December masked strong performances by many index members during the month. Indeed, six of the large cap members rose in December, four of them by double digit percentage points, while only two fell, each by less than 2%. Four small cap DSCI components gained ground in December, three declined, and one was unchanged. Two small caps appreciated by more than 10% during the last month of 2023, and one small cap declined by more than 10%.
From a longer-term perspective, the DSCI has gained an aggregate 26.6% since its March 1, 2020 inception. The DJIA has outperformed the direct selling index over this period; since March 1, 2020, the DJIA has increased 48.3%.
The DJIA’s 4.8% jump in December came on the heels of an even larger 8.8% increase in November. Perhaps more important, the breadth of the market’s rally has been impressive: the broader S&P 500 Index closed the year on a nine-week winning streak, its longest such streak since a stretch in 2004, per Dow Jones Market Data.
After benign government data releases over the last few months—including declining inflation readings and a strong GDP report for 3Q 2023—along with the encouraging year-end run-up in the stock market, investors’ baseline assumption for the economy is either a soft landing or no landing whatsoever in 2024. Most forecasters now believe the odds of a marked near-term slowdown in the economy are quite low.
Continued solid consumer spending levels and a healthy job market generally surprised investors and economists throughout 2023. Coming into the year, and even as recently as just a few months ago, many investors questioned whether the Fed could engineer a soft landing in the economy.
Looking Forward
The Fed’s openness to begin reducing overnight interest rates in 2024 is the dominant headline in the investing world today and likely will remain so as it implements perhaps 75 basis points (or more) of rate cuts this year. The most consistently correct investment strategy over the last decade has been to embrace risk during times of easy monetary policy, and that correlation could continue to hold this year, too.
The stock market lost ground during the first trading week of 2024, but bullish strategists cite the possibility this year of a Goldilocks combination of further declines in inflation readings and a rise in corporate profits. Another constructive element for the stock market could be a 2024 rotation out of funds stashed in money market accounts back into stocks, as the interest rate paid on these accounts shrinks.
A wild card in 2024 will likely be investors’ expectations/fears regarding the implications of the presidential election. However, based on historical precedent, the election could provide a tailwind for the market this year. LPL Financial calculates that over the last decade, the S&P 500 Index has risen 7% on average in a presidential election year and even more when an incumbent is running.
CHARTS & ANALYSIS
Direct Selling Capital Advisors Index
The DSCI is a market capitalization weighted index of all domestic public direct selling companies with a market capitalization of at least $25 million. The index is rebalanced monthly, and no single issue is permitted to represent more than 20% of its total value. In such an event, the excess weighting would be redistributed among the other index components.
The DSCI rose in December but underperformed the DJIA during the month. The DSCI added 1.5% in December versus a 4.8% increase for the DJIA. DSCI data is tracked back to March 1, 2020. The direct selling index has risen 26.6% since that date, less than the 48.3% increase for the DJIA.
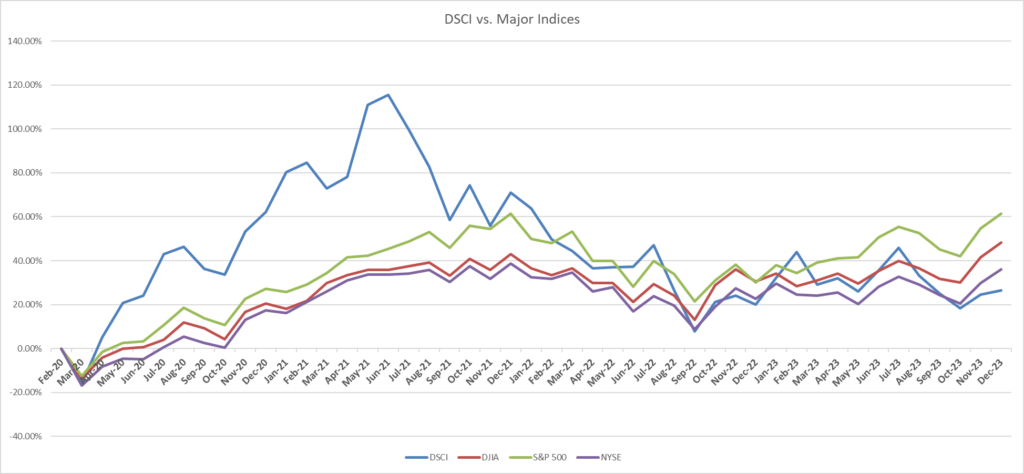
Large Cap
Betterware de Mexico (NASDAQ: BWMX) inched 0.7% lower in December, cutting its full-year 2023 gain to a still very impressive 117.1%. This represents the best 2023 investment return of any large or small cap direct selling index member. Since the March 1, 2020 DSCI inception, BWMX is up 48.0%.
In late October, BWMX reported 3Q 2023 consolidated net revenue and EBITDA of 3.12 billion pesos and 529.4 million pesos, both down slightly from 3.17 billion pesos and 534.9 million pesos, respectively, in the year-ago period. Over the first three quarters of 2023, BWMX has increased its profitability margins and improved its cash conversion cycle. The company projects full-year 2023 revenue and EBITDA will total 12.5-12.8 billion pesos and 2.4-2.5 billion pesos, respectively.
On January 4, 2024, Andres Campos assumed the CEO role at BWMX. He will report Chairman Luis Campos.
BWMX began trading in March 2020 after the company’s merger with SPAC sponsor DD3 Acquisition Corp. BWMX specifically targets the Mexican market; it serves three million households through distributors and associates in approximately 800 communities throughout Mexico.
Nu Skin Enterprises, Inc. (NYSE: NUS) jumped 14.1% in December ending a string of four consecutive monthly declines. Despite last month’s gain, NUS lost 53.9% over full-year 2023, the weakest result of any large cap direct selling stock index member. Since the March 2020 establishment of the DSCI, NUS has lost 17.7% of its value. In contrast, the direct selling stock index and the Dow Jones Industrial Average gained 26.6% and 48.3%, respectively, over that period.
In early November, NUS reported 3Q 2023 revenue and adjusted EPS of $498.8 million and $0.56 versus $537.8 million and $0.47, respectively, in 3Q 2022. Continued U.S. dollar strength and macroeconomic challenges in several key markets negatively affected consumer spending and customer acquisition, particularly in NUS’s Mainland China and Americas segments. NUS estimates full-year 2023 revenue and adjusted EPS will fall within the ranges of $1.92-$1.96 billion and $1.62-$1.77, respectively.
In late November, NUS opened a new manufacturing facility in Shanghai, China. The plant, which carries a price tag of about $55 million, will increase the company’s production capacity and supply chain responsiveness in China and other Asian markets.
Herbalife Nutrition, Inc. (NYSE: HLF) soared 18.5% in December, the second biggest increase of any large-cap direct selling stock. HLF’s strong December performance allowed the stock to post a 2.6% gain for the full-year 2023. Last month’s performance reduced HLF’s loss since the March 2020 establishment of the DSCI to 52.8%, but that still constitutes the worst result of any large-cap index component which has traded continuously since index inception.
In early November, HLF reported 3Q 2023 net sales of $1.28 billion, down slightly from $1.30 billion in the year-ago period. The company’s adjusted diluted EPS also declined, falling to $0.65 in 3Q 2023 versus $0.91 in 3Q 2022. HLF management says its momentum is building steadily and that it is on a path to achieve sustainable growth.
HLF has implemented a Transformation Program which is expected to deliver more than $90 million in annual savings. About $60 million of these savings were expected to be realized in 2023, up from a previous $45 million estimate.
On January 2, Stephan Paulo Gratziani was appointed President of HLF. Mr. Gratziani was previously the company’s Chief Strategy Officer.
Medifast, Inc. (NYSE: MED) shares appreciated 1.3% in December, cutting its 2023 loss to 41.7%. Since the March 1, 2020 establishment of the DSCI, MED has declined 15.4%.
In early November, MED reported 3Q 2023 revenue of $235.9 million, down from $390.4 million in 3Q 2022. Similarly, diluted EPS in the third quarter fell to $2.12 from $3.27 in the year-ago period. Revenue and earnings in 3Q 2023 were negatively impacted by a decrease in the number of active earning OPTAVIA Coaches and a decline in the productivity per OPTAVIA Coach.
On December 13, MED announced an expansion into the fast-growing medically supported weight loss market through a collaboration with LifeMD Inc. (NASDAQ: LFMD), a leading provider of virtual primary care. The medically supported weight loss market could reach $100 billion by 2030 according to projections by some analysts. MED has committed to make a $20 million investment in LFMD and to purchase $10 million of LFMD’s common stock.
As part of its December 13th announcement, MED revealed plans to discontinue payment of its quarterly dividend. Instead, MED intends to invest in initiatives aimed at driving customer acquisition and customer experience to reignite growth.
USANA Health Sciences, Inc. (NYSE: USNA) rose for a second straight month in December. The stock’s 13.8% December gain more than reversed its losses over the first eleven months of 2023; for the full-year 2023 USNA gained 0.8%. However, since the March 2020 inception of the DSCI, USANA shares have lost 18.9% compared
with increases of 26.6% and 48.3% for the direct selling index and the DJIA, respectively.
In late October, USANA reported 3Q 2023 revenue and diluted EPS of $213 million and $0.59, both down from $233 million and $0.78, respectively, in 3Q 2022. USANA’s 3Q 2023 results were constrained by challenging economic conditions across many of USANA’s regions, inflationary pressures, and a lower cadence of promotional activity. The company’s net sales and diluted EPS projections for full-year 2023 are $900-$920 million and $2.80-$3.05, respectively.
eXp World Holdings, Inc. (NASDAQ: EXPI), the DSCI’s second largest component and its best performer since its March 2020 establishment, soared 28.2% in December, emphatically ending a three-month losing streak. EXPI’s December gain brought its YTD increase to 40.1%. EXPI shares have appreciated 224.7% over the 46 months that the DSCI has been computed.
In early November, EXPI, the fastest growing real estate brokerage in the world, reported 3Q 2023 revenue and adjusted EBITDA of $1.21 billion and $19.0 million versus $1.24 billion and $12.3 million, respectively, in 3Q 2022. Transaction volume in 3Q 2023 declined 4% versus the year-ago period to $48.5 billion, as persistently high mortgage rates kept many buyers sidelined. The number of agents on EXPI’s realty platform reached 89,156 as of September 30, 2023.
On November 9, EXPI announced that CFO Jeff Whiteside stepped down from his position. He remained with the company through November 30. Until EXPI can identify a successor, Chief Accounting Officer Kent Cheng will assume the role of Principal Financial Officer.
A leading provider of financial services in the U.S. and Canada, and the largest market cap stock in the DSCI, Primerica, Inc. (NYSE: PRI) dropped 1.8% in December, the worst mark of any large cap DSCI component. That decline pared PRI’s full-year 2023 gain slightly to 45.1%. Since the March 2020 establishment of the DSCI, PRI has risen 87.8%. Both the 2023 and 46-month gains markedly surpass the respective 8.9% and 26.6% gains for the direct selling index.
In early November, PRI reported 3Q 2023 adjusted operating revenue of $713.2 million, up 5% from $676.1 million in the year-ago period. In addition, the company’s adjusted diluted operating EPS reached $4.28 in 3Q 2023, a 14% increase from $3.76 in 3Q 2022. PRI’s key business units posted impressive results in 3Q 2023. Profits in its Term Life segment benefitted from the size and stability of predictable margins and strong sales during the quarter. PRI’s Investment and Savings Products group likewise posted positive results as client asset values increased during the period.
On December 18, PRI announced the promotion of EVP of Finance Tracy Tan to the position of CFO effective December 20th. This move represented a normal succession process at the company as PRI had previously reported that Ms. Tan would succeed Alison Rand as CFO no later than April 1, 2024.
Nature’s Sunshine Products, Inc. (NASDAQ: NATR) managed a 0.9% gain in December, adding to its impressive full-year 2023 return of 107.8%. This performance represents the second-best mark of any direct selling index stock. NATR similarly boasts the second best long-term performance of any DSCI member, +122.6% since the March 1, 2020 establishment of the index. (EXPI leads with a 224.7% long-term gain.)
In early November, NATR, which markets and distributes nutritional and personal care products in more than 40 countries, reported 3Q 2023 net sales of $111.2 million, up 6% from $104.5 million in the year-ago period. Adjusted EBITDA increased at a much faster pace, reaching $10.3 million in 3Q 2023, up 50% from $6.8 million in 3Q 2022. Orders in NATR’s Asia/Pacific region rose 12% in the quarter on a local currency basis, and NATR’s North American business grew 11% in 3Q 2023 due to the company’s digital investments and improved field activation. In addition, NATR’s gross margin improved 150 basis points in 3Q 2023 versus 3Q 2022.
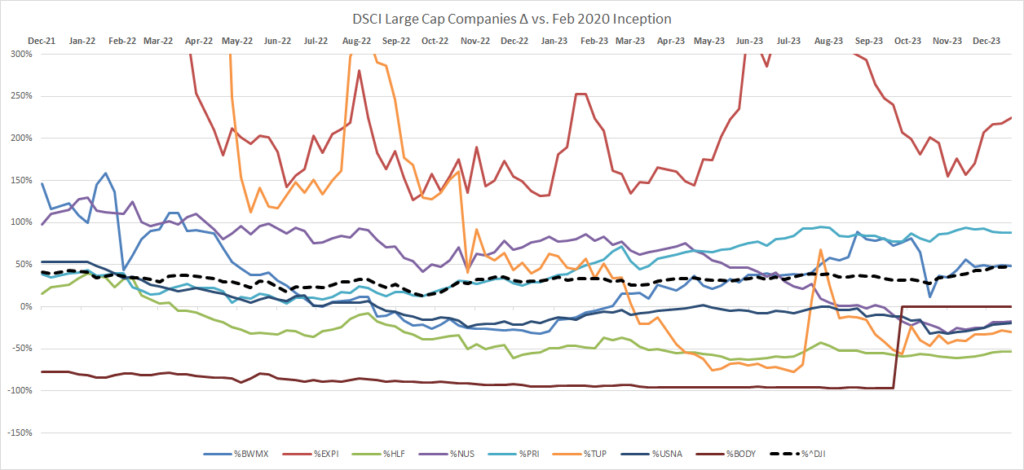
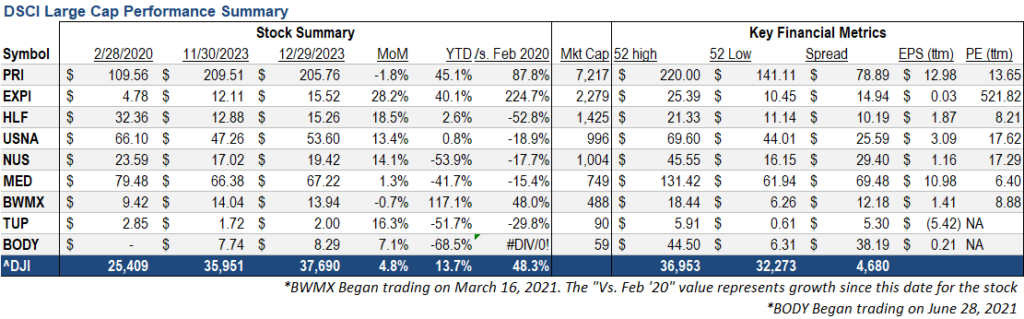
Note: For the purposes of this report, Direct Selling Capital considers companies with a market capitalization in excess of $1 billion “Large Cap.”Small Cap
Our small cap tracking set underperformed their large cap DSCI peers in December. Four small caps rose during the month, while three fell. One was unchanged. Three of the eight small cap stocks moved by double-digit percentage points (two up and one down) during the month.
Educational Development Corporation (NASDAQ: EDUC), a publishing company specializing in books and educational products for children, gained 36.5% in December, the best mark of any DSCI component. For the full-year 2023, EDUC fell 63.3%. In mid-October 2023, EDUC reported 2Q FY 2024 (quarter ended August 31, 2023) revenue and pretax earnings of $10.6 million and $1.5 million versus $19.4 million and negative $1.1 million, respectively, in the year-ago period.
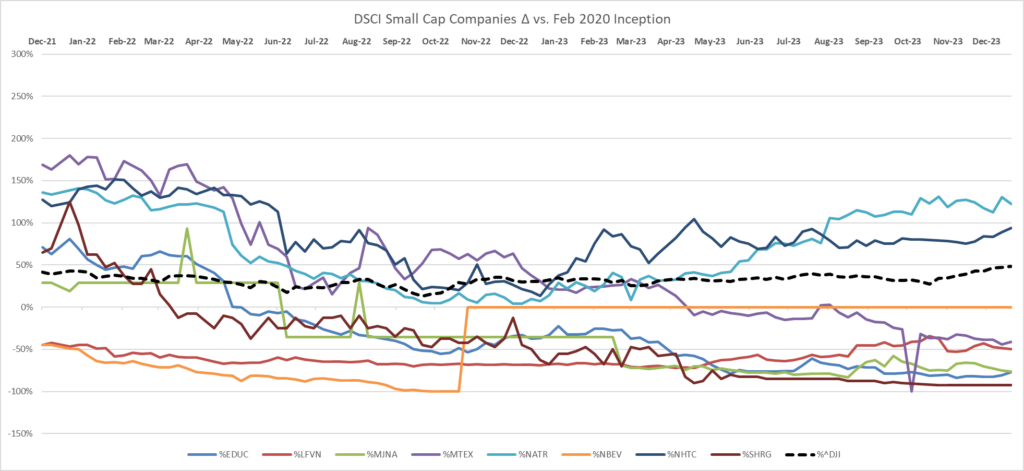

Short Interest Data & Analysis
The following chart is an aggregate index of “days to cover” among the entire tracking set. Days to cover (DTC) is a measurement determined by dividing the total outstanding short interest by average daily trading volume.
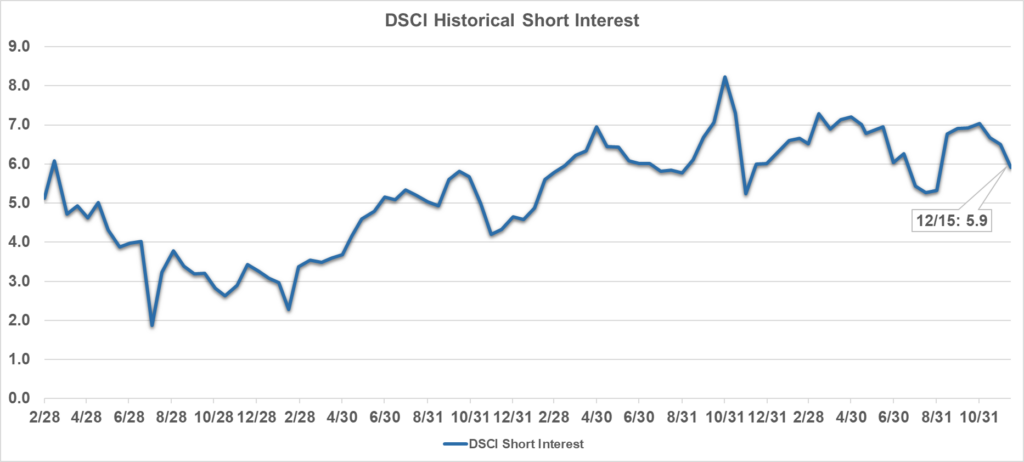
As indicated in the chart above, short interest in DSCI stocks was 5.9 days in mid-December, down from 6.5 days at the end of November and 6.7 days in mid-November. The biggest absolute decline in DTC from the end of November to mid-December for a DSCI component was EXPI’s decrease to 17.6 days from 19.6 days.
Short interest can be a difficult indicator to analyze. On the one hand, an increase in short interest can be a bearish sign in that it indicates an increased view among investors that a stock is likely to decline based on any number of factors, such as a belief that the company’s fundamentals are deteriorating or that it has run too far, too fast. On the other hand, as a stock moves higher, a significant short interest can serve as extra fuel on the fire as investors scramble to “buy to cover” their short positions and mitigate losses.
Analyst Sentiment Index
Our Analyst Sentiment Index was unchanged in December from November. The proportion of sell-side analysts maintaining “buy” and “hold” ratings on industry stocks was about 90% in both November and December. Conversely, the percentage of stocks which analysts recommended selling in both months remained constant at approximately 10%.
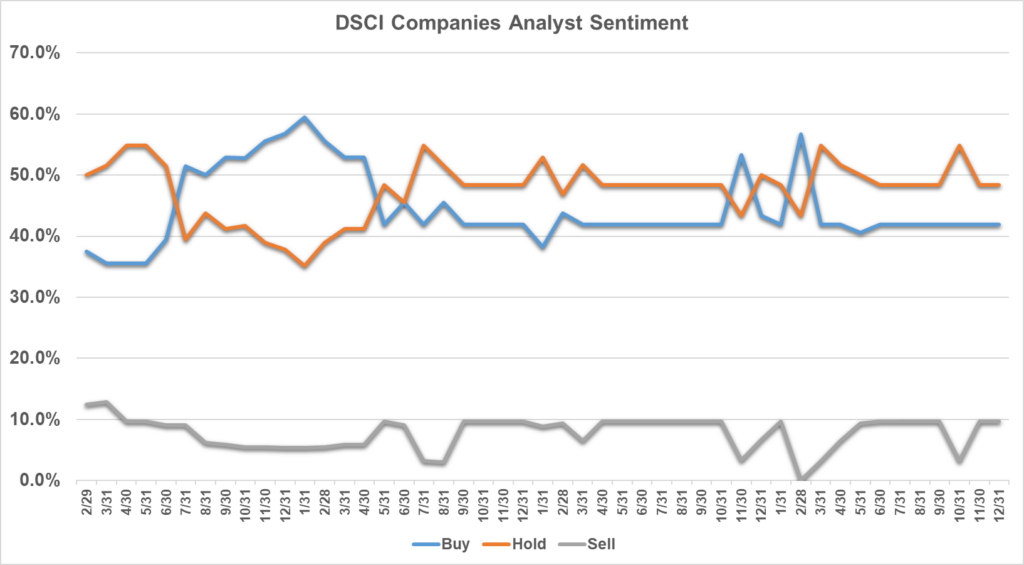
Methodology: The DSCA Analyst Sentiment Index is a consensus tracking tool that aggregates and averages the recommendations of all covering analysts across all public direct selling companies.
-
November 2023
Brought to you by Direct Selling Capital Advisors
Direct Selling Index Jumps 5.3% in November, Breaking a Three-Month Downturn; Direct Selling Stocks Have Narrowly Outperformed the DJIA Over First Eleven Months of 2023
The Direct Selling Capital Advisors Direct Selling Index (DSCI) jumped 5.3% in November, breaking a string of three consecutive monthly losses and reversing a percentage drop of similar size in October. The Dow Jones Industrials also rose in November; its 8.8% gain during the month represented outperformance versus the direct selling index. Over the first eleven months of 2023, the DSCI has slightly outpaced the Dow, rising 9.0% versus an 8.5% increase for the broad market index representing 30 of the world’s biggest and most well-known corporations.
Despite the direct selling index’s strong performance in November, results were were not uniform across DSCI’s components. Indeed, only three large cap members rose, while five fell. Similarly, just two of the eight small caps posted gains.
From a longer-term perspective, the DSCI has appreciated an aggregate 24.6% since its March 1, 2020 inception. The DJIA has outperformed the direct selling index over that period; since March 1, 2020, the DJIA has gained 41.5%.
The DJIA’s 8.8% gain in November not only snapped a three-month losing streak for all major stock market indices, but the Dow posted its biggest monthly increase since October 2022. Sharp declines in Treasury yields, particularly 10- and 30-year yields, in November were a key impetus for the impressive performance. Data releases in November continued to point to a slower pace of inflation, which in turn caused many investors to conclude that the Fed’s rate increase cycle has ended and that the central bank may have engineered what several months ago seemed very unlikely—a soft landing for the economy.
Perhaps as important as the sharp monthly gain for the DJIA was the breadth of November’s rally. Whereas a handful of mega-cap tech stocks (the so-called “Magnificent Seven”) accounted for most of the market’s increases earlier this year, a wide range of stocks, including small caps and cyclicals, participated in the upturn in November. For example, about 60% of the stocks in the S&P 500 Index are trading above their 200-day moving averages, a widely cited measure of breadth. These factors seem to bode well for the rally to continue into at least year-end.
Looking Forward
With 3Q 2023 earnings season having concluded for both the direct selling stocks and the overall stock market, macroeconomic news is likely to be the key driver for most stocks in December. Of course, positive seasonal factors could assist the performance of stocks this month as well. According to FactSet, earnings for the S&P 500 increased about 4% in the just-completed quarter, the first year-over-year rise since 3Q 2022.
Given that much of the stock market’s November gains stemmed from investors’ benign interpretation of inflation data, the next release of U.S. CPI information, scheduled for December 12th, will be closely watched. The next day, the Fed will conclude a two-day rate setting meeting. Almost all Fed watchers expect the central bank to leave rates unchanged on December 13th, but the details of the CPI announcement could factor into whether the Fed may consider rate decreases in 2024—and the potential timing of such cuts.
CHARTS & ANALYSIS
Direct Selling Capital Advisors Index
The DSCI is a market capitalization weighted index of all domestic public direct selling companies with a market capitalization of at least $25 million. The index is rebalanced monthly, and no single issue is permitted to represent more than 20% of its total value. In such an event, the excess weighting would be redistributed among the other index components.
The DSCI rose in November but underperformed the DJIA during the month. The DSCI added 5.3% in November versus an 8.8% increase for the DJIA. DSCI data is tracked back to March 1, 2020. The direct selling index has risen 24.6% since that date, less than the 41.5% increase for the DJIA.
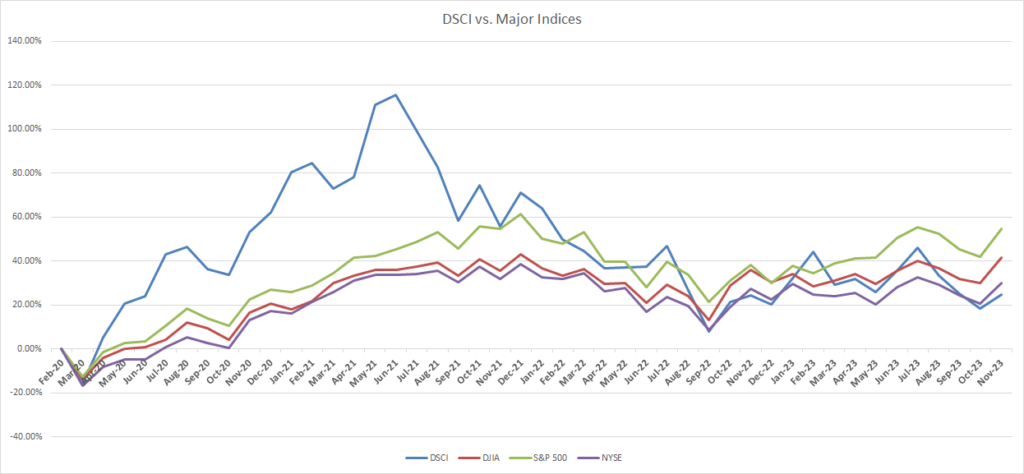
Large Cap
Betterware de Mexico (NASDAQ: BWMX) jumped 13.5% in November making it the best performing large cap DSCI component during the month. Furthermore, BWMX’s November gain lifted its YTD performance to an impressive 118.7%, the best mark of any large or small cap direct selling index member. Since the March 1, 2020 DSCI inception, BWMX is up 49.1%.
In late October, BWMX reported 3Q 2023 consolidated net revenue and EBITDA of 3.12 billion pesos and 529.4 million pesos, both down slightly from 3.17 billion pesos and 534.9 million pesos, respectively, in the year-ago period. BWMX’s YTD results have come in moderately below its beginning-of-the-year estimates; however, over the first three quarters of 2023, the company has increased its profitability margins and improved its cash conversion cycle. BWMX management now projects full-year 2023 revenue and EBITDA of 12.5-12.8 billion pesos and 2.4-2.5 billion pesos, respectively.
BWMX began trading in March 2020 after the company’s merger with SPAC sponsor DD3 Acquisition Corp. BWMX specifically targets the Mexican market; it serves three million households through distributors and associates in approximately 800 communities throughout Mexico.
Nu Skin Enterprises, Inc. (NYSE: NUS) was the worst performing large cap DSCI member in November. The stock dropped 10.4% during the month, which represented its fourth successive monthly decline of more than 10%. NUS lost 59.6% over the first eleven months of 2023, the weakest result of any large cap direct selling stock index member. Since the March 2020 establishment of the DSCI, NUS has lost 27.9% of its value. In contrast, the direct selling stock index and the Dow Jones Industrial Average gained 24.6% and 41.5%, respectively, over that period.
In early November, NUS reported 3Q 2023 revenue and adjusted EPS of $498.8 million and $0.56 versus $537.8 million and $0.47, respectively, in 3Q 2022. Continued U.S. dollar strength and macroeconomic challenges in several key markets negatively affected consumer spending and customer acquisition, particularly in NUS’s Mainland China and Americas segments. Indeed, the company’s customer count in 3Q 2023 fell to 978,907, down 21% from the year-ago period. NUS projects full-year 2023 revenue and adjusted EPS of $1.92-$1.96 billion and $1.62-$1.77, respectively.
Herbalife Nutrition, Inc. (NYSE: HLF) fell 9.6% in November, the second biggest loss of any large-cap direct selling stock. This decline brought HLF’s YTD loss to 13.4% and its decline since the March 2020 establishment of the DSCI to 60.2%, the worst of any large-cap index member which has traded continuously since index inception.
In early November, HLF reported 3Q 2023 net sales of $1.28 billion, down slightly from $1.30 billion in the year-ago period. The company’s adjusted diluted EPS also declined, falling to $0.65 in 3Q 2023 versus $0.91 in 3Q 2022. HLF management says its momentum is building steadily and that it is on a path to achieve sustainable growth.
HLF has implemented a Transformation Program which is expected to deliver more than $90 million in annual savings. About $60 million of these savings will be realized in 2023, up from its previous $45 million estimate.
Medifast, Inc. (NYSE: MED) shares dropped 4.0% in November, pushing its YTD loss to 42.5%. Since the March 1, 2020 establishment of the DSCI, MED has declined 16.5%. MED’s annual dividend rate is $6.60 per share, making its dividend yield a very attractive 9.7%.
On November 6, MED reported 3Q 2023 revenue of $235.9 million, down from $390.4 million in 3Q 2022. Similarly, diluted EPS in the third quarter fell to $2.12 from $3.27 in the year-ago period. Revenue and earnings in 3Q 2023 were negatively impacted by a decrease in the number of active earning OPTAVIA Coaches and a decline in the productivity per OPTAVIA Coach.
MED management projects that full-year 2023 revenue and diluted EPS will be in the ranges of $1.05 billion to $1.07 billion and $8.65 to $9.55, respectively.
USANA Health Sciences, Inc. (NYSE: USNA) rose 3.8% in November, breaking a two-month losing streak. The November monthly gain cut its YTD loss to 11.2%. Since the March 2020 inception of the DSCI, USANA shares have lost 28.5% compared with increases of 24.6% and 41.5% for the direct selling index and the DJIA, respectively.
In late October, USANA reported 3Q 2023 revenue and diluted EPS of $213 million and $0.59, both down from $233 million and $0.78, respectively, in 3Q 2022. USANA’s 3Q 2023 results were held back by challenging economic conditions across many of USANA’s regions; inflationary pressures; and a lower cadence of promotional activity. The company’s net sales and diluted EPS outlooks for full-year 2023 are now $900-$920 million and $2.80-$3.05, respectively.
eXp World Holdings, Inc. (NASDAQ: EXPI), the DSCI’s second largest component and its best performer since its March 2020 establishment, declined for a third consecutive month in November. The 8.7% drop during the month pared EXPI’s YTD increase to 9.3%. EXPI shares have gained 153.3% over the 45 months that the DSCI has been computed.
In early November, EXPI, the fastest growing real estate brokerage in the world, reported 3Q 2023 revenue and adjusted EBITDA of $1.21 billion and $19.0 million versus $1.24 billion and $12.3 million, respectively, in 3Q 2022. Transaction volume in 3Q 2023 declined 4% versus the year-ago period to $48.5 billion as persistently high
mortgage rates kept many buyers sidelined. The number of agents on EXPI’s realty platform reached 89,156 as of September 30, 2023.
A leading provider of financial services in the US and Canada, and the largest market cap stock in the DSCI, Primerica, Inc. (NYSE: PRI) was the second best performing large cap DSCI component in November, increasing 9.6%. That jump boosted PRI’s YTD gain to 47.7%. Since the March 2020 establishment of the DSCI, PRI has risen 91.2%. Both these YTD and 45-month gains markedly surpass the respective 9.0% and 24.6% gains in the direct selling index.
On November 7, PRI reported 3Q 2023 adjusted operating revenue of $713.2 million, up 5% from $676.1 million in the year-ago period. In addition, the company’s adjusted diluted operating EPS reached $4.28 in 3Q 2023, a 14% increase from $3.76 in 3Q 2022. PRI’s key business units posted impressive results in 3Q 2023. Profits in its Term Life segment benefitted from the size and stability of predictable margins and strong sales during the quarter. PRI’s Investment and Savings Products group likewise posted positive results, as client asset values increased during the period.
In 3Q 2023, PRI bought back $106.5 million of its shares. Year to date, $302.5 million of stock has been repurchased. The company expects to buy back about $72.5 million of its shares in 4Q 2023, which would bring its full-year 2023 total to $375 million. On November 16, PRI’s Board announced a $425 million share repurchase target for 2024.
Nature’s Sunshine Products, Inc. (NASDAQ: NATR) fell 4.3% in November, ending a three-month streak where it was the best performing DSCI large cap component in each month. Year to date, NATR is up an impressive 105.9%, the second-best mark of any direct selling stock. NATR similarly boasts the second best long-term performance of any DSCI member, +120.6% since the March 1, 2020 establishment of the index. (EXPI leads with a 153.3% long-term gain.)
On November 7, NATR, which markets and distributes nutritional and personal care products in more than 40 countries, reported 3Q 2023 net sales of $111.2 million, up 6% from $104.5 million in the year-ago period. Adjusted EBITDA increased at a much faster pace, reaching $10.3 million in 3Q 2023, up 50% from $6.8 million in 3Q 2022. Orders in NATR’s Asia/Pacific region rose 12% in the quarter on a local currency basis, and NATR’s North American business grew 11% in 3Q 2023 due to the company’s digital investments and improved field activation. In addition, NATR’s gross margin improved 150 basis points in 3Q 2023 versus 3Q 2022.
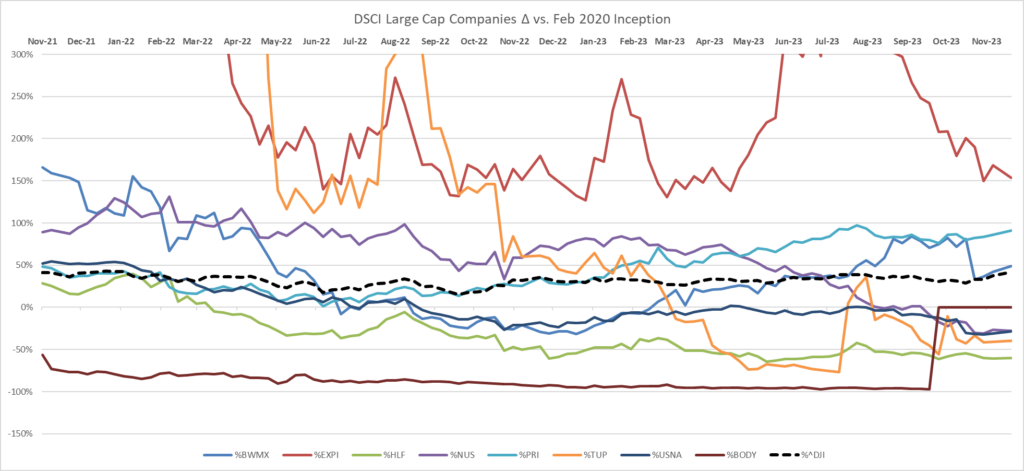
 Note: For the purposes of this report, Direct Selling Capital considers companies with a market capitalization in excess of $1 billion “Large Cap.”
Small Cap
Our small cap tracking set performed in line to slightly worse than their large cap DSCI peers in November. Two small caps rose during the month, while six fell. Four of the eight small cap stocks moved by double-digit percentage points (one up and three down) during the month.
Natural Health Trends Corp. (NASDAQ: NHTC), which markets premium quality personal care, wellness and quality of life products, fell 3.7% in November. Over the first eleven months of 2023, NHTC gained 56.3% (the fourth best mark of any direct selling stock). Since DSCI inception, NHTC has appreciated 77.6% (the third best reading). In early November, NHTC reported 3Q 2023 revenue and EPS of $10.6 million and $0.02 versus $11.7 million and break even, respectively.
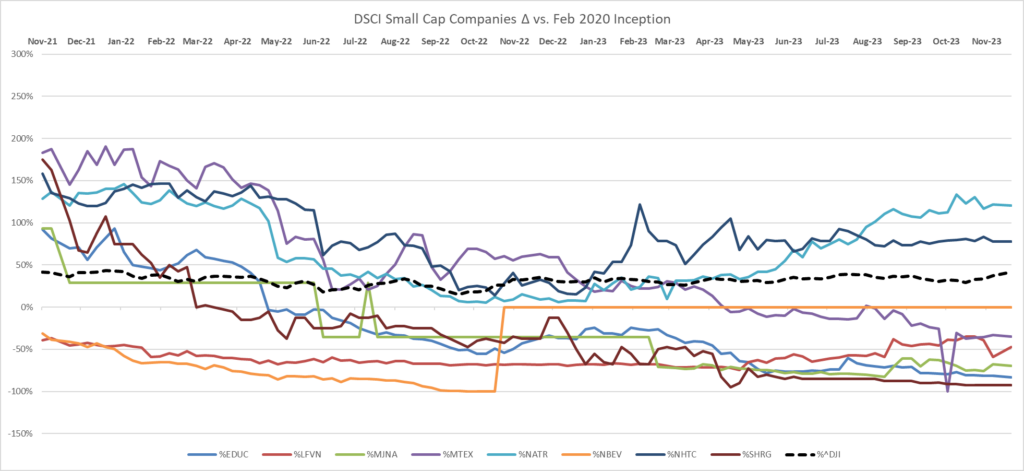
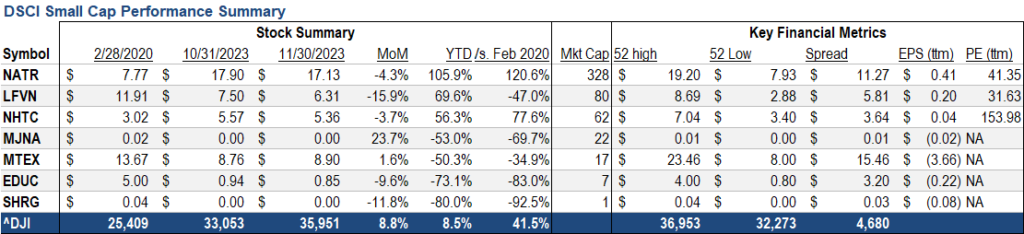
Short Interest Data & Analysis
The following chart is an aggregate index of “days to cover” among the entire tracking set. Days to cover (DTC) is a measurement determined by dividing the total outstanding short interest by average daily trading volume.
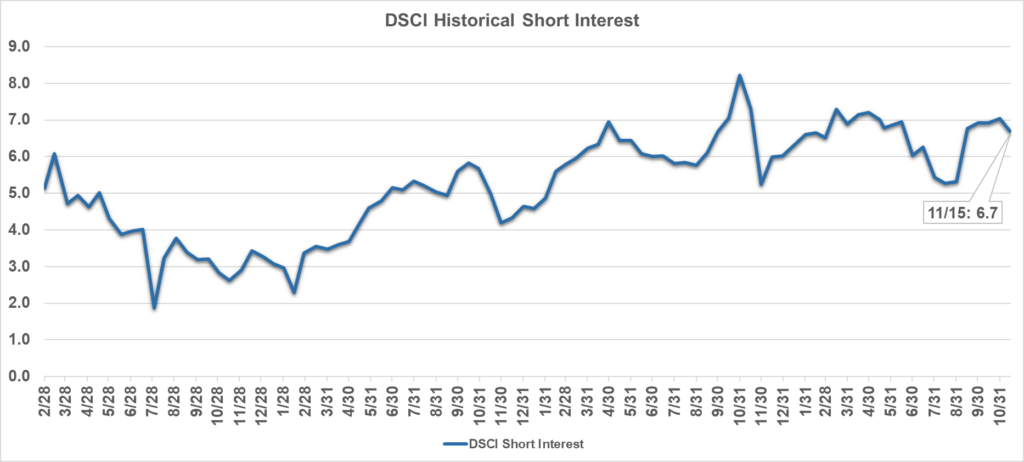
As indicated in the chart above, short interest in DSCI stocks was 6.7 days in mid-November, down from the 7.0 days reading at the end of October and 6.9 days in mid-October. The biggest absolute decline in DTC from the end of October to mid-November for a DSCI component was LifeVantage Corporation’s (NASDAQ: LFVN) decrease to 0.9 days from 1.7 days.
Short interest can be a difficult indicator to analyze. On the one hand, an increase in short interest can be a bearish sign in that it indicates an increased view among investors that a stock is likely to decline based on any number of factors, such as a belief that the company’s fundamentals are deteriorating or that it has run too far, too fast. On the other hand, as a stock moves higher, a significant short interest can serve as extra fuel on the fire as investors scramble to “buy to cover” their short positions and mitigate losses.
Analyst Sentiment Index
Our Analyst Sentiment Index declined in November from October. The proportion of sell-side analysts maintaining “buy” and “hold” ratings on industry stocks fell to about 90% in November from 97% in October. Conversely, the percentage of stocks which analysts recommended selling last month rose to 10% from just 3% in October.
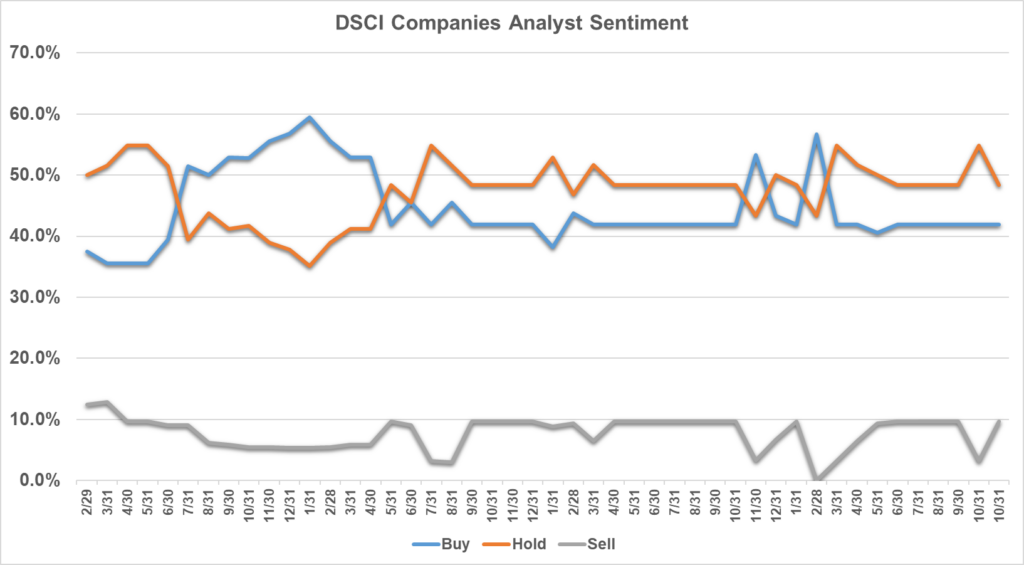
Methodology: The DSCA Analyst Sentiment Index is a consensus tracking tool that aggregates and averages the recommendations of all covering analysts across all public direct selling companies.
-
October 2023
Brought to you by Direct Selling Capital Advisors
Direct Selling Index Falls 5.3% in October, its Third Consecutive Monthly Loss; Nevertheless, Direct Selling Stocks are Still up on the Year
The Direct Selling Capital Advisors Direct Selling Index (DSCI) fell 5.3% in October, marking its third consecutive monthly loss. The Dow Jones Industrials also declined in October, but its 1.4% loss during the month represented outperformance versus the direct selling index. More constructively, the DSCI has outpaced the Dow over the first ten months of 2023, rising 3.6% versus a 0.3% loss for the broad market index representing 30 of the world’s biggest and most well-known corporations.
In October 2023, both large and small cap DSCI components generally had a difficult month. Six of the eight large caps declined in October, four by more than 10%. In addition, three small caps rose during the month, while five lost value. Each of the small cap decliners fell by double digit percentage points.
From a longer-term perspective, the DSCI has appreciated an aggregate 18.4% since its March 1, 2020 inception. The DJIA has outperformed the direct selling index over that period. Since March 1, 2020, the DJIA has gained 30.1%.
The stock market declined for the third straight month in October, and small and micro-cap stocks generally underperformed larger cap stocks. Weakness in the bond market, particularly bonds with longer maturities, played a significant role in the lagging performance of equities. More specifically, ten- and thirty-year U.S. Treasury yields both rose more than 30 basis points in October as investors adapted to the notion that the Federal Reserve would likely maintain higher interest rates for an extended period.
Adding further pressure to the equity markets were heightened geopolitical risks after the October 7th terrorist attack by Hamas against Israel and Israel’s reprisal activities against the terrorist group. Many fear that an Israel ground attack in Palestine could lead to a deeper and broader regional conflict which could potentially cause oil prices to shoot higher.
Looking Forward
A significant number of companies have already reported their third quarter earnings results, including many direct selling stocks. In the broad market, earnings are poised to increase, on average, about 4% from year-ago levels. Those DSCI components which have already reported generally posted declines in both revenue and earnings from 3Q 2022 levels.
The stock market soared in the first few trading days of November as the Fed maintained interest rates at its November 1st rate-setting meeting. More importantly, Fed Chairman Powell’s tone at the post-meeting press conference was more balanced, less hawkish than at the previous meeting in September. This, together with a Goldilocks-type employment report issued on November 3rd, triggered a sharp decline in ten-year U.S. Treasury yields which fueled an impressive rally in stocks.
If investors continue to be optimistic over the balance of November, direct selling stocks could rebound after three consecutive down months. While some individual earnings reports of DSCI members have been disappointing, investors may choose to focus on the 2024 economy which likely will not be encumbered by rising short-term interest rates. Indeed, many forecasters expect the Fed to begin cutting rates by the middle of next year.
CHARTS & ANALYSIS
Direct Selling Capital Advisors Index
The DSCI is a market capitalization weighted index of all domestic public direct selling companies with a market capitalization of at least $25 million. The index is rebalanced monthly, and no single issue is permitted to represent more than 20% of its total value. In such an event, the excess weighting would be redistributed among the other index components.
The DSCI fell in October and underperformed the DJIA during the month. The DSCI declined 5.3% in October versus a 1.4% drop in the DJIA. DSCI data is tracked back to March 1, 2020. The direct selling index has risen 18.4% since that date, less than the 30.1% increase for the DJIA.
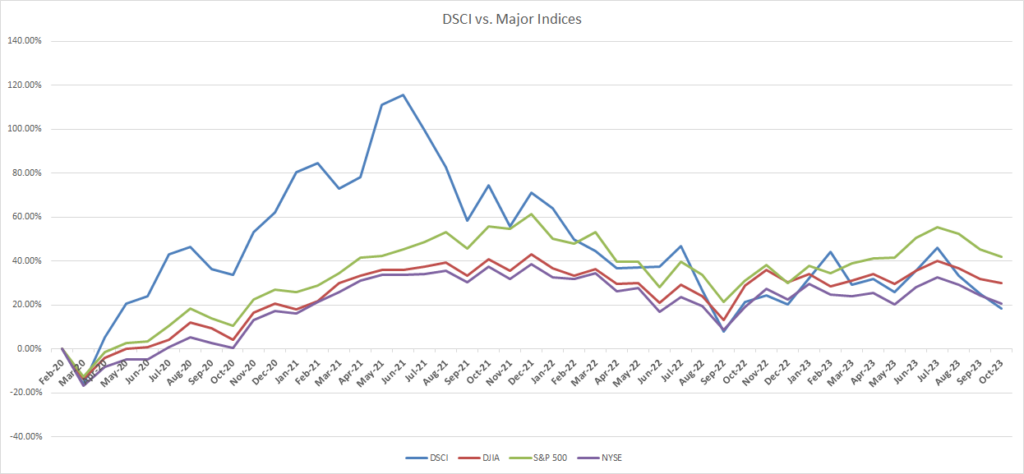
Large Cap
Betterware de Mexico (NASDAQ: BWMX) was the worst performing large cap DSCI component in October, declining 24.1%. Nevertheless, the shares have still gained 92.7% YTD, the second best mark of any large cap direct selling stock. Since the March 1, 2020 DSCI inception, BWMX is up 31.3%.
On October 26, BWMX reported 3Q 2023 consolidated net revenue and EBITDA of 3.12 billion pesos and 529.4 million pesos, both down slightly from 3.17 billion pesos and 534.9 million pesos, respectively, in the year-ago period. BWMX’s YTD results have come in moderately below its beginning-of-the-year estimates; however, over the first three quarters of 2023, the company has increased its profitability margins and improved its cash conversion cycle. After factoring in these trends, BWMX reduced its full-year 2023 net revenue and EBITDA guidance ranges to 12.5-12.8 billion pesos and 2.4-2.5 billion pesos from its previous estimates of 13.2-14.2 billion pesos and 2.6-2.8 billion pesos, respectively.
BWMX began trading in March 2020 after the company’s merger with SPAC sponsor DD3 Acquisition Corp. BWMX specifically targets the Mexican market; it serves three million households through distributors and associates in approximately 800 communities throughout Mexico.
Nu Skin Enterprises, Inc. (NYSE: NUS) fell 10.5% in October, its third successive monthly decline of more than 10%. NUS lost 55.0% over the first ten months of 2023, the worst performance of any large cap direct selling stock index member. Since the March 2020 establishment of the DSCI, NUS has lost 19.5% of its value. In contrast, the direct selling stock index and the Dow Jones Industrial Average gained 18.4% and 30.1%, respectively, over that period.
On November 1, NUS reported 3Q 2023 revenue and adjusted EPS of $498.8 million and $0.56 versus $537.8 million and $0.47, respectively, in 3Q 2022. Continued U.S. dollar strength and macroeconomic challenges in several key markets negatively affected consumer spending and customer acquisition, particularly in NUS’s Mainland China and Americas segments. Indeed, the company’s customer count in 3Q 2023 fell to 978,907, down 21% from the year-ago period. In turn, NUS reduced its full-year 2023 revenue and adjusted EPS guidance ranges to $1.92-$1.96 billion and $1.62-$1.77 from $2.00-$2.08 billion and $2.30-$2.60, respectively.
Herbalife Nutrition, Inc. (NYSE: HLF) rose 1.9% in October, making it the second best performing large cap DSCI member during the month. Even with the solid October performance, HLF has lost 4.2% over the first ten months of 2023. HLF is down 56.0% since the March 2020 establishment of the DSCI, making it the worst performing DSCI large cap stock which has traded continuously since index inception.
On November 1, HLF reported 3Q 2023 net sales of $1.28 billion, down slightly from $1.30 billion in the year-ago period. The company’s adjusted diluted EPS also declined, falling to $0.65 in 3Q 2023 versus $0.91 in 3Q 2022. HLF management says its momentum is building steadily and that it is on a path to achieve sustainable growth. Furthermore, the company believes it realized its third consecutive quarter of improved year-over-year sales trends in 3Q 2023.
HLF has implemented a Transformation Program which is expected to deliver more than $90 million in annual savings. About $60 million of these savings will be realized in 2023, up from its previous $45 million estimate.
Medifast, Inc. (NYSE: MED) shares dropped 7.6% in October, bringing its YTD loss to 40.0%. MED’s decline over the first ten months of 2023 pushed its performance since the March 1, 2020 establishment of the DSCI to a loss of 13.0%. MED’s annual dividend rate is $6.60 per share, making its dividend yield a very attractive 9.4%.
In August, MED reported 2Q 2023 revenue of $296.2 million, down 34.7% from $453.3 million in 2Q 2022. Similarly, diluted EPS in the second quarter fell to $2.77 from $3.42 in the year-ago period. Revenue and earnings in 2Q 2023 were affected by a decrease in the number of active earning OPTAVIA Coaches and the decline in productivity per active earning OPTAVIA Coach.
MED will report its 3Q 2023 results after the stock market closes on November 6. The company’s previously issued 3Q 2023 revenue and diluted EPS guidance ranges are $220 million to $240 million and $0.71 to $1.32, respectively.
USANA Health Sciences, Inc. (NYSE: USNA) fell 22.3% in October, its second consecutive monthly decline. The decline pushed USNA’s YTD performance from a gain of 10.2% through September 30 to a loss of 14.4% through October 31. Since the March 2020 inception of the DSCI, USANA shares have lost 31.1% compared with 18.4% and 30.1% increases for the direct selling index and the DJIA, respectively.
On October 24, USANA reported 3Q 2023 revenue and diluted EPS of $213 million and $0.59, both down from $233 million and $0.78, respectively, in 3Q 2022. USANA’s 3Q 2023 results were held back by challenging economic conditions across many of USANA’s regions, inflationary pressures, and a lower cadence of promotional activity. Consequently, the company revised its net sales and diluted EPS outlooks for full-year 2023 to $900-$920 million and $2.80-$3.05 from $900-$950 million and $2.65-$3.30, respectively.
eXp World Holdings, Inc. (NASDAQ: EXPI), the DSCI’s second largest component and its best performer since its March 2020 establishment, lost 18.3% in October, marking its second successive monthly decline of more than 15% (negative 15.5% in September). The October loss pared EXPI’s YTD increase to a still impressive 19.8%. EXPI shares have gained 177.6% over the 44 months that the DSCI has been computed.
On November 2, EXPI, the fastest growing real estate brokerage in the world, reported 3Q 2023 revenue and adjusted EBITDA of $1.21 billion and $19.0 million versus $1.24 billion and $12.3 million, respectively, in 3Q 2022. Transaction volume in 3Q 2023 declined 4% versus the year-ago period to $48.5 billion, as persistently high mortgage rates kept many buyers sidelined. The number of agents on EXPI’s realty platform reached 89,156 as of September 30, 2023, up about 1% from 88,248 on June 30, 2023.
A leading provider of financial services in the U.S. and Canada, and the largest market cap stock in the DSCI, Primerica, Inc. (NYSE: PRI) lost 1.5% in October, cutting its YTD gain to 34.8%. Since the March 2020 establishment of the DSCI, PRI has gained 74.5%. Both these YTD and 44-month gains markedly surpass the respective 3.6% and 18.4% gains in the direct selling index.
In August, PRI reported 2Q 2023 adjusted operating revenue of $689.6 million, up 3% from $671.8 million in the year-ago period. Furthermore, adjusted diluted EPS in 2Q 2023 reached $3.99, an increase from $3.38 in 2Q 2022. PRI will release its 3Q 2023 results on November 8.
In October and for the third consecutive month, Nature’s Sunshine Products, Inc. (NASDAQ: NATR) was the best performing DSCI large cap component. NATR gained 8.0% in October compared with a 3.6% loss in the direct selling index. This performance added to the stock’s YTD gain of 115.1%, the best of any large cap DSCI component. NATR boasts the second best long-term performance of any DSCI member, +130.5% since the March 1, 2020 establishment of the index. (EXPI leads with a 177.6% long-term gain.)
In August, NATR, which markets and distributes nutritional and personal care products in more than 40 countries, reported 2Q 2023 net sales of $116.5 million, up 12% from $104.5 million in the year-ago period. Adjusted EBITDA likewise increased in 2Q 2023 to $11.3 million from $9.0 million in 2Q 2022. NATR projects full-year 2023 net sales and adjusted EBITDA to be $440-$455 million and $34-$38 million, respectively. The company will release its 3Q 2023 results on November 7 after the stock market closes.
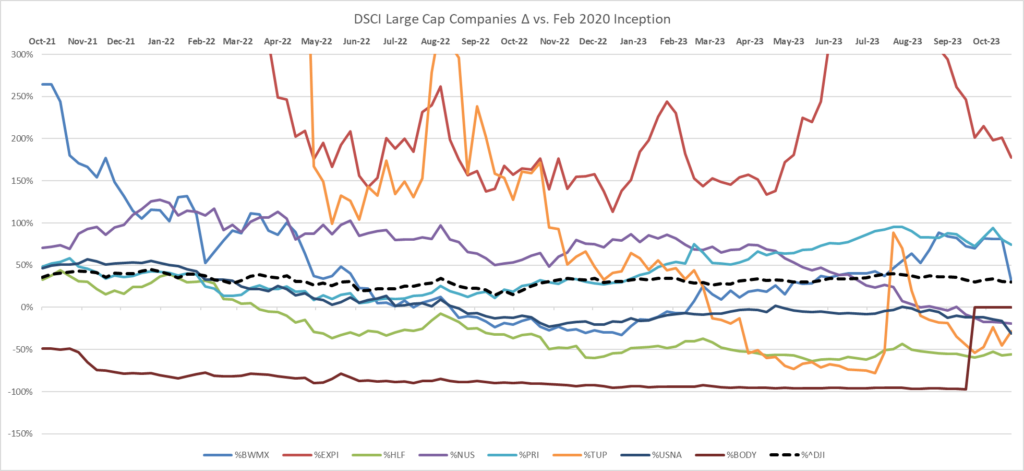
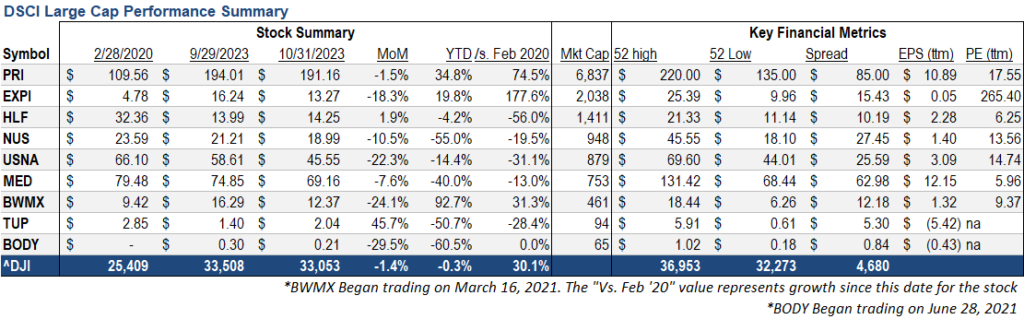
Note: For the purposes of this report, Direct Selling Capital considers companies with a market capitalization in excess of $1 billion “Large Cap.”
Small Cap
Our small cap tracking set performed slightly better than the large cap DSCI components in October. Three small caps rose during the month, while five fell. Interestingly, seven of the eight small cap stocks moved by double-digit percentage points (two up and five down) in October.
LifeVantage Corporation (NADAQ: LFVN), a health and wellness company with products designed to activate optimal health processes, rose 16.3% in October. Over the first ten months of 2023, LFVN has gained 101.6%; since DSCI inception, it has lost 37.0%. In late August, LFVN reported 4Q FY23 (quarter ended June 30, 2023) revenue and adjusted EPS of $54.2 million and $0.17 versus $50.9 million and $0.01, respectively, in the year-ago period.
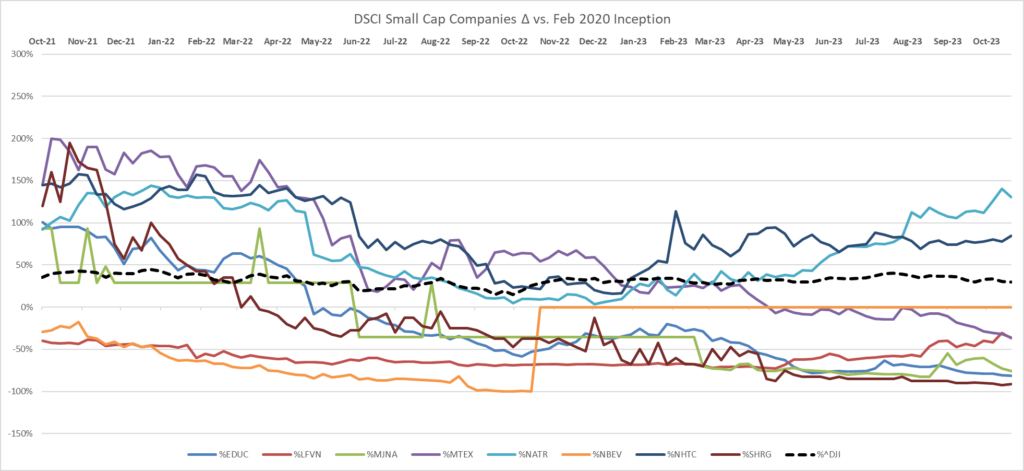

Short Interest Data & Analysis
The following chart is an aggregate index of “days to cover” among the entire tracking set. Days to cover (DTC) is a measurement determined by dividing the total outstanding short interest by average daily trading volume.
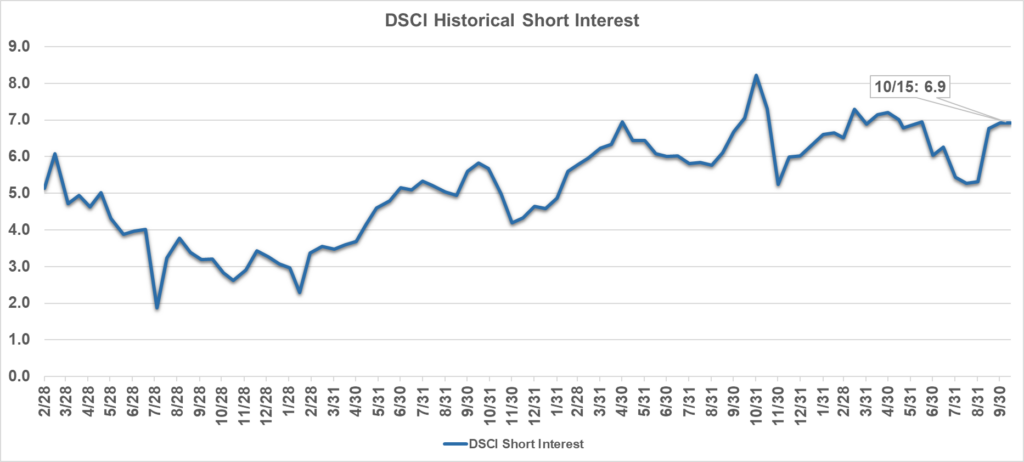
As indicated in the chart above, short interest in DSCI stocks was 6.9 days in mid-October, flat versus the reading at the end of September and up slightly from 6.8 days in mid-September. The biggest absolute rise in DTC from the end of September to mid-October for a DSCI component was EXPI’s increase to 20.1 days from 18.4 days.
Short interest can be a difficult indicator to analyze. On the one hand, an increase in short interest can be a bearish sign in that it indicates an increased view among investors that a stock is likely to decline based on any number of factors, such as a belief that the company’s fundamentals are deteriorating or that it has run too far, too fast. On the other hand, as a stock moves higher, a significant short interest can serve as extra fuel on the fire as investors scramble to “buy to cover” their short positions and mitigate losses.
Analyst Sentiment Index
Our Analyst Sentiment Index improved in October from September. The proportion of sell-side analysts maintaining “buy” and “hold” ratings on industry stocks rose to about 97% in October from 90% in September. Conversely, the percentage of stocks which analysts recommended selling last month fell to just 3% from 10% in September.
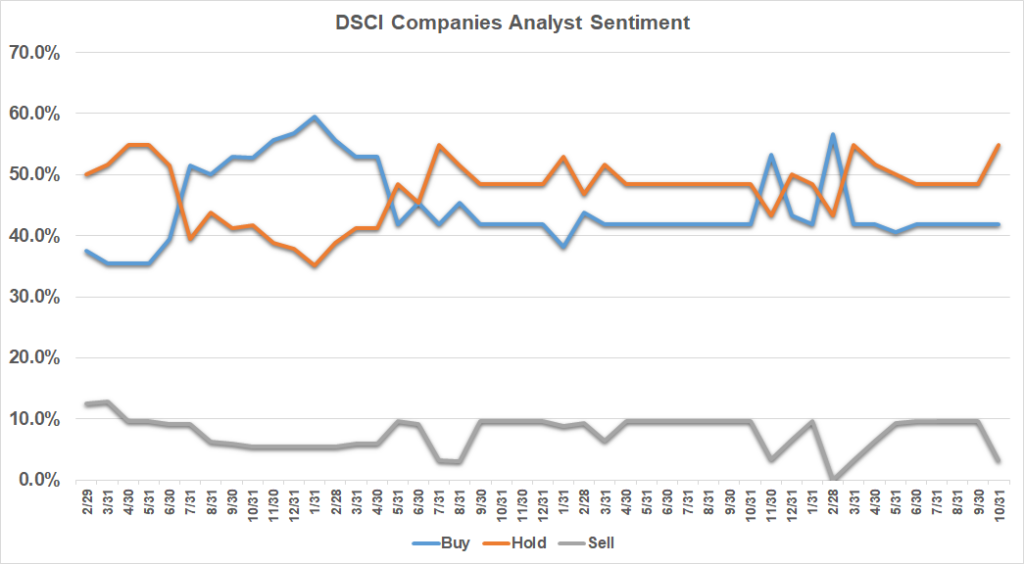 Methodology: The DSCA Analyst Sentiment Index is a consensus tracking tool that aggregates and averages the recommendations of all covering analysts across all public direct selling companies.
 -
September 2023
Brought to you by Direct Selling Capital Advisors
Direct Selling Index Drops 6.1% in September, its Second Consecutive Monthly Loss; Despite the Decline, Direct Selling Stocks are Up 9.4% Through the First Three Quarters of 2023
The Direct Selling Capital Advisors Direct Selling Index (DSCI) dropped 6.1% in September, its second consecutive monthly decline (negative 8.7% in August). The Dow Jones Industrials also declined in September, but its 3.5% loss during the month represented outperformance versus the direct selling index. More constructively, the DSCI has markedly outpaced the Dow over the first three quarters of 2023, rising 9.4% versus only 1.1% for the broad market index representing 30 of the world’s biggest and most well-known corporations.
In September 2023, both large cap and small cap DSCI components struggled. All nine large caps declined during the month, four by more than 10%. Similarly, six of the seven small direct selling stocks fell in September. Five small caps declined by double digit percentage points.
From a longer-term perspective, the DSCI has appreciated an aggregate 25.1% since its March 1, 2020 inception. The DJIA has outperformed the direct selling index over that period. Since March 1, 2020, the DJIA has gained 31.9%.
The stock market posted its worst monthly result of the year in September. The damages realized in the broader S&P 500 (negative 5%) and NASDAQ Composite (negative 6%) indices were even deeper than in the DJIA. Investors feared that the Fed’s policy of keeping short term interest rates “higher for longer,” coupled with $90+ oil prices (which have translated into $5 per gallon gasoline prices in some regions) and a strengthening US dollar, may cause an economic hard landing. As recently as July, market participants were much more sanguine that the economy could avoid a downturn.
Factoring into this pessimism are certain parallels to conditions which existed in 2000 before the dot.com market bust. Then, as now, the market was led by a small group of highly valued technology stocks, and the Fed was engaged in a tightening cycle.
Looking Forward
DSCI components will begin announcing their 3Q 2023 results in late October, and when those reports are issued, their content and quality will likely be the next key driver for DSCI member stock prices. Until then, the stock market (which has continued to be weak in the first few days of October) will greatly influence direct selling stock valuations.
As noted earlier, some bearish investors are expressing concern about some similarities between today’s stock market and the financial conditions in 2000. However, one significant difference between the present stock market and the 2000 market is a much more conservative valuation. According to consensus estimates, the S&P 500 trades at around 19x and 17x earnings projections for 2023 and 2024, respectively. In 2000, the typical stock traded at around a 25x P/E multiple.
A further argument that the stock market may face less downside risk than many analysts believe are modest high yield and investment grade bond spreads. More specifically, junk bonds and investment grade bonds trade at about 411 and 126 basis point (bp) yield premiums, respectively, to comparable US Treasuries. These premiums are narrower than historic average spreads of around 450 and 150 bp, respectively, and are much smaller than spreads seen during times of economic distress. Phrased differently, high yield and investment grade bond investors seem much less worried about a potential 2024 recession than are stock market participants.
CHARTS & ANALYSIS
Direct Selling Capital Advisors Index
The DSCI is a market capitalization weighted index of all domestic public direct selling companies with a market capitalization of at least $25 million. The index is rebalanced monthly, and no single issue is permitted to represent more than 20% of its total value. In such an event, the excess weighting would be redistributed among the other index components.
The DSCI fell in September and underperformed the DJIA during the month. The DSCI declined 6.1% in September versus a 3.5% drop in the DJIA. DSCI data is tracked back to March 1, 2020. The direct selling index has risen 25.1% since that date, less than the 31.9% increase for the DJIA.
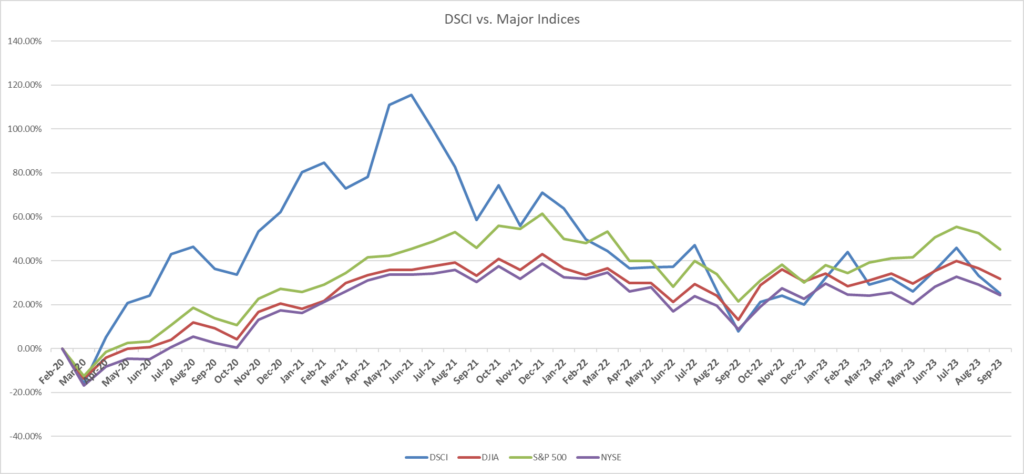
Large Cap
The shares of Betterware de Mexico (NASDAQ: BWMX) dipped 4.5% in September but still outperformed the DSCI, which lost 6.1% during the month. Despite the modest retrenchment in September, BWMX has over the first nine months of 2023 gained a remarkable 153.7%, by far the best mark of any direct selling stock. Since the March 1, 2020 DSCI inception, BWMX is up 73%.
In late July, BWMX reported 2Q 2023 consolidated net revenue and EBITDA of 3.22 billion pesos and 717.4 million pesos versus 3.24 billion pesos and 615.3 million pesos, respectively, in the year-ago period. Importantly, BWMX’s margins throughout 1H 2023 returned to early 2022 levels. BWMX reiterated full-year 2023 net revenue and EBITDA guidance ranges of 13.2-14.2 billion pesos and 2.6-2.8 billion pesos, respectively.
BWMX began trading in March 2020 after the company’s merger with SPAC sponsor DD3 Acquisition Corp. BWMX specifically targets the Mexican market; it serves three million households through distributors and associates in approximately 800 communities throughout Mexico.
Nu Skin Enterprises, Inc. (NYSE: NUS) fell 11.2% in September which represented its second consecutive monthly decline of more than 10%. Factoring in this performance, NUS lost 49.7% over the first nine months of 2023, the worst performance of any large cap direct selling stock index member. Since the March 2020 establishment of the DSCI, NUS has lost 10.1% of its value. In contrast, the direct selling stock index and the Dow Jones Industrial Average gained 25.1% and 31.9%, respectively, over that period.
In August, NUS reported 2Q 2023 revenue and adjusted EPS of $500.3 million and $0.54, both down from $560.6 million and $0.77, respectively, in 2Q 2022. Macroeconomic issues and associated prices had a dampening effect on consumer spending and customer acquisition. NUS reduced its full-year 2023 revenue and adjusted EPS guidance ranges to $2.00-$2.08 billion and $2.30-$2.60 from $2.03-$2.18 billion and $2.35-$2.75, respectively.
Herbalife Nutrition, Inc. (NYSE: HLF) dipped 6.9% in September. The decline caused its YTD performance to shift from a slight gain at the end of August to a 6% loss as of September 30. HLF has lost 56.8% since the March 2020 establishment of the DSCI, making it the worst performing DSCI large cap stock which has traded continuously since index inception.
In August, HLF reported 2Q 2023 net sales of $1.31 billion, down 5.7% from $1.39 billion in 2Q 2022. The company’s adjusted diluted EPS also declined, falling to $0.74 in 2Q 2023 versus $0.96 in the year-ago period. Despite the lower revenue in the quarter, HLF said 2Q 2023 marked its second consecutive quarter of improved year-over-year sales trends.
HLF has implemented a Transformation Program which is expected to deliver more than $90 million in annual savings. About $45 million of these savings will be realized in 2023.
Medifast, Inc. (NYSE: MED) shares fell 11.3% in September, bringing its YTD loss to 35.1%. MED’s decline over the first nine months of 2023 pushed its performance since the March 1, 2020 establishment of the DSCI to a loss of 5.8%. MED’s annual dividend rate is $6.60 per share, making its dividend yield a very attractive 8.9%.
In August, MED reported 2Q 2023 revenue of $296.2 million, down 34.7% from $453.3 million in 2Q 2022. Similarly, diluted EPS in the second quarter fell to $2.77 from $3.42 in the year-ago period. Revenue and earnings in 2Q 2023 were affected by a decrease in in the number of active earning OPTAVIA Coaches and the decline in productivity per active earning OPTAVIA Coach. For the third quarter of 2023, MED expects to report revenue and diluted EPS of $220 million to $240 million and $0.71 to $1.32, respectively.
USANA Health Sciences, Inc. (NYSE: USNA) dropped 8.8% in September, cutting its YTD gain to 10.2%. Since the March 2020 inception of the DSCI, USANA shares have lost 11.3% compared with 25.1% and 31.9% increases for the direct selling index and the DJIA, respectively.
In July, USANA reported 2Q 2023 revenue and diluted EPS of $238 million and $0.89, both down from $264 million and $1.00, respectively, in 2Q 2022. USANA’s 2Q 2023 results were boosted by sequential improvement in mainland China due in part to a local promotion offered there and continued progress on several key strategic initiatives. The company’s net sales and diluted EPS outlooks for full-year 2023 are $900-$950 million and $2.65-$3.30, respectively.
eXp World Holdings, Inc. (NASDAQ: EXPI), the DSCI’s second largest component and by far its best performer since its March 2020 establishment, lost 15.5% in September. Last month’s loss pares EXPI’s YTD increase to a still very impressive 46.6%. EXPI shares have gained 239.7% over the 43 months that the DSCI has been computed.
In August, EXPI, the fastest growing real estate brokerage in the world, reported 2Q 2023 revenue and adjusted EBITDA of $1.23 billion and $24.7 million, both down from $1.42 billion and $26.9 million, respectively, in 2Q 2022. Transaction volume was lower in 2Q 2023 as persistently high mortgage rates kept many buyers sidelined. The number of agents on EXPI’s realty platform reached 88,248 on June 30, 2023, up about 1% from 87,327 as of March 31, 2023.
A leading provider of financial services in the U.S. and Canada, and the largest market cap stock in the DSCI, Primerica, Inc. (NYSE: PRI) lost 3.5% in September, cutting its YTD gain to 36.8%. Since the March 2020 establishment of the DSCI, PRI has gained 77.1%. Both these YTD and 43-month gains markedly surpass the respective 9.4% and 25.1% gains in the direct selling index.
In August, PRI reported 2Q 2023 adjusted operating revenue of $689.6 million, up 3% from $671.8 million in the year-ago period. Furthermore, adjusted diluted EPS in 2Q 2023 reached $3.99, an increase from $3.38 in 2Q 2022. PRI’s improved 2Q 2023 results reflect the benefit of continued, predictable growth in PRI’s Term Life segment. In addition, the company’s Investment and Savings Product unit results benefited from the equity market’s recovery, which in turn positively impacted client asset values.
For the second consecutive month, Nature’s Sunshine Products, Inc. (NASDAQ: NATR) was the best performing DSCI large cap component. NATR lost just 1.4% during September, much narrower than the 6.1% decline in the direct selling index. This performance slightly reduced the stock’s YTD gain to 99.2%, the second highest of any direct selling index member (to BWMX’s 153.7% YTD increase). Similarly, NATR boasts the second best long-term performance of any DSCI member, +113.4% since the March 1, 2020 establishment of the index. (EXPI leads with a 239.7% long-term gain.)
In August, NATR, which markets and distributes nutritional and personal care products in more than 40 countries, reported 2Q 2023 net sales of $116.5 million, up 12% from $104.5 million in the year-ago period. Adjusted EBITDA likewise increased in 2Q 2023 to $11.3 million from $9.0 million in 2Q 2022. Strength in the Asia/Pacific region, further stabilization in Central and Eastern Europe, and a return to growth in North America, were all factors in NATR’s improved results. NATR expects full-year 2023 net sales and adjusted EBITDA to be $440-$455 million and $34-$38 million, respectively.
The Beachbody Company, Inc. (NYSE: BODY), a leading subscription health and wellness company, dropped 27.9% in September. YTD the stock has lost 43.9% of its value.
In August, BODY reported 2Q 2023 revenue of $134.9 million versus $179.1 million in the year-ago period.nThe company’s 2Q 2023 adjusted EBITDA was negative $4.8 million compared with a $1.5 million loss in 2Q 2022. BODY has restructured the financial covenants in its financing agreement and paid down its debt level by $15 million to approximately $35 million, which reduces interest expense and gives the company additional flexibility to execute on its strategies. BODY projects 3Q 2023 revenue and adjusted EBITDA will be $120-$130 million and negative $3 million to negative $8 million, respectively.
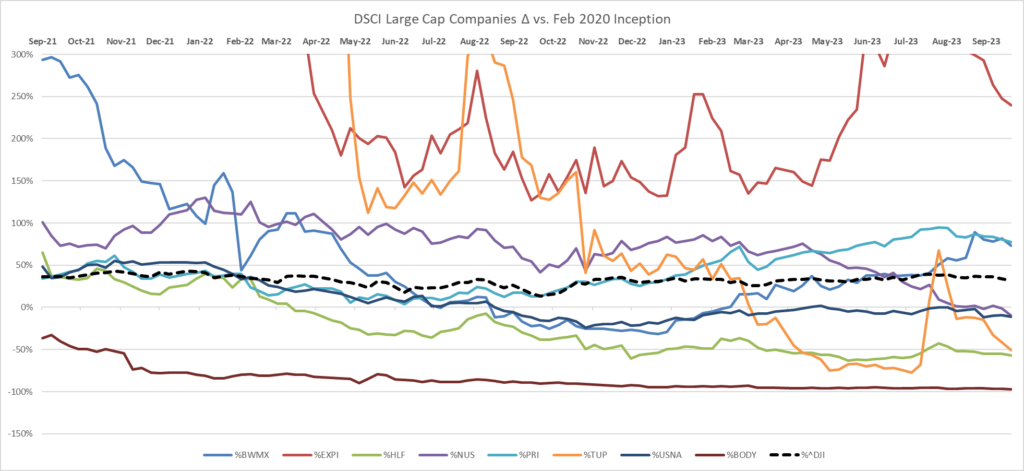
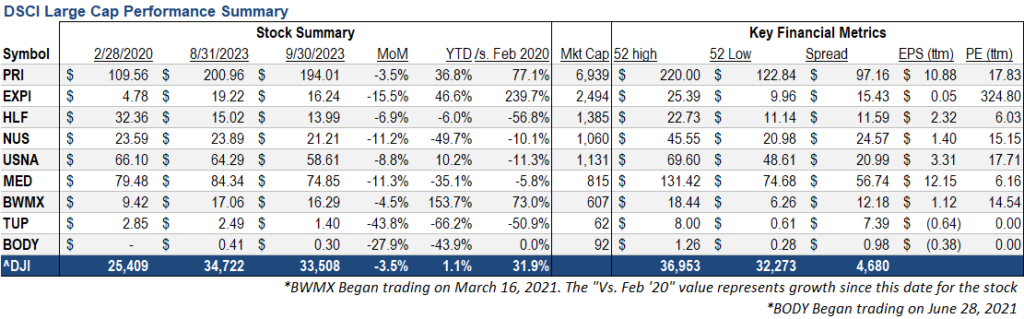
Note: For the purposes of this report, Direct Selling Capital considers companies with a market capitalization in excess of $1 billion “Large Cap.”
Small Cap
Our small cap tracking set performed about in line with the large cap DSCI components in September. Only one small cap rose during the month, while six fell. Interestingly, six of the seven small cap stocks moved by double-digit percentage points (one up and five down) in September.
Natural Health Trends Corp. (NASDAQ: NHTC), a marketer of premium quality personal care, wellness and “quality of life” products, declined just 1.9% in September. Over the first three quarters of 2023 and since DSCI inception, NHTC has gained 54.5% and 75.6%, respectively. In early August, NHTC reported 2Q 2023 revenue and operating income of $10.5 million and negative $743,000 versus $13.4 million and positive $215,000, respectively, in the year-ago period.
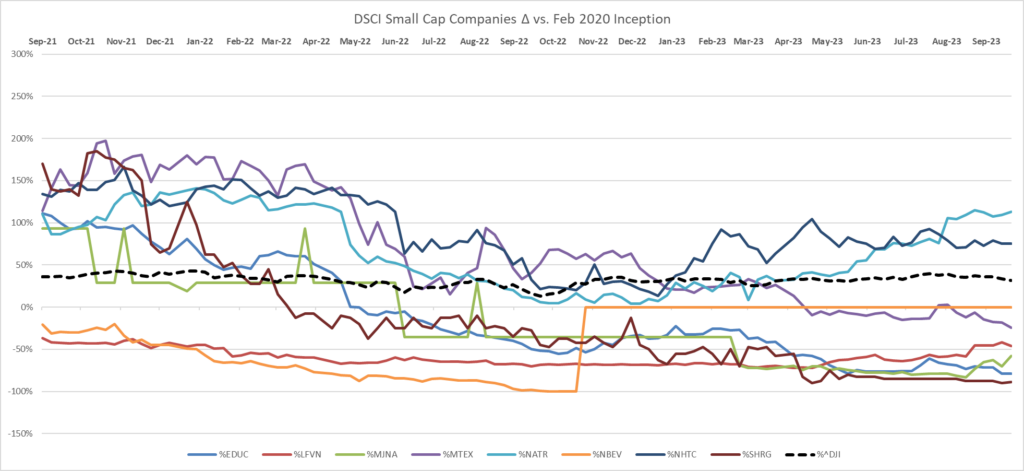
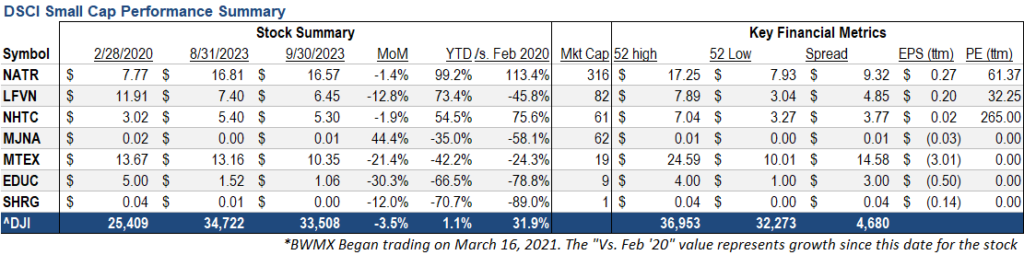
Short Interest Data & Analysis
The following chart is an aggregate index of “days to cover” among the entire tracking set. Days to cover (DTC) is a measurement determined by dividing the total outstanding short interest by average daily trading volume.
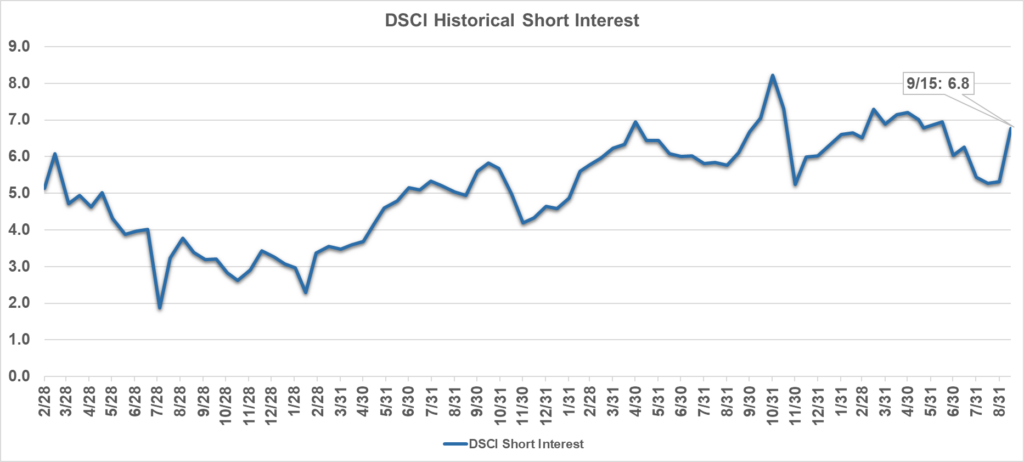
As indicated in the chart above, short interest in DSCI stocks was 5.3 days in mid-September, flat versus the readings at both the end of August and mid-August. The 5.3 DTC figure is the lowest reading for the direct selling index since a 4.6-days data point in mid-January 2023. The biggest absolute rise in DTC from the end of August to mid-September for a DSCI component was EXPI’s increase to 18.1 days from 11.6 days.
Short interest can be a difficult indicator to analyze. On the one hand, an increase in short interest can be a bearish sign in that it indicates an increased view among investors that a stock is likely to decline based on any number of factors, such as a belief that the company’s fundamentals are deteriorating or that it has run too far, too fast. On the other hand, as a stock moves higher, a significant short interest can serve as extra fuel on the fire as investors scramble to “buy to cover” their short positions and mitigate losses.
Analyst Sentiment Index
Our Analyst Sentiment Index was unchanged in September from August. During both months, the proportion of sell-side analysts maintaining “buy” and “hold” ratings on industry stocks was about 90%. Conversely, the percentage of stocks which analysts recommend selling in each month was approximately 10%.
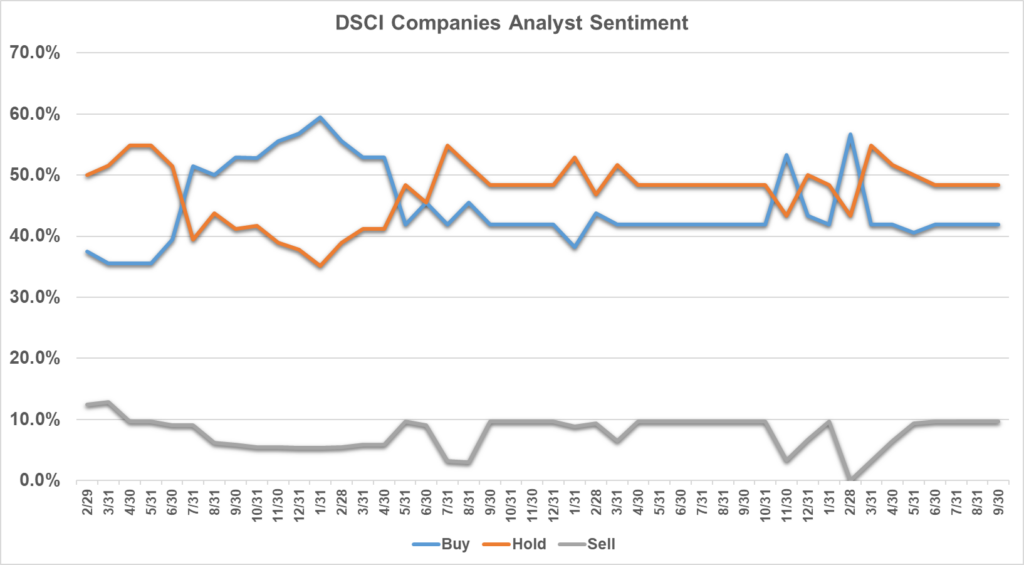
Methodology: The DSCA Analyst Sentiment Index is a consensus tracking tool that aggregates and averages the recommendations of all covering analysts across all public direct selling companies.
-
August 2023
Brought to you by Direct Selling Capital Advisors
Direct Selling Index Declines 8.7% in August and Underperforms DJIA During the Month; Nevertheless, DSCI Has Gained 16.6% Over the First Eight Months of 2023.
The Direct Selling Capital Advisors Direct Selling Index (DSCI) fell 8.7% in August, reversing part of the robust gains realized in July and June (+7.6% in each month). The Dow Jones Industrials also declined in August, but its 2.4% loss during the month represented outperformance versus the direct selling index. More constructively, the DSCI has markedly outpaced the Dow over the first eight months of 2023, rising 16.6% versus only 4.8% for the broad market index representing 30 of the world’s biggest and most well-known corporations.
In August 2023, small cap DSCI components generally performed better than their large cap peers. This relative move represented a significant departure from the trend which had prevailed over the first seven months of 2023. More specifically, three small caps rose during August, and an equal number fell. In contrast, just two large cap members appreciated during the month, while seven large direct selling stocks lost ground.
Furthermore, August 2023 represented perhaps the most volatile DSCI stock performance month since we began tracking the index 3 ½ years ago. Seven of the nine large cap components moved up or down by more than 10% in August (two up and five down), and five of the six small cap components experienced double digit percentage price changes (three up and two down) during the month.
From a longer-term perspective, the DSCI has appreciated an aggregate 33.3% since its March 1, 2020 inception. The DJIA has slightly outperformed the direct selling index over that period. Since March 1, 2020, the DJIA has gained 36.7%.
In August 2023, the stock market, as measured by the S&P 500 and NASDAQ 100 indices, posted its first monthly decline since February. Several factors, including Fitch Ratings’ decision early in the month to downgrade the U.S. government’s credit rating to AA+ from AAA, and a general sentiment change that the Fed will likely keep short-term interest rates “higher for longer,” weighed on equity markets in August. Positively, the stock market rallied in the last week of August after enduring a difficult first three weeks of the month.
Looking Forward
With DSCI components’ having reported their 2Q 2023 results in late July and through the first few weeks of August, movements in direct selling stocks in September will likely be primarily influenced by the overall direction of the stock market.
On the surface, this dependence on the movement in broad indices in September may not be the most optimal situation. After all, September has historically been the worst month of the year for the stock market, according to nearly 100 years of Dow Jones Market Data. In addition, some consumers may be forced to start pulling back on purchases as student loan interest began to accrue on September 1, 2023 for the first time in three years. Payments will re-commence beginning in October.
On the other hand, the Fed is expected to leave interest rates unchanged at its next rate-setting meeting on September 20. Also, the U.S. Bureau of Labor Statistics is scheduled to release CPI data for August on September 13. The last several monthly readings have shown cooling inflation, and if this release were to follow that same pattern, investors could potentially gain more confidence that the Fed will leave interest rates unchanged through year-end 2023.
CHARTS & ANALYSIS
Direct Selling Capital Advisors Index
The DSCI is a market capitalization weighted index of all domestic public direct selling companies with a market capitalization of at least $25 million. The index is rebalanced monthly, and no single issue is permitted to represent more than 20% of its total value. In such an event, the excess weighting would be redistributed among the other index components.
The DSCI fell in August and underperformed the DJIA during the month. The DSCI declined 8.7% in August versus a 2.4% drop in the DJIA. DSCI data is tracked back to March 1, 2020. The direct selling index has risen 33.3% since that date, slightly less than the 36.7% increase for the DJIA.
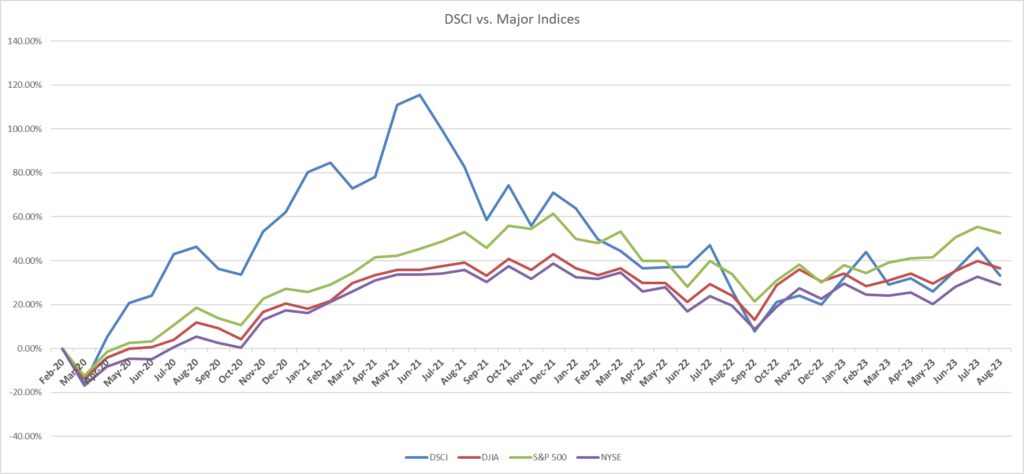
Large Cap
In August, the shares of Betterware de Mexico (NASDAQ: BWMX) continued their extraordinary performance in 2023. BWMX rose 20.4% during the month, bringing its YTD gain to a DSCI-best 165.7%. Since the DSCI inception on March 1, 2020, BWMX is up 81.1%.
In late July, BWMX reported 2Q 2023 consolidated net revenue and EBITDA of 3.22 billion pesos and 717.4 million pesos versus 3.24 billion pesos and 615.3 million pesos, respectively, in the year-ago period. The company grew the number of its distributors by 5% in 2Q 2023 compared with 1Q 2023 and achieved a 4.0% sales increase in the period relative to 1Q 2023. Equally important, BWMX’s margins throughout 1H 2023 returned to early 2022 levels. BWMX reiterated full-year 2023 net revenue and EBITDA guidance ranges of 13.2-14.2 billion pesos and 2.6-2.8 billion pesos, respectively.
BWMX began trading in March 2020 after the company’s merger with SPAC sponsor DD3 Acquisition Corp. BWMX specifically targets the Mexican market; it serves three million households through distributors and associates in approximately 800 communities throughout Mexico.
Nu Skin Enterprises, Inc. (NYSE: NUS) fell 18.7% in August. Factoring in this decline, NUS lost 43.3% over the first eight months of 2023, which represents the worst performance of any large cap direct selling stock index member. Since the March 2020 establishment of the DSCI, NUS has eked out a 1.3% gain, but that still represents marked long-term underperformance versus both the direct selling stock index (+33.3%) and the Dow Jones Industrial Average (+36.7%).
In early August, NUS reported 2Q 2023 revenue and adjusted EPS of $500.3 million and $0.54, both down from $560.6 million and $0.77, respectively, in 2Q 2022. Macroeconomic issues and associated prices had a dampening effect on consumer spending and customer acquisition. NUS reduced its full-year 2023 revenue and adjusted EPS guidance ranges to $2.00-$2.08 billion and $2.30-$2.60 from $2.03-$2.18 billion and $2.35-$2.75, respectively.
Herbalife Nutrition, Inc. (NYSE: HLF) dropped 7.5% in August, ending a two-month string of double digit percentage gains (+22.7% in July and +11.8% in June). Even with the August decline, HLF’s YTD performance through August 31 remained positive (+0.9%). Still, HLF has lost 53.6% since the March 2020 establishment of the DSCI, making it the worst performing DSCI large cap stock which has traded continuously since index inception.
In early August, HLF reported 2Q 2023 net sales of $1.31 billion, down 5.7% from $1.39 billion in 2Q 2022. The company’s adjusted diluted EPS also declined, falling to $0.74 in 2Q 2023 versus $0.96 in the year-ago period. Despite the lower revenue in the quarter, HLF said 2Q 2023 marked its second consecutive quarter of improved year-over-year sales trends.
HLF has implemented a Transformation Program which is expected to deliver more than $90 million in annual savings. About $45 million of these savings will be realized in 2023.
Medifast, Inc. (NYSE: MED) shares lost 17.2% in August, reversing a significant portion of its 10.6% and 17.1% gains in July and June, respectively. YTD, MED is down 26.9%. More constructively, since the March 1, 2020 establishment of the DSCI, MED shares have gained 6.1%. MED’s annual dividend rate is $6.60 per share, making its dividend yield a very attractive 8.1%.
On August 7, MED reported 2Q 2023 revenue of $296.2 million, down 34.7% from $453.3 million in 2Q 2022. Similarly, diluted EPS in the second quarter fell to $2.77 from $3.42 in the year-ago period. Revenue and earnings in 2Q 2023 were affected by a decrease in in the number of active earning OPTAVIA Coaches and the decline in productivity per active earning OPTAVIA Coach.
For the third quarter of 2023, MED expects to report revenue and diluted EPS of $220 million to $240 million and $0.71 to $1.32, respectively.
USANA Health Sciences, Inc. (NYSE: USNA) edged 1.0% lower in August. Year to date, USNA has appreciated 20.8%. Since the March 2020 inception of the DSCI, USANA shares have lost 2.7% compared with 33.3% and 36.7% increases for the direct selling index and the DJIA, respectively.
In late July, USANA reported 2Q 2023 revenue and diluted EPS of $238 million and $0.89, both down from $264 million and $1.00, respectively, in 2Q 2022. USANA’s 2Q 2023 results were boosted by sequential improvement in mainland China, due in part to a local promotion offered there and continued progress on several key strategic initiatives. The company’s net sales and diluted EPS outlooks for full-year 2023 are $900-950 million and $2.65-$3.30, respectively.
eXp World Holdings, Inc. (NASDAQ: EXPI), the DSCI’s second largest component and by far its best performer since its March 2020 establishment, declined 22.9% in August. This drop reversed part of an extraordinary May-June-July period when the stock gained 31.7%, 31.8%, and 23.0%, respectively. August’s loss pares EXPI’s YTD increase to 73.5%. EXPI shares have gained an astounding 302.1% over the 42 months that the DSCI has been computed.
In early August, EXPI, the fastest growing real estate brokerage in the world, reported 2Q 2023 revenue and adjusted EBITDA of $1.23 billion and $24.7 million, both down from $1.42 billion and $26.9 million, respectively, in 2Q 2022. Transaction volume was lower in 2Q 2023 as persistently high mortgage rates kept many buyers sidelined.
The number of agents on EXPI’s realty platform reached 88,248 on June 30, 2023, up about 1% from 87,327 as of March 31, 2023. Furthermore, EXPI’s total agents in South Africa alone reached 1,000 in August 2023, up 74% from 574 in July 2022.
A leading provider of financial services in the U.S. and Canada, and the largest market cap stock in the DSCI, Primerica, Inc. (NYSE: PRI) lost 5.5% in August, cutting its YTD gain to a still very impressive 41.7%. Since the March 2020 establishment of the DSCI, PRI has gained 83.4%. Both these YTD and 42-month gains markedly surpass the respective 16.6% and 33.3% gains in the direct selling index.
On August 7, PRI reported 2Q 2023 adjusted operating revenue of $689.6 million, up 3% from $671.8 million in the year-ago period. Furthermore, adjusted diluted EPS in 2Q 2023 reached $3.99, an increase from $3.38 in 2Q 2022. PRI’s improved 2Q 2023 results reflect the benefit of continued, predictable growth in PRI’s Term Life segment. In addition, the company’s Investment and Savings Product unit results benefited from the equity market’s recovery, which in turn positively impacted client asset values.
PRI repurchased $110.8 million of its common stock in 2Q 2023, which brought its 1H 2023 share repurchases to $196.0 million. PRI expects to buy back about $179 million of its shares in 2H 2023.
Nature’s Sunshine Products, Inc. (NASDAQ: NATR) rose 20.5% in August, the best mark of any large cap DSCI component. In addition, NATR’s impressive August performance brought its YTD gain to 102.0%, the second highest of any direct selling index member (to BWMX’s 165.7% YTD increase). Similarly, NATR boasts the second best performance of any DSCI member, +116.5% since the March 1, 2020 establishment of the index. (EXPI leads with a 302.1% long-term gain.)
On August 9, NATR, which markets and distributes nutritional and personal care products in more than 40 countries, reported 2Q 2023 net sales of $116.5 million, up 12% from $104.5 million in the year-ago period. Adjusted EBITDA likewise increased in 2Q 2023 to $11.3 million from $9.0 million in 2Q 2022. Strength in the Asia/Pacific region, further stabilization in Central and Eastern Europe and a return to growth in North America, were all factors in NATR’s improved results.
NATR expects full-year 2023 net sales and adjusted EBITDA to be $440-$455 million and $34-$38 million, respectively.
The Beachbody Company, Inc. (NYSE: BODY), a leading subscription health and wellness company, fell 11.1% in August. YTD, the stock has lost 22.2% of its value.
On August 8, BODY reported 2Q 2023 revenue of $134.9 million versus $179.1 million in the year-ago period. The company’s 2Q 2023 adjusted EBITDA was negative $4.8 million compared with a $1.5 million loss in 2Q 2022. BODY has restructured the financial covenants in its financing agreement and paid down its debt level by $15 million to approximately $35 million, which reduces interest expense and gives the company additional flexibility to execute on its strategies.
BODY projects 3Q 2023 revenue and adjusted EBITDA to be $120-$130 million and negative $3 million to negative $8 million, respectively.
After rocketing more than 400% higher in July as perhaps the hottest meme stock in the market, Tupperware Brands Corporation (NYSE: TUP) declined a DSCI-worst 41.7% in August. The August drop brought TUP’s YTD loss to 39.9%, and its loss since the March 2020 establishment of the DSCI to 12.6%.
In early August, TUP finalized an agreement with its lenders to restructure its existing debt obligations, improving the company’s overall financial position by amending some credit obligations and extending the maturity of some debt facilities. In particular, the accord entailed the reduction/reallocation of approximately $150 million of cash interest and fees.
To date, TUP has still not filed its 10-K annual report for 2022 nor any 10-Qs in 2023, and it is not clear when it will be able to do so.
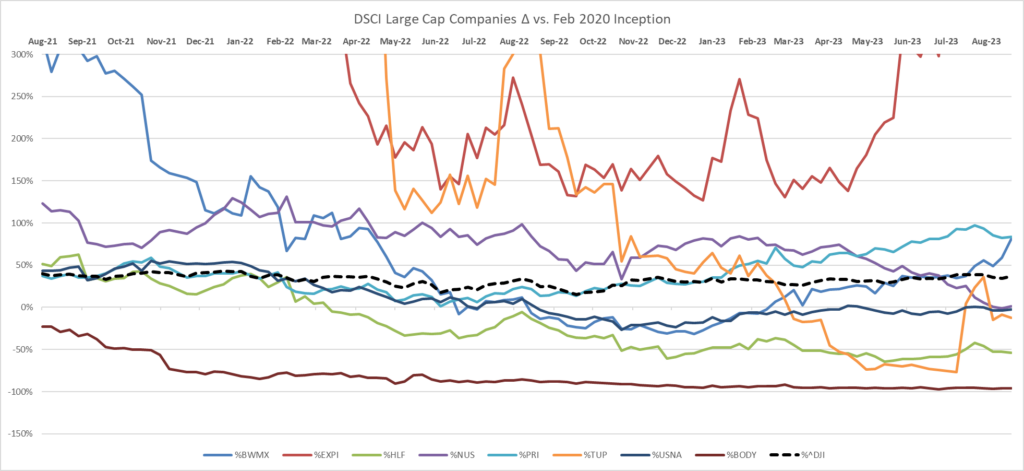

Small Cap
Our small cap tracking set generally outperformed the large cap DSCI components in August. Three small caps rose in the month, while the same number fell. Interestingly, five of the six small cap stocks moved by double-digit percentage points (in varying directions) during the month.
LifeVantage Corporation (NASDAQ: LFVN) led all DSCI components in August with a 46.2% gain. Over the first eight months of 2023, LFVN has soared 98.9%. LFVN, a leading health and wellness company with products designed to activate optimal health processes, reported 2Q 2023 revenue and adjusted diluted EPS of $54.2 million and $0.17 versus $50.9 million and $0.01, respectively, in the year-ago period.
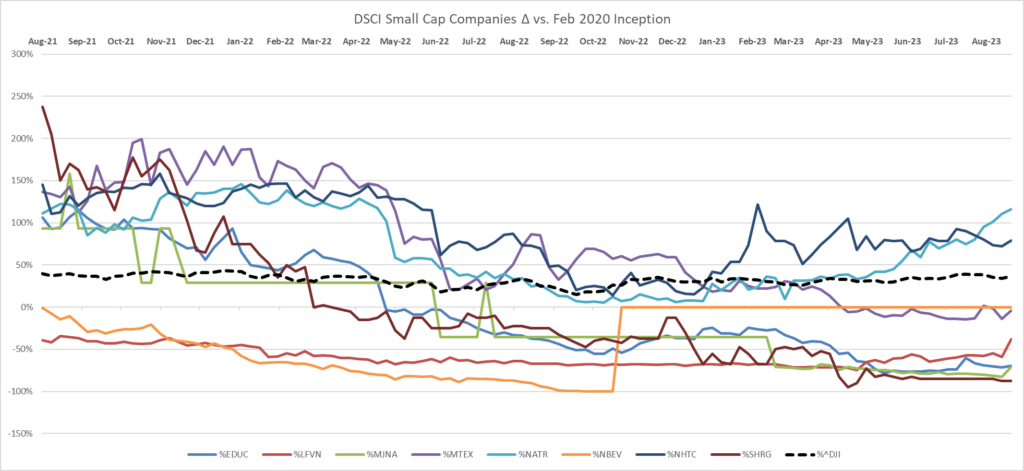
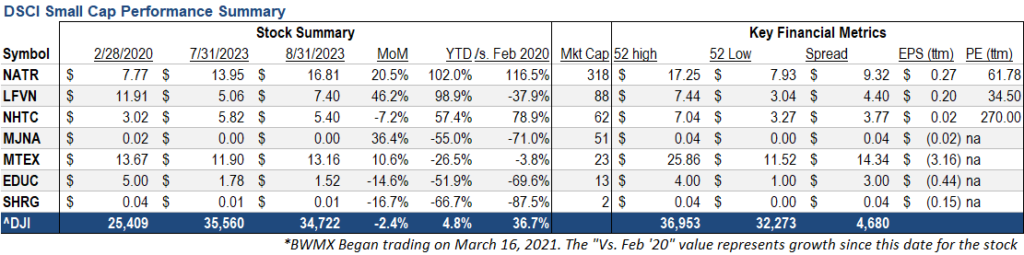
Short Interest Data & Analysis Analyst Sentiment Index
The following chart is an aggregate index of “days to cover” among the entire tracking set. Days to cover (DTC) is a measurement determined by dividing the total outstanding short interest by average daily trading volume.
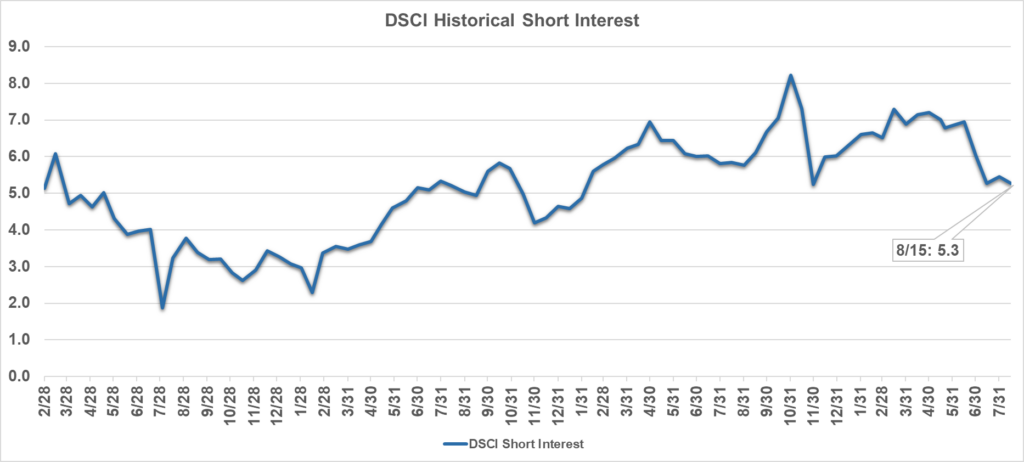
As indicated in the chart above, short interest in DSCI stocks was 5.3 days in mid-August, down slightly from 5.5 days at the end of July and flat versus 5.3 days in mid-July. The mid-August 5.3 DTC figure is the lowest reading for the direct selling index since a 4.6-days data point in mid-January 2023. The biggest absolute decrease in DTC from the end of July to mid-August for a DSCI component was NUS’s fall to 2.1 days from 3.2 days.
Short interest can be a difficult indicator to analyze. On the one hand, an increase in short interest can be a bearish sign in that it indicates an increased view among investors that a stock is likely to decline based on any number of factors, such as a belief that the company’s fundamentals are deteriorating or that it has run too far, too fast. On the other hand, as a stock moves higher, a significant short interest can serve as extra fuel on the fire as investors scramble to “buy to cover” their short positions and mitigate losses.
Analyst Sentiment Index
Our Analyst Sentiment Index was unchanged in August versus July. During both months, the proportion of sell-side analysts maintaining “buy” and “hold” ratings on industry stocks was about 90%. Conversely, the percentage of stocks which analysts recommend selling in each month was approximately 10%.
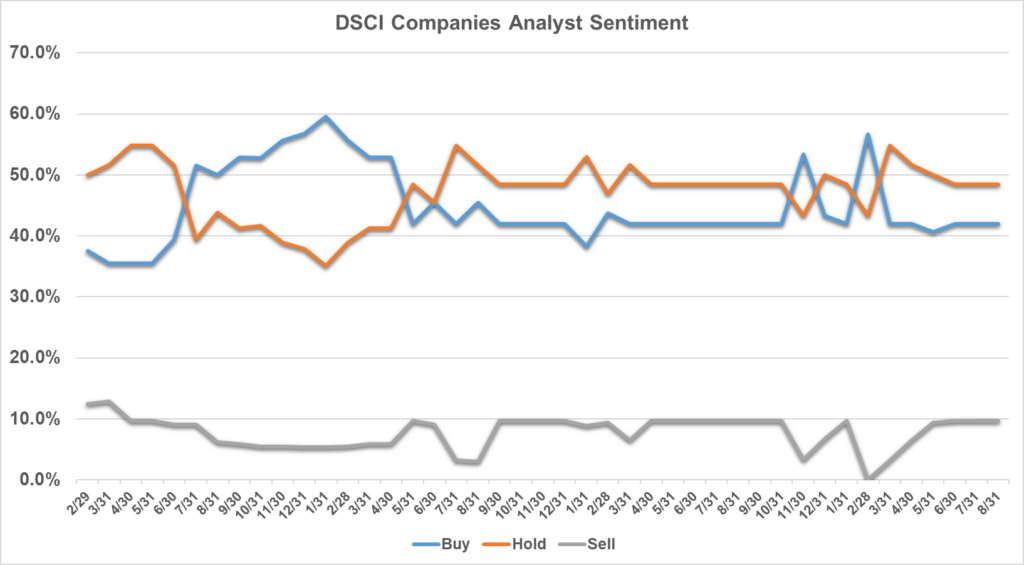
Methodology: The DSCA Analyst Sentiment Index is a consensus tracking tool that aggregates and averages the recommendations of all covering analysts across all public direct selling companies.
-
July 2023
Brought to you by Direct Selling Capital Advisors
Direct Selling Index Jumps 7.6% in July for the Second Successive Month, Significantly Outperforming the Dow Jones Industrials and Adding to its YTD Gain of 27.6%
The Direct Selling Capital Advisors Direct Selling Index (DSCI) handily outperformed the Dow Jones Industrials for a second successive month in July. During the month, the DSCI gained 7.6%, markedly outpacing the Dow which added 3.3%. Over the first seven months of 2023, the return on the direct selling stock index has almost quadrupled that of the Dow, rising 27.6% versus just 7.3% for the index representing 30 of the world’s biggest and most well-known corporations.
Continuing the pattern which prevailed throughout most of the first half of 2023, large cap DSCI components noticeably outperformed their smaller cap peers in July. Nine large caps rose during the month, four by double digit percentage points (and two others by more than 9%), while just one fell. On the other hand, three small cap DSCI members gained, two by more than 10%, while one declined and two were unchanged.
From a longer-term perspective, the DSCI has appreciated an aggregate 45.9% since its March 1, 2020 inception. The DJIA has underperformed the direct selling index over that period. Since March 1, 2020, the DJIA has gained 39.9%.
In July 2023, the stock market not only logged another month of gains, but the market showed impressive breadth for a second consecutive month. The market performance over the last two months represents a welcome change from previous months in 2023 when high market-value issues dominated, and underlying breadth was generally negative.
Economic data was constructive in July as the data releases pointed to the “Goldilocks” combination of resilient growth and declining inflation. The Federal Reserve raised overnight interest rates by 25 basis points near the end of the month, but investors were more focused on this being potentially the final rate hike of this cycle. The consensus economic forecast among both investors and analysts now seems to be that the Fed will manage to execute a “soft landing,” where growth cools to a modest degree and inflation ebbs without triggering a recession.
Looking Forward
Most large cap DSCI components have already reported 2Q 2023 financial results. In most cases, revenue and earnings were down versus the year-ago period, but investors have on the whole placed little weight on these near-term results and are looking forward to (hopefully) a more robust future—when the Fed is no longer raising interest rates.
Investors in the overall stock market have adopted a similar forward-looking stance. Earnings for S&P 500 members are likely to be down on a year-over-year basis when all 2Q 2023 results are tabulated, but investors believe 2Q 2023 could be the trough in this earnings cycle.
The Fed’s next scheduled interest rate-setting meeting is scheduled for September 19-20, so investors will likely not have to contend with any significant changes in rate policy this month. However, in August, bullish investors may have to surmount another difficult obstacle: seasonality. According to Stock Trader’s Almanac, August has been the worst calendar month for the Dow Jones Industrials (and the second worst for the S&P 500) over the past 35 years. Therefore, it is possible that investors could choose to take some profits in August after huge YTD runs in many stocks over the first seven months of 2023.
CHARTS & ANALYSIS
Direct Selling Capital Advisors Index
The DSCI is a market capitalization weighted index of all domestic public direct selling companies with a market capitalization of at least $25 million. The index is rebalanced monthly, and no single issue is permitted to represent more than 20% of its total value. In such an event, the excess weighting would be redistributed among the other index components.
The DSCI gained in July and outperformed the DJIA during the month. The DSCI rose 7.6% in July versus a 3.3% increase in the DJIA. DSCI data is tracked back to March 1, 2020. The direct selling index has risen 45.9% since that date, well outpacing a 39.9% increase for the DJIA.
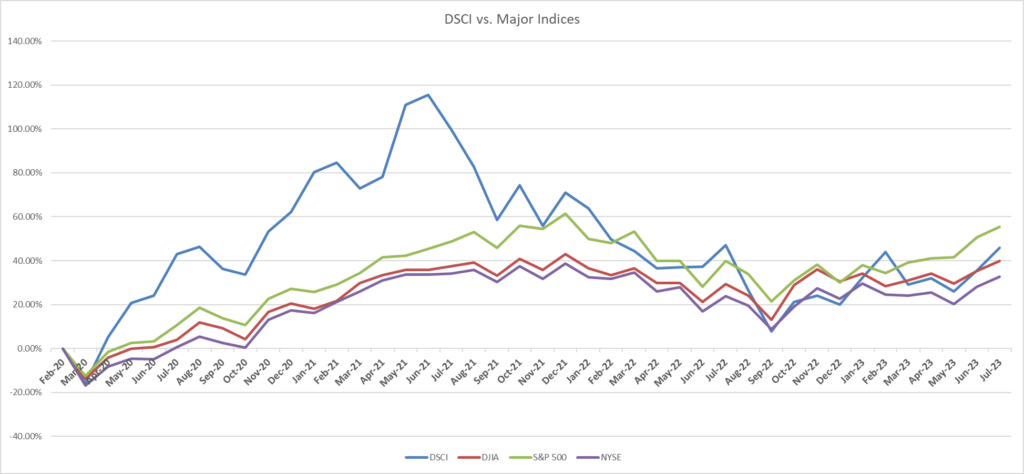
Large Cap
Betterware de Mexico (NASDAQ: BWMX) jumped 9.6% in July, continuing its extremely strong performance this year. Over the first seven months of 2023, BWMX gained 120.7%. Since the DSCI inception on March 1, 2020, BWMX is up 50.4%.
On July 27, BWMX reported consolidated net revenue and EBITDA of 3.22 billion pesos and 717.4 million pesos versus 3.24 billion pesos and 615.3 million pesos, respectively in the year-ago period. The company grew the number of its distributors by 5% in 2Q 2023 compared with 1Q 2023 and achieved a 4.0% sales increase in the period relative to 1Q 2023. Equally important, BWMX’s margins throughout 1H 2023 returned to early 2022 levels.
In its 2Q 2023 earnings release, BWMX reiterated full-year 2023 net revenue and EBITDA guidance ranges of 13.2-14.2 billion pesos and 2.6-2.8 billion pesos, respectively. The midpoints of each range imply about 20% improvements from 2022 figures.
BWMX began trading in March 2020 after the company’s merger with SPAC sponsor DD3 Acquisition Corp. BWMX specifically targets the Mexican market; it serves three million households through distributors and associates in approximately 800 communities throughout Mexico.
Nu Skin Enterprises, Inc. (NYSE: NUS) dropped 11.5% in July, making it the worst performing DSCI component during the month. The July decline added to NUS’ YTD loss of 30.3%, the worst among all large cap direct selling stock index members. More constructively, since the March 2020 establishment of the DSCI, NUS has gained 24.6%, but that still represents long-term underperformance versus both the direct selling stock index (+45.9%) and the Dow Jones Industrial Average (+39.9%).
On August 1, NUS reported 2Q 2023 revenue and adjusted EPS of $500.3 million and $0.54, both down from $560.6 million and $0.77, respectively, in 2Q 2022. Macroeconomic issues and associated prices had a dampening effect on consumer spending and customer acquisition. These factors, coupled with a stronger-than-expected U.S. dollar and the effects of recent acquisitions, caused NUS to reduce its full-year 2023 revenue and adjusted EPS guidance ranges to $2.00-$2.08 billion and $2.30-$2.60 from $2.03-$2.18 billion and $2.35-$2.75, respectively.
Herbalife Nutrition, Inc. (NYSE: HLF) leapt 22.7% in July, representing a second consecutive month of double-digit percentage gains (+11.8% in June). July’s performance caused HLF’s YTD performance to flip to positive 9.1% from a negative YTD figure (minus 11.0%) as of June 30, 2023. Still, HLF has lost 49.8% since the March 2020 establishment of the DSCI, making it the worst performing DSCI large cap stock which has traded continuously since index inception.
On August 2, HLF reported 2Q 2023 net sales of $1.31 billion, down 5.7% from $1.39 billion in 2Q 2022. The company’s adjusted diluted EPS also declined, falling to $0.74 in 2Q 2023 versus $0.96 in the year-ago period. Despite the lower revenue in the quarter, HLF said 2Q 2023 marked its second consecutive quarter of improved year-over-year sales trends. Indeed, the company believes it will return to growth in 4Q 2023.
HLF has implemented a Transformation Program which is now expected to deliver more than $90 million in annual savings, up from the company’s prior $70 million estimate. About $45 million of these savings will be realized in 2023.
Medifast, Inc. (NYSE: MED) shares jumped 10.6% in July, marking its second consecutive double-digit percentage monthly gain (+17.1% in June). Nevertheless, MED has lost 11.5% year to date. Since the March 1, 2020 establishment of the DSCI, MED shares have gained 28.2%. MED’s annual dividend rate is $6.60 per share, making its dividend yield a very attractive 6.7%.
In May, MED announced 1Q 2023 revenue of $349.0 million, down 16.4% from $417.6 million in 1Q 2022. Conversely, the company’s diluted EPS in 1Q 2023 was $3.69, up from $3.59 in the year-ago period. MED offset the revenue decline in 1Q 2023 through dramatic cuts in SG&A expenses in the quarter.
For the second quarter of 2023, MED expects to report revenue and diluted EPS of $250 million to $270 million and $1.32 to $1.44, respectively. MED will announce 2Q 2023 results on August 7.
USANA Health Sciences, Inc. (NYSE: USNA) rose 3.0% in July for its sixth monthly gain in the first seven months of 2023. Year to date, USNA has appreciated 22.0%. Since the March 2020 inception of the DSCI, USANA shares have lost 1.8% compared with 45.9% and 39.9% increases for the direct selling index and the DJIA, respectively.
On July 25, USANA reported 2Q 2023 revenue and diluted EPS of $238 million and $0.89, both down from $264 million and $1.00, respectively, in 2Q 2022. USANA’s 1Q 2023 results, which were modestly ahead of the company’s internal expectations, were boosted by sequential improvement in mainland China, due in part to a local promotion offered there, and continued progress on several key strategic initiatives.
The company raised the lower end of its net sales and diluted EPS outlook for full-year 2023 to $900-950 million and $2.65-$3.30 from $875-$950 million and $2.40-$3.30, respectively.
eXp World Holdings, Inc. (NASDAQ: EXPI), the DSCI’s second largest component and by far its best performer since its March 2020 establishment, posted its third consecutive stellar performance in July. The stock rose 23.0% last month after posting 31.8% and 31.7% gains in June and May, respectively. Fueled by these moves, EXPI shares have jumped 125.1% over the first seven months of 2023. Furthermore, EXPI shares have gained an astonishing 421.8% over the 41 months that the DSCI has been computed.
On August 3, EXPI, the fastest growing real estate brokerage in the world, reported 2Q 2023 revenue and adjusted EBITDA of $1.23 billion and $24.7 million, both down from $1.42 billion and $26.9 million, respectively, in 2Q 2022. Transaction volume was lower in 2Q 2023, as persistently high mortgage rates kept many buyers sidelined. More specifically, EXPI’s real estate transaction volume was $48.6 billion in 2Q 2023, 16% slower than in 2Q 2022. The number of agents on EXPI’s realty platform reached 88,248 on June 30, 2023, up about 1% from 87,327 as of March 31, 2023.
A leading provider of financial services in the U.S. and Canada, and the largest market cap stock in the DSCI, Primerica, Inc. (NYSE: PRI) added 7.6% in July, lifting its YTD gain to a very impressive 50.0%. Since the March 2020 establishment of the DSCI, PRI has gained 94.1%. Both these YTD and 41-month gains markedly surpass the respective 27.6% and 45.9% gains in the direct selling index.
In May, PRI reported 1Q 2023 adjusted operating revenue of $695.0 million, up slightly from $692.6 million in the year-ago period. Furthermore, adjusted diluted EPS in 1Q 2023 reached $3.49, an 18% jump from $2.96 in 1Q 2022. The robust results reflected the continued growth of adjusted premiums in PRI’s Term Life unit, the benefit of higher interest rates on net investment income in the Corporate and Other Distributed Products segment and improving profitability in PRI’s Senior Health division. PRI plans to report its 2Q 2023 results on August 7.
Nature’s Sunshine Products, Inc. (NASDAQ: NATR) increased 2.2% in July, bringing its YTD gain to 67.7%, the third best mark of any large cap DSCI component. Since the establishment of the DSCI on March 1, 2020, NATR, which markets and distributes nutritional and personal care products in more than 40 countries, has gained 79.6%, handily outperforming both the direct selling index and the Dow Jones Industrials Average.
In May, NATR reported 1Q 2023 net sales of $108.6 million versus $110.5 million in the year-ago period. NATR’s adjusted EPS in 1Q 2023 was $0.23, a significant improvement over its 1Q 2022 adjusted loss of $0.03 per share. NATR plans to announce its 2Q 2023 results on August 9.
The Beachbody Company, Inc. (NYSE: BODY), a leading subscription health and wellness company, rose 9.6% in July. Nevertheless, the stock has declined 12.5% over the first seven months of 2023, the second worst performance of all large cap DSCI components.
In May, BODY reported 1Q 2023 revenue of $144.9 million versus $198.9 million in the prior-year period. More constructively, BODY’s adjusted EBITDA showed dramatic improvement: a $0.9 million loss in 1Q 2023 compared with a $19.1 million shortfall in 1Q 2022. During 1Q 2023, BODY successfully completed the transition to its expanded BODi platform.
BODY plans to report its 2Q 2023 earnings on August 8. When the company announced its first quarter results, BODY projected 2Q 2023 revenue and adjusted EBITDA of $125-$140 million and a loss of $5 million to $10 million, respectively.
Tupperware Brands Corporation (NYSE: TUP) completed an extraordinary month in July. The stock rocketed 433.8% higher during the month as investors began to trade TUP as a meme stock. The enormous July gain fully reversed substantial losses during the first six months of 2023; through the first seven months of the year, TUP has now gained 3.1%. Since the March 2020 DSCI inception, TUP shares have appreciated 49.8%.
On August 3, TUP finalized an agreement with its lenders to restructure its existing debt obligations, improving the company’s overall financial position by amending some credit obligations and extending the maturity of some debt facilities. In particular, the accord entailed the reduction/reallocation of approximately $150 million of cash interest and fees.
To date, TUP has still not filed its 10-K annual report for 2022, and it is not clear when it will be able to do so.
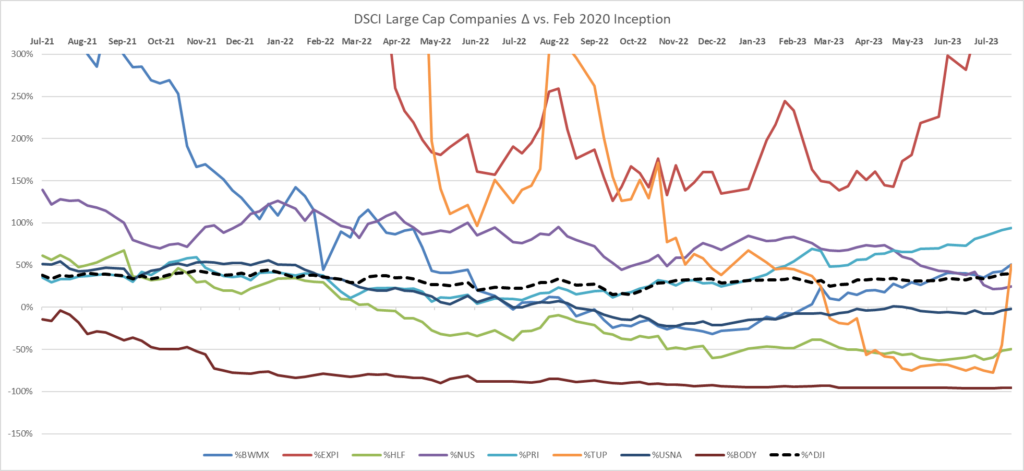
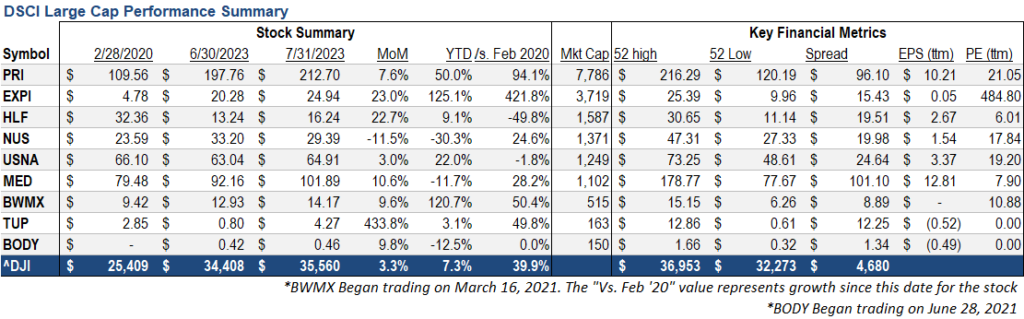
Note: For the purposes of this report, Direct Selling Capital considers companies with a market capitalization in excess of $1 billion “Large Cap.”
Small Cap
Our small cap tracking set generally rose in July, though not as sharply as their large cap peers during the month. Three small caps rose in July, one declined, and two were unchanged.
Education Development Corporation (NASDAQ: EDUC) led all small caps members in July, soaring 49.6%. Nonetheless, the stock has declined 43.7% over the first seven months of 2023. EDUC, a publishing company specializing in books for children, reported $14.5 million of revenue and a $1.2 million pretax loss in the quarter ended May 31, 2023, compared with $23.2 million and a $0.3 million pretax gain, respectively, in the year-ago period.
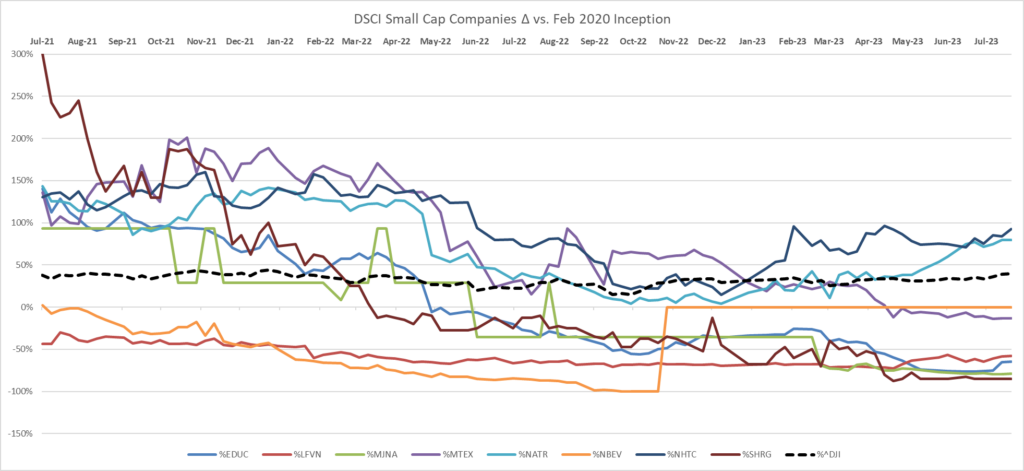
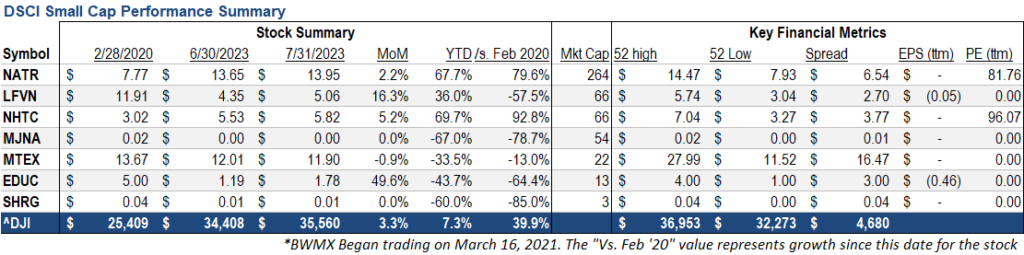
Short Interest Data & Analysis
The following chart is an aggregate index of “days to cover” among the entire tracking set. Days to cover (DTC) is a measurement determined by dividing the total outstanding short interest by average daily trading volume.
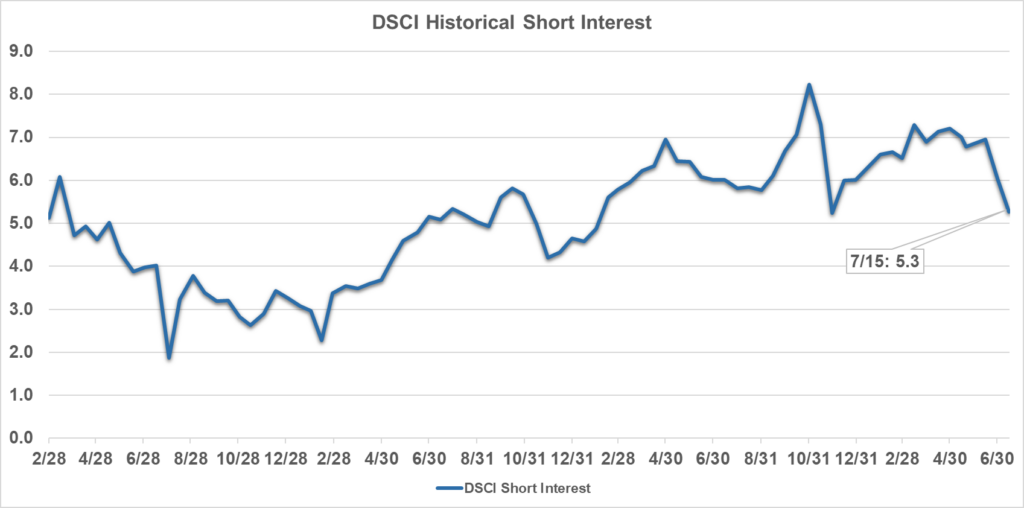
As indicated in the chart above, short interest in DSCI stocks was 5.3 days in mid-July, down noticeably from 6.0 days at the end of June, and 7.0 days as of mid-June. The mid-July 5.3 DTC figure is the lowest reading for the direct selling index since a 4.6-days data point in mid-January 2023. The biggest absolute decrease in DTC from the end of June to mid-July for a DSCI component was EXPI’s fall to 12.9 days from 14.1 days.
Short interest can be a difficult indicator to analyze. On the one hand, an increase in short interest can be a bearish sign in that it indicates an
increased view among investors that a stock is likely to decline based on any number of factors, such as a belief that the company’s fundamentals are deteriorating or that it has run too far, too fast. On the other hand, as a stock moves higher, a significant short interest can serve as extra fuel on the fire as investors scramble to “buy to cover” their short positions and mitigate losses.
Analyst Sentiment Index
Our Analyst Sentiment Index was unchanged in July versus June. During both months, the proportion of sell-side analysts maintaining “buy” and “hold” ratings on industry stocks was about 90%. Conversely, the percentage of stocks which analysts recommend selling in July and June was approximately 10%.

Methodology: The DSCA Analyst Sentiment Index is a consensus tracking tool that aggregates and averages the recommendations of all covering analysts across all public direct selling companies.
-
June 2023
Brought to you by Direct Selling Capital Advisors
Direct Selling Index Jumps 7.6% in June, Bringing First Half 2023 Gain to 18.7%
In June, the Direct Selling Capital Advisors Direct Selling Index (DSCI) soared 7.6% to bring its first half 2023 gain to 18.7%. The DSCI handily outperformed the Dow Jones Industrials both in June and over the first six months of the year. The Dow gained 4.6% last month and 3.8% in 1H 2023.
As they did for most of the first half of 2023, large cap DSCI components markedly outperformed their smaller cap peers in June. Seven large caps rose during the month, four by double digit percentage points, while just two fell. On the other hand, only one small cap DSCI component gained and six declined, three by more than 10%.
From a longer-term perspective, the DSCI has appreciated an aggregate 35.7% since its March 1, 2020 inception. The DJIA has slightly underperformed the direct selling index over that period. Since March 1, 2020, the DJIA has gained 35.4%.
In June 2023, the stock market not only gained substantial ground but displayed impressive breadth in doing so. For example, 454 of the 500 members of the S&P 500 Index gained during the month; moreover, 155 S&P 500 components rose by at least 10% last month. In addition, all eleven industry sectors increased during June. June’s performance represented a marked—and welcome—change from previous months in 2023 when high market-value issues dominated, and underlying breadth was generally negative. Reflecting the improved tone of the stock market, the IPO market sprung back to life in June. Several issues soared above their IPO prices.
Interestingly, in June investors seemed not to focus on the Federal Reserve’s forecast that it may implement two additional 25 basis point rate increases before year-end 2023. (The Fed opted not to raise interest rates at its schedule meeting in June for the first time in fifteen months.) Instead, market participants were encouraged by solid economic data reported during the month: 0.4% and 0.7% gains in core retail sales and core durable goods orders, respectively, in May, as well as improved home sales and housing starts figures.
Looking Forward
Direct selling stocks will begin announcing 2Q 2023 results in late July, and the levels of revenue and earnings in these reports will be closely watched. Perhaps equally important will be the revenue and earnings guidance ranges put forth by many management teams. Especially interesting may be managements’ expectations for sales in China, as the much-anticipated economic revival there after the lifting of strict government-imposed COVID restraints, seems to have stalled.
These comments are also applicable to the overall stock market. Overall earnings reports were generally stronger than expected in 1Q 2023, and a repeat of such a performance would likely provide a tailwind for stocks in July and August. According to IBES data from Refinitiv, analysts expect earnings for S&P 500 companies to decline about 5% in 2Q 2023 versus the year-ago period.
Finally, the Fed holds its next scheduled interest rate setting meeting on July 26. The Fed’s action on that date, together with the commentary it releases that discusses future interest rate policy, could have a major impact on both direct selling stocks and the stock market in general.
CHARTS & ANALYSIS
Direct Selling Capital Advisors Index
The DSCI is a market capitalization weighted index of all domestic public direct selling companies with a market capitalization of at least $25 million. The index is rebalanced monthly, and no single issue is permitted to represent more than 20% of its total value. In such an event, the excess weighting would be redistributed among the other index components.
The DSCI gained in June and outperformed the DJIA during the month. The DSCI rose 7.6% in June versus a 4.6% increase in the DJIA. DSCI data is tracked back to March 1, 2020. The direct selling index has risen 35.7% since that date, narrowly outpacing a 35.4% increase for the DJIA.
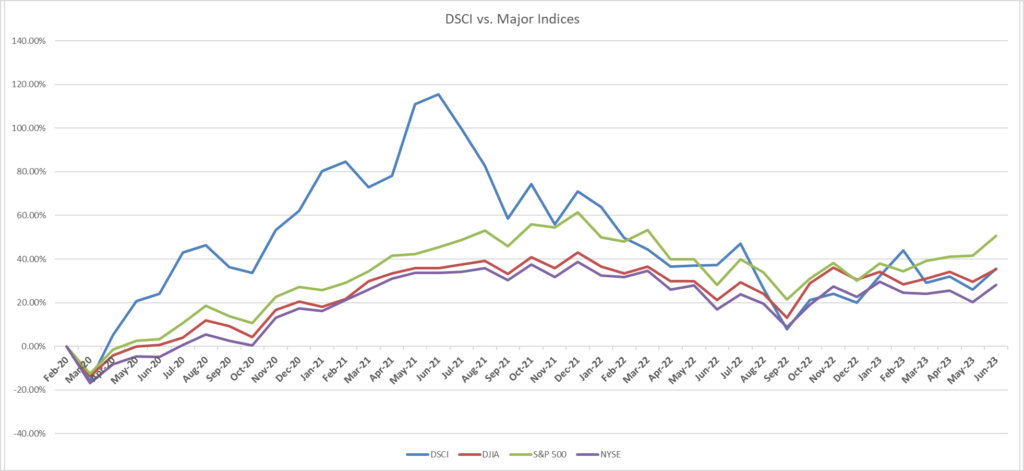
Large Cap
Betterware de Mexico (NASDAQ: BWMX) gained 6.9% in June, reversing a loss of roughly similar size in May. BWMX’s June increase culminated an extraordinary performance in the first half of 2023, a period over which the shares appreciated 101.4%. Since DSCI inception on March 1, 2020, BWMX is up 37.3%.
Largely due to the inclusion of Jafra Mexico and Jafra USA’s results, Betterware’s 1Q 2023 net revenue totaled 3.27 billion pesos, up 75% from 1.87 billion pesos in the year-ago period. Consolidated EBITDA also rose in the just-completed quarter, reaching 659.0 million pesos, 20.3% higher than the 547.8 million pesos recorded in 1Q 2022.
BWMX began trading in March 2020 after the company’s merger with SPAC sponsor DD3 Acquisition Corp. BWMX specifically targets the Mexican market; it serves three million households through distributors and associates in approximately 800 communities throughout Mexico.
Nu Skin Enterprises, Inc. (NYSE: NUS) inched 0.4% lower in June. Despite this modest decline, NUS stock was the second worst performing large cap DSCI component in June for the second successive month. The modest pullback added to NUS’s YTD decline of 21.3%. More constructively, since the March 2020 establishment of the DSCI, NUS has gained 40.7%, outperforming both the direct selling stock index (+35.7%) and the Dow Jones Industrial Average (+35.4%).
NUS reported 1Q 2023 revenue and adjusted EPS of $481.5 million and $0.37, down from $604.9 million and $0.76, respectively, in the year-ago period. The results reflected better-than-expected performances in South Korea and Mainland China, while the Americas and other parts of Southeast Asia continued to be affected by inflation and recession concerns. NUS reiterated its 2023 financial guidance: revenue should range from $2.03 billion to $2.18 billion and adjusted EPS is expected to be $2.35 to $2.75.
Herbalife Nutrition, Inc. (NYSE: HLF) rose 11.8% in June, bouncing back from a sharp 20.3% decline in May. Over the first half of 2023, HLF was down 11.0%. Since the March 2020 establishment of the DSCI, HLF has lost 59.1%, making it the worst performing DSCI large cap stock which has traded continuously since index inception.
In May, HLF reported 1Q 2023 net sales of $1.25 billion, down 6.3% from $1.34 billion in 1Q 2022. The company’s adjusted diluted EPS also declined, falling to $0.54 in 1Q 2023 versus $0.99 in the year-ago period. Earnings declined because of lower sales (despite generally improved product unit pricing), continued input cost inflation and the timing of distributor event spending. HLF has implemented a Transformation Program which is expected to deliver more than $70 million in annual savings, about half of which should be realized in 2023.
Medifast, Inc. (NYSE: MED) shares likewise rebounded strongly in June. The stock surged 17.1% during the month after falling by double digit percentage points in both April and May. Nevertheless, year to date, MED has lost 20.1%. Since the March 1, 2020 establishment of the DSCI, MED shares have gained 16.0%. MED’s annual dividend rate is $6.60 per share, making its dividend yield a very attractive 7.1%.
In May, MED announced 1Q 2023 revenue of $349.0 million, down 16.4% from $417.6 million in 1Q 2022. Conversely, the company’s diluted EPS in 1Q 2023 was $3.69, up from $3.59 in the year-ago period. MED offset the revenue decline in 1Q 2023 through dramatic cuts in SG&A expenses in the quarter.
For the second quarter of 2023, MED expects to report revenue and diluted EPS of $250 million to $270 million and $1.32 to $1.44, respectively.
USANA Health Sciences, Inc. (NYSE: USNA) rose 3.9% in June. Over the first half of 2023, USNA posted monthly gains in five of the six months. May’s 8.6% decline represented the only down month. Year to date, USNA has appreciated 18.5%. Since the March 2020 inception of the DSCI, USNA shares have lost 4.6% compared with 35.7% and 35.4% increases for the direct selling index and the DJIA, respectively.
USNA reported 1Q 2023 revenue and diluted EPS of $248 million and $0.95, both down from $273 million and $1.15, respectively, in 1Q 2022. USNA’s 1Q 2023 performance was boosted in the first few weeks of the quarter by increased demand for several of the company’s health products in China following the government’s shift in COVID policy. The company expects full-year 2023 sales and diluted EPS to be in the ranges of $875 million to $950 million and $2.40 to $3.30, respectively.
eXp World Holdings, Inc. (NASDAQ: EXPI), the DSCI’s second largest component and by far its best performer since its March 2020 establishment, has posted extraordinary (and almost identical percentage) gains in two consecutive months. EXPI leaped 31.8% last month after rising 31.7% in May. Over the first half of 2023, EXPI increased 83.0%. EXPI shares have gained a remarkable 324.3% over the 40 months the DSCI has been computed.
EXPI, the fastest growing real estate brokerage in the world, reported 1Q 2023 revenue and adjusted EBITDA of $850.6 million and $13.3 million, down from $1.01 billion and $17.7 million, respectively, in 1Q 2022. EXPI’s variable cost business model limited the declines in both measures from the global residential real estate market downturn.
EXPI’s real estate transaction volume was $33.2 billion in 1Q 2023, 20% slower than in 1Q 2022. The number of agents on EXPI’s realty platform reached 87,327 as of March 31, 2023, up 12% from March 31, 2022.
A leading provider of financial services in the U.S. and Canada, and the largest market cap stock in the DSCI, Primerica, Inc. (NYSE: PRI) jumped 8.6% in June, lifting its YTD gain to 39.4%. Since the March 2020 establishment of the DSCI, PRI has increased 80.5%. Both these YTD and 40-month gains markedly surpass the respective 18.7% and 35.7% gains in the direct selling index.
In May, PRI reported 1Q 2023 adjusted operating revenue of $695.0 million, up slightly from $692.6 million in the year-ago period. Furthermore, adjusted diluted EPS in 1Q 2023 reached $3.49, an 18% jump from $2.96 in 1Q 2022. The robust results reflect the continued growth of adjusted premiums in PRI’s Term Life unit, the benefit of higher interest rates on net investment income in the Corporate and Other Distributed Products segment and improving profitability in PRI’s Senior Health division.
Nature’s Sunshine Products, Inc. (NASDAQ: NATR) posted a 22.1% gain in June, making it the second best performing large cap DSCI component during the month. In 1H 2023, NATR appreciated 64.1%, the third best mark among this group. Since the establishment of the DSCI on March 1, 2020, NATR, which markets and distributes nutritional and personal care products in more than 40 countries, has increased 75.8%, handily outperforming both the direct selling index and the Dow Jones Industrials Average.
In May, NATR reported 1Q 2023 net sales of $108.6 million versus $110.5 million in the year-ago period. NATR’s adjusted EPS in 1Q 2023 was $0.23, a significant improvement over its 1Q 2022 adjusted loss of $0.03 per share. Key Japan and Taiwan markets showed double digit percentage revenue growth in 1Q 2023.
The Beachbody Company, Inc. (NYSE: BODY), a leading subscription health and wellness company, lagged all DSCI large components in June, declining 13.8%. Over the first six months of 2023, BODY declined 20.3%.
In May, BODY reported 1Q 2023 revenue of $144.9 million versus $198.9 million in the prior-year period. More constructively, BODY’s adjusted EBITDA showed dramatic improvement: a $0.9 million loss in 1Q 2023 compared with a $19.1 million shortfall in 1Q 2022. During 1Q 2023, BODY successfully completed the transition to its expanded BODi platform. BODY projects 2Q 2023 revenue and adjusted EBITDA of $125 million to $140 million and a loss of $5 million to $10 million, respectively.
On June 15, BODY appointed turnaround expert Mark Goldston to the newly formed role of Executive Chairman of the company’s Board of Directors. Together with BODY’s co-founder and CEO Carl Daikeler, Mr. Goldston will guide the company’s transformation.
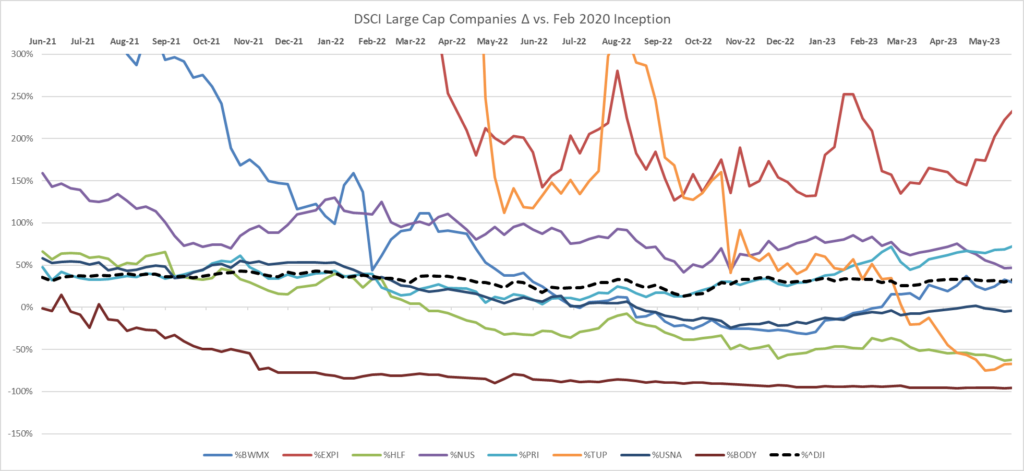
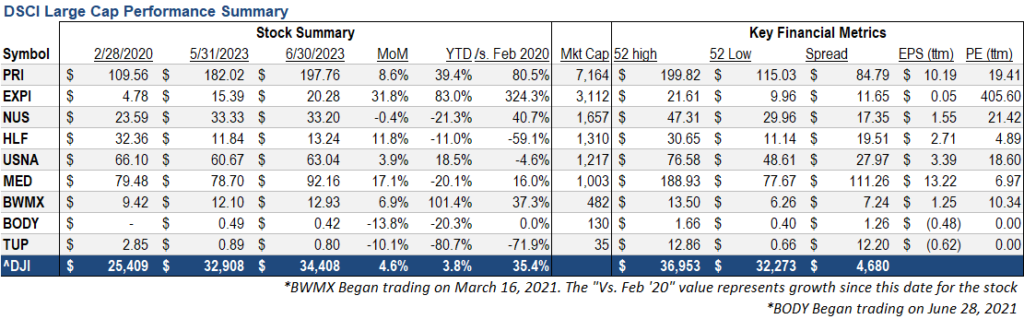
Note: For the purposes of this report, Direct Selling Capital considers companies with a market capitalization in excess of $1 billion “Large Cap.”
Small Cap
Our small cap tracking set markedly underperformed their large cap peers in June. Only one of the seven smaller direct selling stocks rose during the month, while six declined, three by double digit percentage points.
Natural Health Trends Corp. (NASDAQ: NHTC) was the only small cap DSCI member which gained in June. It inched 0.5% higher during the month: year to date, it has gained 61.2%. NHTC, a marketer of premium quality personal care, wellness and “quality of life” products, reported 1Q 2023 revenue and diluted EPS of $11.9 million and positive $0.02 versus $11.5 million and a loss of $0.01, respectively, in the year-ago period.
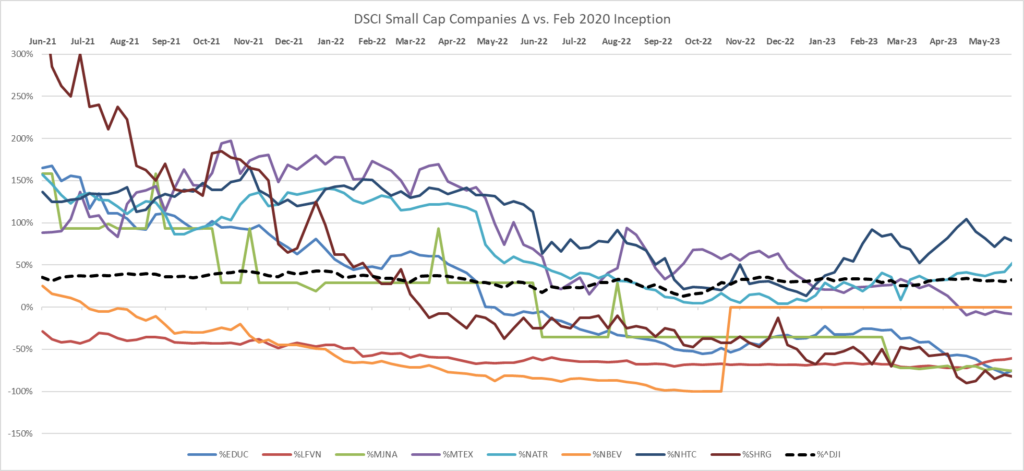
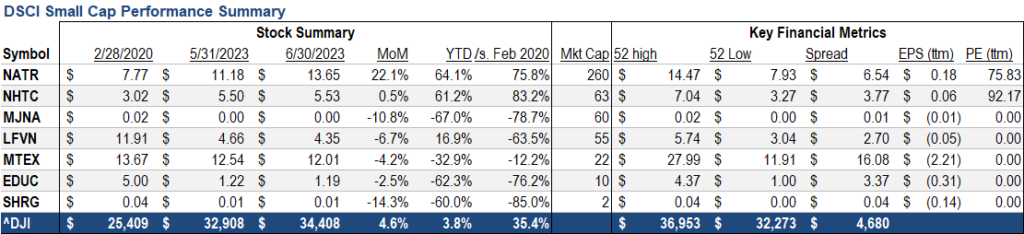
Short Interest Data & Analysis
The following chart is an aggregate index of “days to cover” among the entire tracking set. Days to cover (DTC) is a measurement determined by dividing the total outstanding short interest by average daily trading volume.
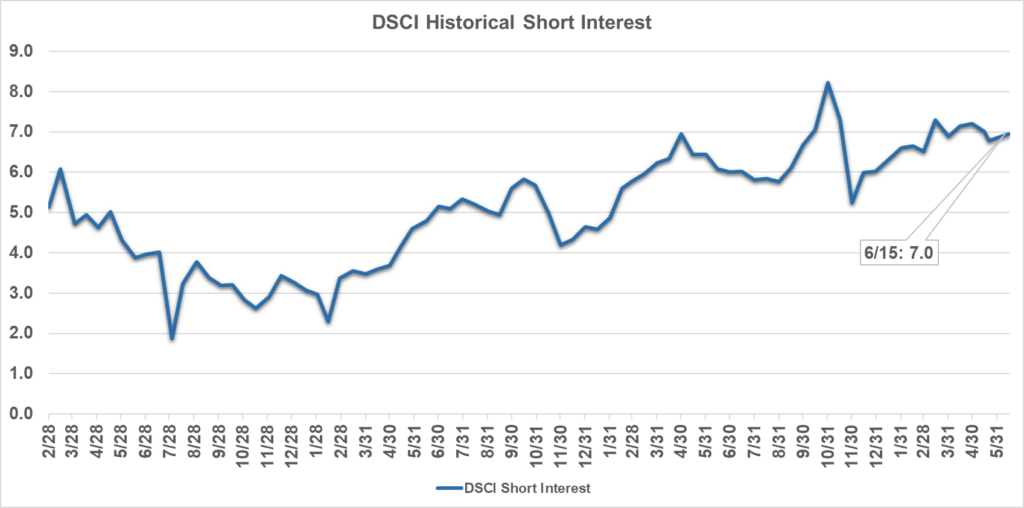
As indicated in the chart above, short interest in DSCI stocks was 7.0 days in mid-June, up slightly from 6.8 days at the end of May and unchanged from 7.0 days as of mid-May. The 7.0 DTC figure as of mid-June is up dramatically from 4.6 days in mid-January 2023. Aggregate DSCI “days-to-cover” have approximately tripled since bottoming in mid-February 2021. The biggest absolute increase in DTC from the end of May to mid-June for a DSCI component was small cap Mannatech, Incorporated’s (NASDAQ: MTEX) jump to 1.3 days from 0.5 days.
Short interest can be a difficult indicator to analyze. On the one hand, an increase in short interest can be a bearish sign in that it indicates an increased view among investors that a stock is likely to decline based on any number of factors, such as a belief that the company’s fundamentals are deteriorating or that it has run too far, too fast. On the other hand, as a stock moves higher, a significant short interest can serve as extra fuel on the fire as investors scramble to “buy to cover” their short positions and mitigate losses.
Analyst Sentiment Index
Our Analyst Sentiment Index declined slightly in June versus May. During June, the proportion of sell-side analysts maintaining “buy” and “hold” ratings on industry stocks fell slightly to 90% from 91% in May. Conversely, the percentage of stocks which analysts recommend selling in June was approximately 10% compared with 9% in May.
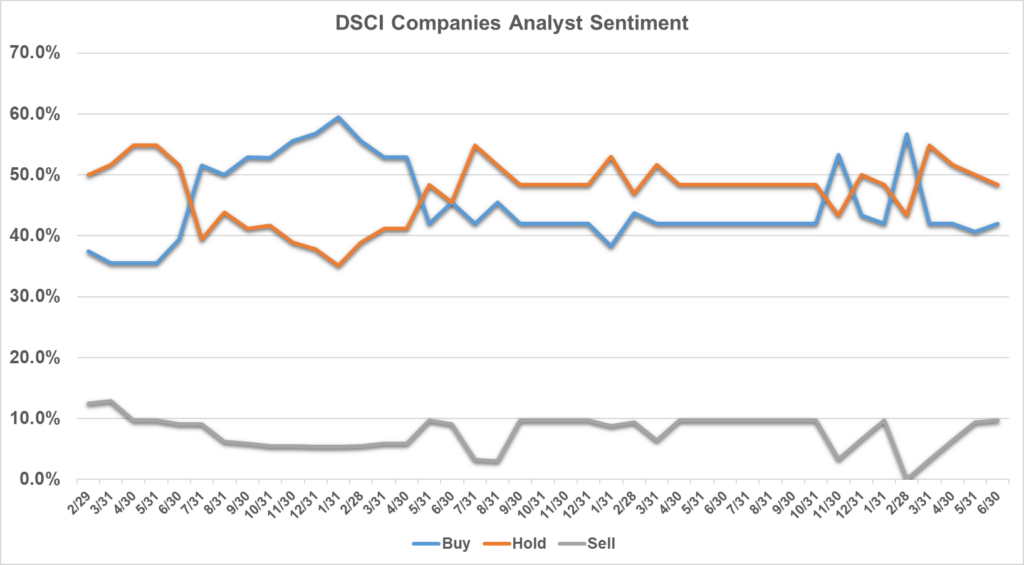
Methodology: The DSCA Analyst Sentiment Index is a consensus tracking tool that aggregates and averages the recommendations of all covering analysts across all public direct selling companies.
-
May 2023
Brought to you by Direct Selling Capital Advisors
Direct Selling Index Declines 4.5% in May, Moderately Underperforms DJIA During the Month
In May, the Direct Selling Capital Advisors Direct Selling Index (DSCI) fell 4.5%, breaking a three-month winning streak. The index underperformed the Dow Jones Industrials, as the Dow declined 3.5% during the month.
Interrupting a pattern which has prevailed over most of the last year, large cap DSCI members generally underperformed their smaller cap peers in May. Three large caps rose during the month, one by double digit percentage points, while six fell, three by 10% or more. On the other hand, three of the seven small cap DSCI members rose and four declined. The small caps were quite volatile in May; six of the seven small cap stocks experienced double digit percentage changes during the month.
From a longer-term perspective, the DSCI has appreciated an aggregate 26.1% since its March 1, 2020 inception. The DJIA has slightly outpaced the DSCI’s performance over the last 3 ¼ years. Since March 1, 2020, the DJIA has gained 29.6%.
In May, the stock market traded within a fairly tight trading range that has prevailed over the last two months. In addition, overall index volatility continued to be unusually low. These stable market characteristics appear to trace to a modestly better-than-expected earnings reporting season in 1Q 2023. Indeed, earnings rose 4.8% in the quarter compared with 4Q 2022 results, although they came in about 1% below 1Q 2023 estimates which prevailed at the start of 1Q 2023, according to S&P Dow Jones.
Interestingly, this quiescent broad market performance belies three key market developments in the month. First, investors generally ignored the U.S. debt ceiling soap opera which was ultimately positively resolved. Both the House and Senate approved compromise legislation and President Biden signed the bill into law on June 3rd. Second, stock market participants seemed to gain increasing conviction as May progressed that the U.S. would not experience a sharp economic slowdown; instead, a “soft” landing appears to be the consensus opinion. Finally, many investors have decided to embrace and place high valuations on artificial intelligence-related stocks. NVIDIA Corporation’s (NASDAQ: NVDA) sterling earnings report on May 24 bolstered these bullish views.
Looking Forward
Movements in direct selling stocks in June are likely to track the path of the overall stock market, as the DSCI components have already reported 1Q 2023 earnings, and second quarter results will not begin to be issued until late July. If so, investors will scrutinize the Federal Reserve’s actions at its upcoming June 13-14 meeting—both whether the central bank keeps overnight rates flat after ten consecutive increases beginning in March 2022 and the language contained in the accompanying statement.
Investors were encouraged by the details of the nation’s jobs report issued on June 2. Not only were employment gains strong —339,000 jobs were added—but average hourly earnings rose at a slower pace than expected and the 3.7% unemployment rate was higher than anticipated. Taken together, these data points could allow the Fed to pause its 14-month campaign of rate hikes.
CHARTS & ANALYSIS
Direct Selling Capital Advisors Index
The DSCI is a market capitalization weighted index of all domestic public direct selling companies with a market capitalization of at least $25 million. The index is rebalanced monthly, and no single issue is permitted to represent more than 20% of its total value. In such an event, the excess weighting would be redistributed among the other index components.
The DSCI declined in May and underperformed the DJIA during the month. The DSCI fell 4.5% in May versus a 3.5% drop in the DJIA. DSCI data is tracked back to March 1, 2020. The direct selling index has risen 26.1% since that date compared with a 29.6% increase for the DJIA. At its peak in June 2021, the DSCI had risen 115.6% since inception.
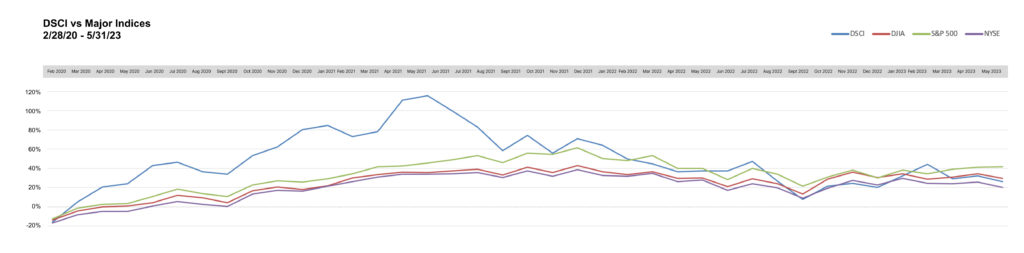
Large Cap
Betterware de Mexico (NASDAQ: BWMX) fell 6.3% in May, partially reversing strong gains in March and April when it was the best performing large cap DSCI component in each month. Nevertheless, BWMX is the leading gainer among all large-cap DSCI stocks YTD in 2023, a five-month stretch during which the stock has gained 88.5%. Since DSCI inception, BWMX is up 28.5%.
Largely due to the inclusion of Jafra Mexico and Jafra USA’s results, Betterware’s 1Q 2023 net revenue totaled 3.27 billion pesos, up 75% from 1.87 billion pesos in the year-ago period. Consolidated EBITDA also rose in the just-completed quarter reaching 659.0 million pesos, 20.3% higher than the 547.8 million pesos recorded in 1Q 2022.
BWMX began trading in March 2020 after the company’s merger with SPAC sponsor DD3 Acquisition Corp. BWMX specifically targets the Mexican market; it serves three million households through distributors and associates in approximately 800 communities throughout Mexico.
Nu Skin Enterprises, Inc. (NYSE: NUS) dropped 15.5% in May, making the stock the second worst performing large cap DSCI component during the month. The decline added to NUS’s YTD decline of 20.9%. More constructively, since the March 2020 establishment of the DSCI, NUS has gained 41.3%, outperforming both the direct selling stock index (+26.1%) and the Dow Jones Industrial Average (+29.5%).
In early May, NUS reported 1Q 2023 revenue and adjusted EPS of $481.5 million and $0.37, down from $604.9 million and $0.76, respectively, in the year-ago period. The results were in line with the company’s expectations, reflecting better-than-expected performances in South Korea and Mainland China, while the Americas and other parts of Southeast Asia continued to be affected by inflation and recession concerns. NUS reiterated its 2023 financial guidance: revenue should range from $2.03 billion to $2.18 billion and adjusted EPS is expected to be $2.35 to $2.75.
Herbalife Nutrition, Inc. (NYSE: HLF) was the biggest decliner among DSCI large cap stocks in May after it fell 20.3% during the month. Year to date, HLF is down 20.4%. Since the March 2020 establishment of the DSCI, HLF has lost 63.4%, making it the worst performing DSCI large cap stock which has traded continuously since index inception.
In early May , HLF reported 1Q 2023 net sales of $1.25 billion, down 6.3% from $1.34 billion in 1Q 2022. The company’s adjusted diluted EPS also declined, falling to $0.54 in 1Q 2023 versus $0.99 in the year-ago period. Earnings declined because of lower sales (despite generally improved product unit pricing), continued input cost inflation, and timing of distributor event spending.
HLF has implemented a Transformation Program which is expected to deliver more than $70 million in annual savings, about half of which should be realized in 2023. Nevertheless, given the shifting macroeconomic backdrop and rapid sentiment changes, HLF is not providing 2023 revenue or EPS guidance.
Medifast, Inc. (NYSE: MED) declined 14.1% in May, its second successive double digit percentage monthly loss (-11.6% in April). Year to date, MED has lost 31.8%, the most among DSCI large cap members. Since the March 1, 2020 establishment of the DSCI, MED shares have inched 1.0% lower. MED’s annual dividend rate is $6.60 per share, making its dividend yield a very attractive 7.9%.
In early May, MED announced 1Q 2023 revenue of $349.0 million, down 16.4% from $417.6 million in 1Q 2022. Nevertheless, the company’s diluted EPS in 1Q 2023 was $3.69, up from $3.59 in the year-ago period. MED offset the revenue decline in 1Q 2023 through dramatic cuts in SG&A expenses in the quarter. MED’s 1Q 2023 revenue and diluted EPS each markedly exceeded the top ends of management’s guidance ranges of $300 million to $320 million and $1.75 to $2.40, respectively.
For the second quarter of 2023, MED expects to report revenue and diluted EPS of $250 million to $270 million and $1.32 to $1.44, respectively.
USANA Health Sciences, Inc. (NYSE: USNA) fell 8.6% in May, breaking a streak of four successive months of gains. USNA’s May performance trimmed the stock’s YTD increase to 14.0%. Since the March 2020 inception of the DSCI, USANA shares have lost 8.2% compared with 26.1% and 29.5% increases for the direct selling index and the DJIA, respectively.
In late April, USANA reported 1Q 2023 revenue and diluted EPS of $248 million and $0.95, both down from $273 million and $1.15, respectively, in 1Q 2022. USANA’s 1Q 2023 performance was boosted in the first few weeks of the quarter by increased demand for several of the company’s health products in China following the government’s shift in COVID policy. The company expects 2023 sales and diluted EPS to be in the ranges of $875 million to $950 million and $2.40 to $3.30, respectively.
eXp World Holdings, Inc. (NASDAQ: EXPI), the DSCI’s second largest component and by far its best performer since its March 2020 establishment, soared 31.7% in May. Over the first five months of 2023, EXPI has increased 38.9%. EXPI shares have gained a remarkable 222.0% over the 3-¼ years the DSCI has been computed.
In early May, EXPI, the fastest growing real estate brokerage in the world, reported 1Q 2023 revenue and adjusted EBITDA of $850.6 million and $13.3 million, down from $1.01 billion and $17.7 million, respectively, in 1Q 2022. EXPI’s variable cost business model limited the declines in both measures from the global residential real estate market downturn.
EXPI’s real estate transaction volume was $33.2 billion in 1Q 2023, 20% slower than in 1Q 2022. Nevertheless, the number of agents on EXPI’s realty platform reached 87,327 as of March 31, 2023, up 12% versus March 31, 2022.
A leading provider of financial services in the U.S. and Canada, and the largest market cap stock in the DSCI, Primerica, Inc. (NYSE: PRI) inched 0.3% lower in May, cutting its YTD gain to 28.3%. Since the March 2020 establishment of the DSCI, PRI has increased 66.1%. Both the YTD and 39-month jumps markedly surpass the respective gains in the direct selling index.
On May 8, PRI reported 1Q 2023 adjusted operating revenue of $695.0 million, up slightly from $692.6 million in the year-ago period. Furthermore, adjusted diluted EPS in 1Q 2023 reached $3.49, an 18% jump from $2.96 in 1Q 2022. The robust results reflect the continued growth of adjusted premiums in PRI’s Term Life unit, the benefit of higher interest rates on net investment income in the Corporate and Other Distributed Products segment and improving profitability in PRI’s Senior Health division.
In 1Q 2023, PRI repurchased about 531,000 shares of its common stock for $85.2 million. The company expects $375 million of total share repurchases in the full year 2023.
Nature’s Sunshine Products, Inc. (NASDAQ: NATR) increased 2.0% in May, adding to its YTD gain of 34.4%, the third highest mark for all large-cap DSCI components. Since the establishment of the DSCI on March 1, 2020, NATR, which markets and distributes nutritional and personal care products in more than 40 countries, has appreciated 44.0%, outperforming both the direct selling index and the Dow Jones Industrials Average.
On May 9, NATR reported 1Q 2023 net sales of $108.6 million versus $110.5 million in the year-ago period. NATR’s adjusted EPS in 1Q 2023 was $0.23, a significant improvement over its 1Q 2022 adjusted loss of $0.03 per share. Key Japan and Taiwan markets showed double digit percentage revenue growth in 1Q 2023.
The Beachbody Company, Inc. (NYSE: BODY), a leading subscription health and wellness company, gained 4.1% in May. Over the first five months of 2023, BODY has declined 7.6%.
On May 8, BODY reported 1Q 2023 revenue of $144.9 million versus $198.9 million in the prior-year period. Moreover, BODY’s adjusted EBITDA showed dramatic improvement: a $0.9 million loss in 1Q 2023 compared with a $19.1 million shortfall in 1Q 2022. The company’s 1Q 2023 revenue and adjusted EBITDA both exceeded management’s guidance. During 1Q 2023, BODY successfully completed the transition to its expanded BODi platform.
BODY projects 2Q 2023 revenue and adjusted EBITDA of $125 million to $140 million and a loss of $5 million to $10 million, respectively.
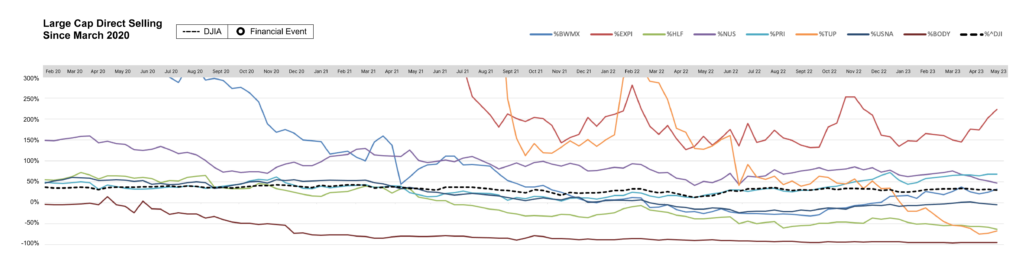
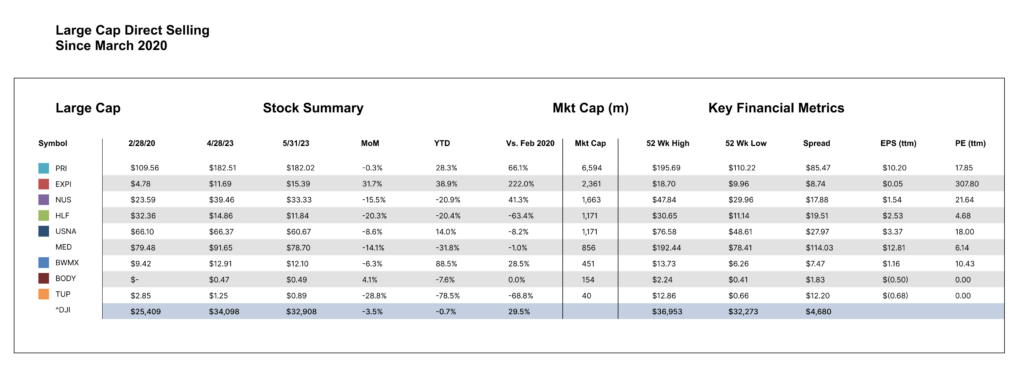 Note: For the purpose of this report, Direct Selling Capital considers companies with a market capitalization in excess of $1 billion “Large Cap.”
Small Cap
Our small cap tracking set generally outperformed their large cap peers in May. Three of the seven smaller direct selling stocks rose during the month, while four declined.
LifeVantage Corporation (NASDAQ: LFVN) was the best performing stock (with a market cap of at least $10 million) in the DSCI in May. It soared 41.2% during the month; year to date, it has gained 25.3%. LFVN, a pioneer in the study of how nutrition and naturally occurring compounds affect human genes to promote good health, reported third-quarter FY 2023 (quarter ended March 31, 2023) revenue of $53.7 million, up from $50.0 million in the year-ago period. The company’s adjusted diluted EPS in 3Q FY23 was $0.08 versus $0.12 in 3Q FY22.
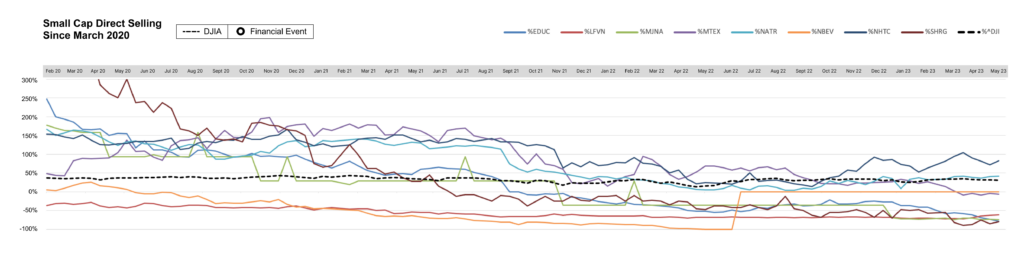
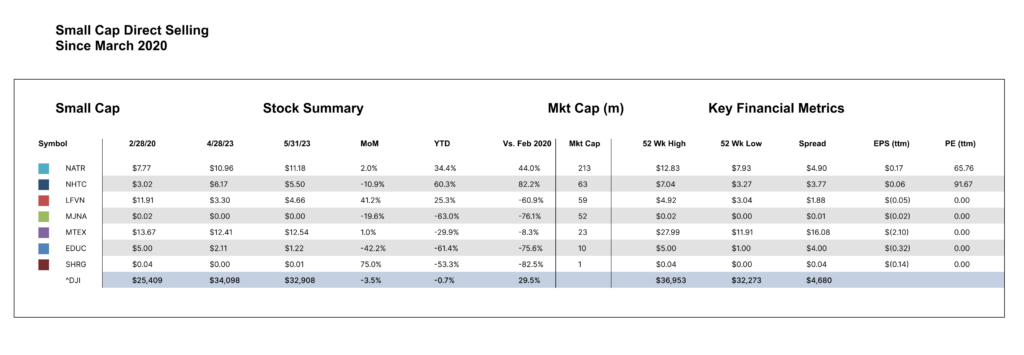
Short Interest Data & Analysis
The following chart is an aggregate index of “days to cover” among the entire tracking set. Days to cover (DTC) is a measurement determined by dividing the total outstanding short interest by average daily trading volume.
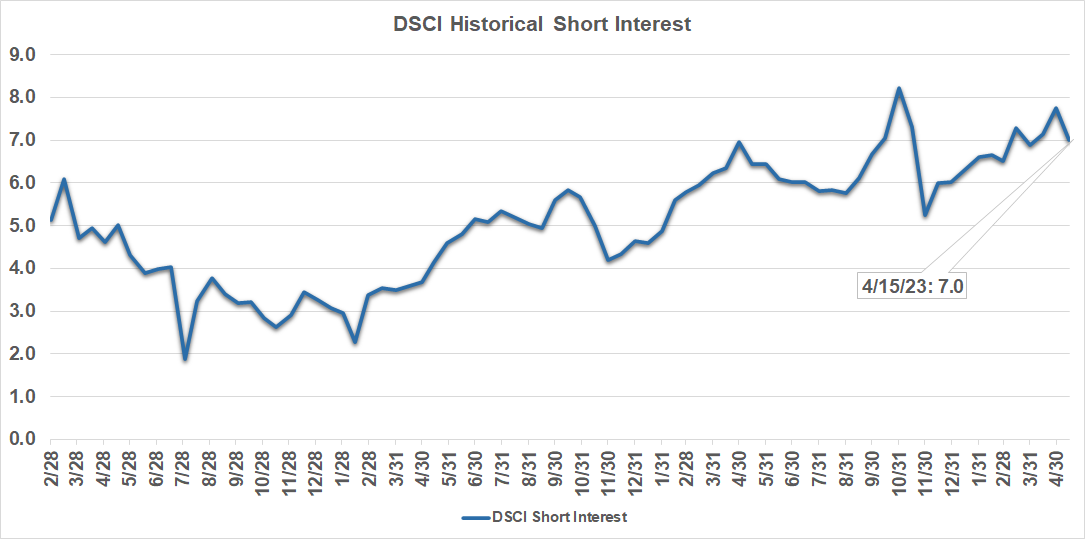
As indicated in the chart above, short interest in DSCI stocks was 7.0 days in mid-May, down from 7.7 days at the end of April and from 7.1 days as of mid-April. The 7.0 DTC figure as of mid-May is up dramatically from 4.6 days in mid-January 2023. Aggregate DSCI “days-to-cover” have approximately tripled since bottoming in mid-February 2021. The biggest absolute decrease in DTC from the end of April to mid-May for a DSCI component was NUS’s decline to 4.8 days from 5.5 days.
Short interest can be a difficult indicator to analyze. On the one hand, an increase in short interest can be a bearish sign in that it indicates an increased view among investors that a stock is likely to decline based on any number of factors, such as a belief that the company’s fundamentals are deteriorating or that it has run too far, too fast. On the other hand, as a stock moves higher, a significant short interest can serve as extra fuel on the fire as investors scramble to “buy to cover” their short positions and mitigate losses.
Anaylst Sentiment Index
Our Analyst Sentiment Index was unchanged in May versus April. During May, the proportion of sell-side analysts maintaining “buy” and “hold” ratings on industry stocks was 93%. Conversely, the percentage of stocks which analysts recommend selling was approximately 7% during the month.
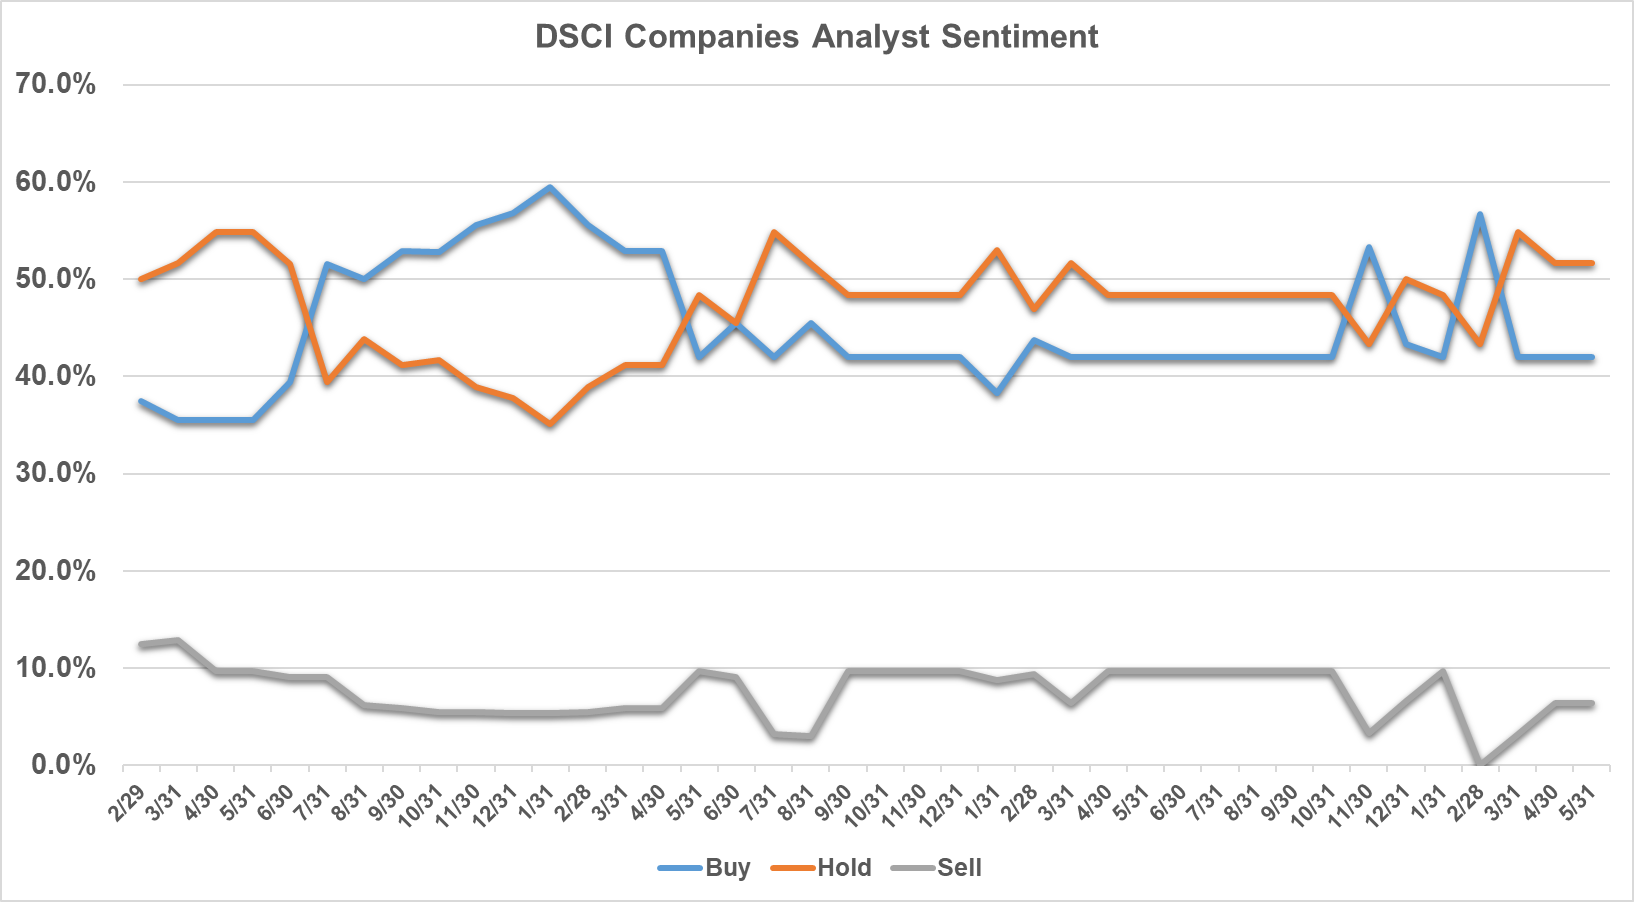
Methodology: The DSCA Analyst Sentiment Index is a consensus tracking tool that aggregated and averages the recommendations of all covering analysts across all public direct selling companies.
-
April 2023
Brought to you by Direct Selling Capital Advisors
Direct Selling Index Adds 2.2% in April, which Represents its Third Monthly Gain in the Last Four
In April, the Direct Selling Capital Advisors Direct Selling Index (DSCI) posted its third positive month of 2023. The index gained 2.2% in April, essentially mirroring the 2.5% increase in the Dow Jones Industrials in the month.
Large cap DSCI members performed much better than their smaller brethren in April. Five large caps rose and four fell during the month. In contrast, only two small caps posted gains in April (one by more than 20%), while five small caps declined in price, four by more than 20%.
From a longer-term perspective, the DSCI has appreciated an aggregate 32.0% since its March 1, 2020 inception. The DJIA has slightly outpaced the DSCI’s performance over the last 38 months. Since March 1, 2020, the DJIA has gained 34.2%.
In April, stock market investors were forced to assess the effects of two major countervailing forces. On the one hand, investors welcomed the prospect that the Fed seemed likely to soon pause, if not stop, its 13-month long streak of raising short-term interest rates. (Indeed, that view seemed to be confirmed by the Fed’s May 3rd rate hike and accompanying policy statement.). In turn, risk-tolerant market participants added to positions in large cap stocks, particularly large technology stocks.
On the other hand, economic statistics have begun to point to a softening in the economy, perhaps leading to a mild recession in the second half of 2023. Indeed, the U.S. GDP grew at only a 1.1% rate in 1Q 2023, well below consensus estimates of around 2%. This, coupled with uncertainty in the banking sector, has tempered some of the optimism associated with the apparent conclusion of one of the longest series of Fed rate hikes in history.
The net result of all this was a modest increase in U.S. stock market indices, including the DJIA, in April. The DSCI generally followed the broad market trend during the month.
Looking Forward
Most large-cap direct selling stocks have already reported 1Q 2023 results, and while the typical company reported lower revenue and adjusted EBITDA versus the year-ago period, the financial details were mostly in line with expectations. These reports translated into the DSCI’s maintaining a significant performance advantage over the DJIA over the first four months of 2023. Through April, the direct selling stock index has gained 15%, about five times the appreciation of the DJIA over this period.
Consequently, the direction of the DSCI components in May seems likely to be closely tied to the movement in the broad stock market. If so, bullish investors will have to surmount two important challenges this month. First, May has historically been one of the weakest calendar months for the stock market. Second, earnings for corporate America are slowing. Aggregate 1Q 2023 earnings for S&P 500 components which have reported results so far are down around 3.7% versus 1Q 2022. This marks the second successive quarter of lower year-over-year earnings; S&P 500 company profits fell 3.2% in 4Q 2022.
CHARTS & ANALYSIS
Direct Selling Capital Advisors Index
The DSCI is a market capitalization weighted index of all domestic public direct selling companies with a market capitalization of at least $25 million. The index is rebalanced monthly, and no single issue is permitted to represent more than 20% of its total value. In such an event, the excess weighting would be redistributed among the other index components.
The DSCI rose in April but slightly underperformed the DJIA during the month. The DSCI gained 2.2% in April versus a 2.5% increase in the DJIA. DSCI data is tracked back to March 1, 2020. The direct selling index has risen 32.0% since that date compared with a 34.2% increase for the DJIA. At its peak in June 2021, the DSCI had risen 115.6% since inception.
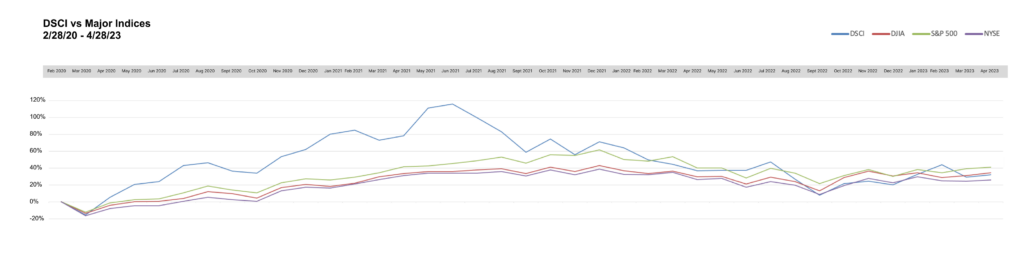
Large Cap
Betterware de Mexico (NASDAQ: BWMX) increased 8.5% in April, making it the best performing large cap DSCI component for the second consecutive month. BWMX is likewise the leading gainer among all large-cap DSCI stocks YTD in 2023, a four-month stretch over which the stock more than doubled. Since DSCI inception, BWMX is up 37.1%.
Largely due to the inclusion of Jafra Mexico and Jafra USA’s results, Betterware’s 1Q 2023 net revenue totaled 3.27 billion pesos, up 75% from 1.87 billion pesos in the year-ago period. Consolidated EBITDA also rose in the just-completed quarter, reaching 659.0 million pesos, 20.3% higher than the 547.8 million pesos recorded in 1Q 2022.
Despite the uncertain global economic environment, BWMX reaffirmed its full-year 2023 revenue and EBITDA guidance ranges. The company expects net revenue and EBITDA this year to reach 13.2 billion to 14.2 billion pesos and 2.6 billion to 2.8 billion pesos, respectively, each up significantly from 2022 levels.
BWMX began trading in March 2020 after the company’s merger with SPAC sponsor DD3 Acquisition Corp. BWMX specifically targets the Mexican market; it serves three million households through distributors and associates in approximately 800 communities throughout Mexico.
Nu Skin Enterprises, Inc. (NYSE: NUS) inched 0.4% higher in April cutting its YTD loss to 6.4%. Since the March 2020 establishment of the DSCI, NUS has gained 67.4%, significantly outperforming both the direct selling stock index (+32.0%) and the Dow Jones Industrial Average (+34.2%).
On May 3, NUS reported 1Q 2023 revenue and adjusted EPS of $481.5 million and $0.37, down from $604.9 million and $0.76, respectively, in the year-ago period. The results were in line with the company’s expectations, reflecting better-than-expected performances in South Korea and Mainland China, while the Americas and other parts of Southeast Asia continued to be affected by inflation and recession concerns.
Also on May 3, NUS reiterated the financial guidance for 2023 which it originally issued in mid-February. NUS projects 2023 revenue of $2.03 billion to $2.18 billion, down from $2.23 billion in 2022. Adjusted EPS is similarly expected to decline in 2023 to $2.35 to $2.75. NUS reported $2.90 of adjusted EPS in 2022.
Herbalife Nutrition, Inc. (NYSE: HLF) lost 7.7% in April, reducing its YTD performance to just below breakeven, -0.1%. Since the March 2020 establishment of the DSCI, HLF has lost 54.1%, making it the worst performing DSCI large cap stock which has traded continuously since index inception.
On May 2, HLF reported 1Q 2023 net sales of $1.25 billion, down 6.3% from $1.34 billion in 1Q 2022. The company’s adjusted diluted EPS also declined, falling to $0.54 in 1Q 2023 versus $0.99 in the year-ago period. Earnings declined because of lower sales, continued input cost inflation and timing of distributor event spending. Improved pricing could only offset some of these pressures.
HLF has implemented a Transformation Program which is expected to deliver more than $70 million in annual savings, about half of which should be realized in 2023. Nevertheless, given the shifting macroeconomic backdrop and rapid sentiment changes, HLF is not providing 2023 revenue or EPS guidance.
In April, HLF amended its Senior Secured Credit Facility to loosen its gross leverage covenant. This provides the company greater financial flexibility. HLF was compliant with all debt covenants as of March 31, 2023.
Medifast, Inc. (NYSE: MED) was the worst performing large cap DSCI member in April, declining 11.6%. Year to date, MED has lost 20.5%. More constructively, since the March 1, 2020 establishment of the DSCI, MED shares have gained 15.3%. After boosting its quarterly dividend 0.6% in mid-March, MED’s annual dividend rate is $6.60 per share, making its dividend yield a very attractive 7.25%.
On May 1, MED announced 1Q 2023 revenue of $349.0 million, down 16.4% from $417.6 million in 1Q 2022. Nevertheless, the company’s diluted EPS in 1Q 2023 was $3.69, up from $3.59 in the year-ago period. MED offset the revenue decline in 1Q 2023 through dramatic cuts in SG&A expenses in the quarter. More specifically, SG&A expense totaled $192.9 million in 1Q 2023, down 22% from $247.2 million in 1Q 2022. MED’s 1Q 2023 revenue and diluted EPS each markedly exceeded the top ends of management’s guidance ranges of $300 million to $320 million and $1.75 to $2.40, respectively.
For the second quarter of 2023, MED expects to report revenue and diluted EPS of $250 million to $270 million and $1.32 to $1.44, respectively.
USANA Health Sciences, Inc. (NYSE: USNA) posted its fourth successive monthly gain in April. USNA’s 5.5% increase during the month added to its YTD gain of 24.8%. Since the March 2020 inception of the DSCI, USANA shares have eked out a 0.4% gain compared with 32.0% and 34.2% increases for the direct selling index and the DJIA, respectively.
On April 25, USANA reported 1Q 2023 revenue and diluted EPS of $248 million and $0.95, both down from $273 million and $1.15, respectively, in 1Q 2022. USANA’s 1Q 2023 performance was boosted in the first few weeks of the quarter by increased demand for several of the company’s health products in China following the government’s shift in COVID policy.
USANA’s 1Q 2023 performance prompted management to raise the lower end of its full-year 2023 guidance ranges for revenue and earnings. The company now expects 2023 sales and diluted EPS to be in the ranges of $875 million to $950 million and $2.40 to $3.30, respectively.
On July 1, USANA President Jim Brown will assume the title of CEO under the company’s planned succession strategy. At that time, Kevin Guest, who has held the CEO position since 2015, will transition to the role of Executive Chairman.
eXp World Holdings, Inc. (NASDAQ: EXPI), the DSCI’s best performer since its March 2020 establishment, declined 7.9% in April, cutting its YTD increase to 5.5%. EXPI shares have gained 144.6% over the 38 months the DSCI has been computed.
On May 2, EXPI, the fastest growing real estate brokerage in the world, reported 1Q 2023 revenue and adjusted EBITDA of $850.6 million and $13.3 million, down from $1.01 billion and $17.7 million, respectively, in 1Q 2022. EXPI’s variable cost business model limited the declines in both measures from the global residential real estate market downturn.
EXPI’s real estate transaction volume was $33.2 billion in 1Q 2023, 20% lower than in 1Q 2022. Nevertheless, the number of agents on EXPI’s realty platform reached 87,327 as of March 31, 2023, up 12% versus March 31, 2022.
A leading provider of financial services in the U.S. and Canada, and the largest market cap stock in the DSCI, Primerica, Inc. (NYSE: PRI)
rose 6.0% in April bringing its YTD gain to 28.7%. Since the March 2020 establishment of the DSCI, PRI has increased 66.6%. Both the YTD and 38-month jumps markedly surpass the respective gains in the direct selling index.
In February, PRI reported that 4Q 2022 adjusted operating revenue was $684.5 million, 5% lower than the comparable figure in 4Q 2021. Conversely, 4Q 2022 adjusted net operating income reached $129.9 million, up 11% from the year-ago period. PRI plans to release its 1Q 2023 financial results after the stock market close on May 8.
Nature’s Sunshine Products, Inc. (NASDAQ: NATR) rose 7.3% in April, bringing its YTD gain to 31.7%, the second highest mark for all large-cap DSCI components. Since the establishment of the DSCI on March 1, 2020, NATR, which markets and distributes nutritional and personal care products in more than 40 countries, has jumped 41.1%, outperforming both the direct selling index and the Dow Jones Industrials Average.
In mid-March, NATR reported 4Q 2022 net sales and adjusted EBITDA of $102.7 million and $8.0 million versus $117.9 million and $11.6 million, respectively, in the year-ago period. The company will release its 1Q 2023 results after the stock market close on May 9.
The Beachbody Company, Inc. (NYSE: BODY), a leading subscription health and wellness company, fell 3.1% in April. Over the first four months of 2023, BODY declined 11.2%.
In mid-March, BODY reported 4Q 2022 revenue and adjusted EBITDA of $148.2 million and $3.5 million compared with $216.3 million and negative $26.6 million, respectively, in 4Q 2021. The 4Q 2022 results represented solid progress in the company’s One-Brand strategy and highlight management’s focus on improving profitability.
BODY plans to release its 1Q 2023 financial results after the stock market close on May 8. Earlier this year, BODY projected that its 1Q 2023 revenue would be $135 million to $140 million and that it would incur an adjusted EBITDA loss of $3 million to $6 million in the quarter.
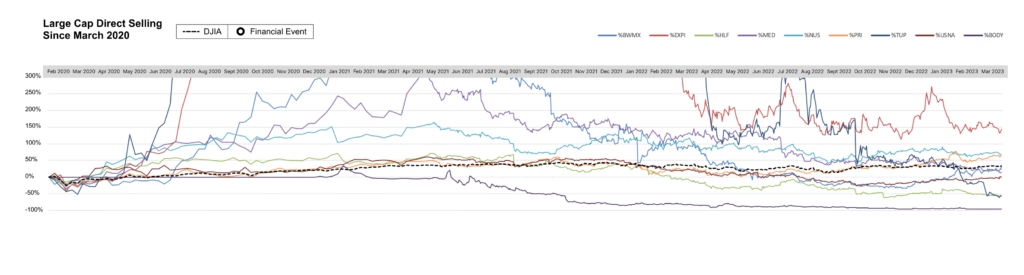
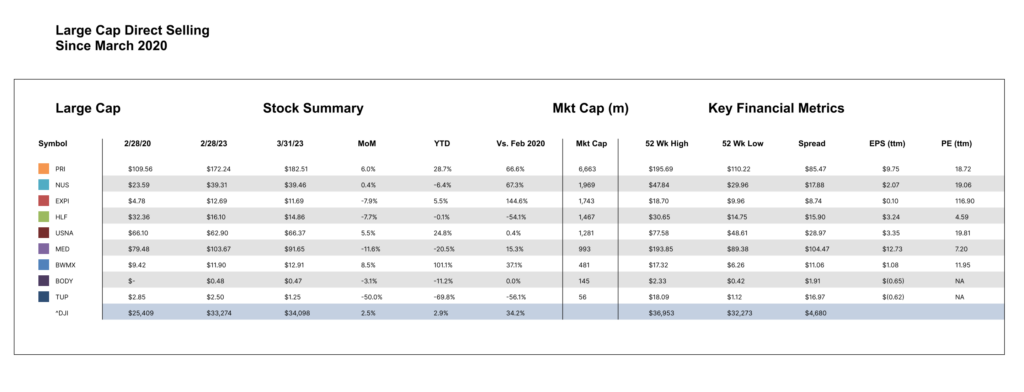
Small Cap
Our small cap tracking set noticeably underperformed their large cap peers in April. Only two of the seven smaller direct selling stocks rose during the month, while five declined.
Natural Health Trends Corp. (NASDAQ: NHTC) was by far the best performing stock in the DSCI in April. It soared 24.9% during the month, bringing its YTD gain to a remarkable 79.9%. Since the index was established just over three years ago, NHTC has more than doubled. NHTC, which markets personal care, wellness and quality of life products, reported 1Q 2023 revenue of $11.9 million, up from $11.5 million in the year-ago period. The company’s diluted EPS in the just-completed quarter was positive $0.02 in 1Q 2023 versus a loss of $0.01 in 1Q 2022.
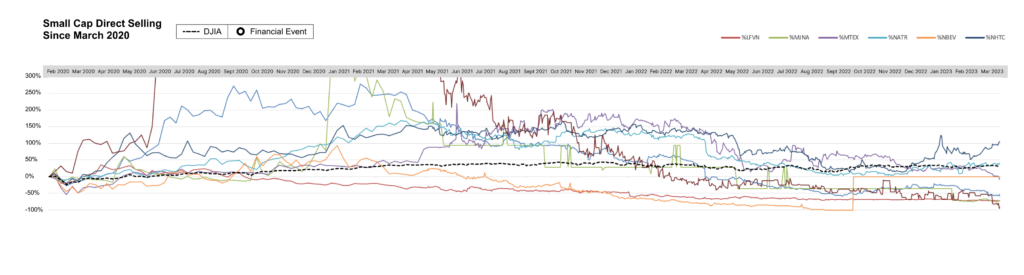
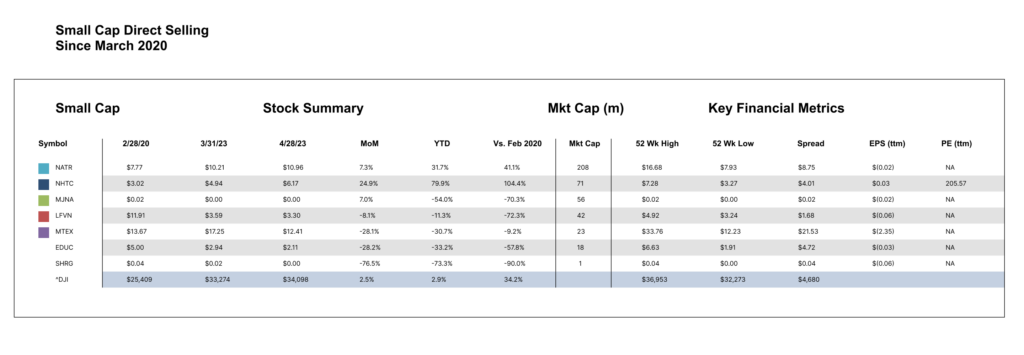
Short Interest Data & Analysis
The following chart is an aggregate index of “days to cover” among the entire tracking set. Days to cover (DTC) is a measurement determined by dividing the total outstanding short interest by average daily trading volume.
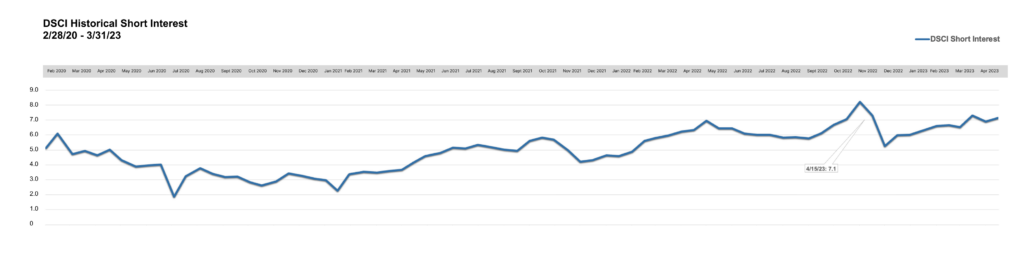
As indicated in the chart above, short interest in DSCI stocks was 7.1 days in mid-April, up slightly from 6.9 days at the end of March and down from 7.3 days as of mid-March. The 7.1 DTC figure as of mid-April is up dramatically from 4.6 days in mid-January 2023. Aggregate DSCI “days-to-cover” have approximately tripled since bottoming in mid-February 2021. The biggest absolute increase in DTC from the end of March to mid-April for a DSCI component was HLF’s jump to 9.2 days from 8.3 days.
Short interest can be a difficult indicator to analyze. On the one hand, an increase in short interest can be a bearish sign in that it indicates an increased view among investors that a stock is likely to decline based on any number of factors, such as a belief that the company’s fundamentals are deteriorating or that it has run too far, too fast. On the other hand, as a stock moves higher, a significant short interest can serve as extra fuel on the fire as investors scramble to “buy to cover” their short positions and mitigate losses.
Analyst Sentiment Index
Our Analyst Sentiment Index fell in April from near all-time highs in March. During April, the proportion of sell-side analysts maintaining “buy” and “hold” ratings on industry stocks was 94%, down from 97% in March. Conversely, the percentage of stocks which analysts recommend selling was approximately 6% in April versus 3% in March.
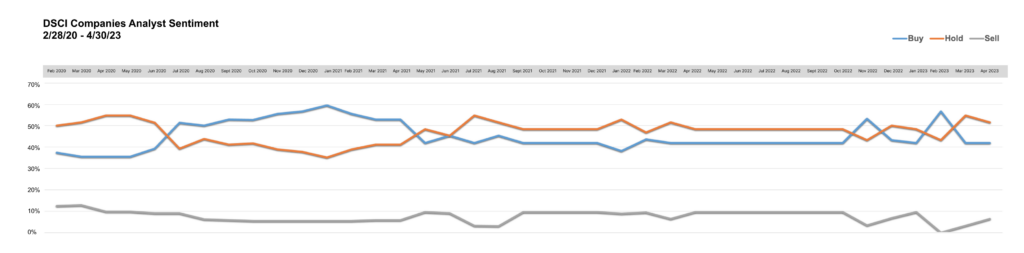
Methodology: The DSCA Analyst Sentiment Index is a consensus tracking tool that aggregates and averages the recommendations of all covering analysts across all public direct selling companies.
-
March 2023
Brought to you by Direct Selling Capital Advisors
Direct Selling Index Declined 10.3% in March, Partially Reversing Robust Results in January and February; DSCI Underperformed DJIA in March
The Direct Selling Capital Advisors Direct Selling Index (DSCI) retreated in March after posting robust gains in both January and February. More specifically, the index declined 10.3% in March, reversing part of February’s 8.9% increase and January’s 10.2% gain. The DSCI markedly underperformed the Dow Jones Industrials in March, as the Dow rose 1.9% during the month.
Both large cap and small cap DSCI members encountered difficulties in March. Seven of the ten large caps fell, four by double digit percentages. Only one large cap gained more than 10% during the month. Similarly, four the of six small caps fell in price, two by more than 10%. One of the two small cap gainers in March rose by double-digit percentage points.
From a longer-term perspective, the DSCI has appreciated an aggregate 29.2% since its March 1, 2020 inception. With the index’s weak March performance, the DJIA has slightly outpaced the DSCI’s performance over the last 37 months. Since March 1, 2020, the DJIA has gained 31.0%.
March was an extraordinarily volatile and news-filled month for stock market investors. The Federal Reserve’s year-long rate hike cycle contributed to stresses in the U.S. and global banking system, which in turn caused the collapse of three regional banks and a Swiss government-initiated takeover of Credit Suisse. The U.S. government moved quickly—and appears to have headed off the crisis—with deposit backstops and a new special lending facility for banks.
With the turmoil, investors quickly began pricing in a potential Fed Funds interest rate cut as soon as July, a marked departure from prior expectations of a continuation of rate increases through at least the end of 2023. At the same time, U.S. Treasury interest rates across the yield curve fell significantly from February 2023 levels.
In this volatile environment, investors generally channeled funds into large cap stocks and withdrew them from small cap sectors. Indeed, seven of the eleven S&P 500 large cap sectors, led by technology stocks, rose in March. In contrast, only two of eleven Russell 2000 small cap segments gained during the month. Since DSCI components are generally considered small caps, this giant performance gap between large and small cap stocks overall explains much of the direct selling index’s disappointing performance in March.
Looking Forward
Direct selling stocks will start reporting 1Q 2023 results in late April and early May so their performance during much of April will likely be determined by the strength of the overall earnings season for the broad market. Investors will be particularly keen to hear if the March banking crisis has impacted wide areas of the economy. An issue sure to be scrutinized is whether there has been any change in the pace of loan activity to consumers or businesses.
If recent history is any guide, the earnings season could provide some level of comfort to investors. Since the Federal Reserve began its rate hiking cycle, investors have often feared that reported earnings and earnings guidance will be worse than they prove to be.
As has been the case for some time now, the government’s next release of consumer price inflation (CPI) index data on April 12 will significantly impact consumer sentiment and could help dictate future Federal Reserve actions. The next Fed interest rate setting meeting is scheduled for May 2-3.
CHARTS & ANALYSIS
Direct Selling Capital Advisors Index
The DSCI is a market capitalization weighted index of all domestic public direct selling companies with a market capitalization of at least $25 million. The index is rebalanced monthly, and no single issue is permitted to represent more than 20% of its total value. In such an event, the excess weighting would be redistributed among the other index components.
The DSCI fell in March and underperformed the DJIA during the month. The DSCI lost 10.3% in March, markedly trailing the DJIA which gained 1.9%. DSCI data is tracked back to March 1, 2020. The direct selling index has risen 29.2% since that date versus a 31.0% gain for the DJIA. At its peak in June 2021, the DSCI had risen 115.6% since inception.
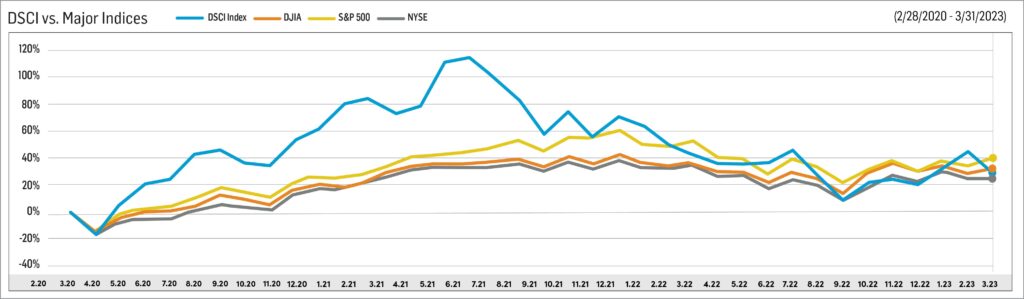
Large Cap
Betterware de Mexico (NASDAQ: BWMX) jumped 17.9% in March, making it the best performing large cap DSCI component for the month. Even more impressive, this gain follows outsized 30.7% and 20.3% increases in January and February, respectively. Over the first three months of 2023, BWMX has soared 85.4%, confirming its place as by far the top performing index member. Since DSCI inception, the stock is up 26.3%.
Buoyed by the inclusion of Jafra Mexico and Jafra USA’s results, Betterware’s 4Q 2022 net revenue totaled 3.23 billion pesos, up 48% from 2.182 billion pesos in 4Q 2021. Similarly, consolidated EBITDA in 4Q 2022 increased 53.6% to 566.3 million pesos from 368.8 million pesos in the year-ago period. BWMX expects full-year 2023 net revenue and EBITDA to reach 13.2 to 14.2 billion pesos and 2.6 to 2.8 billion pesos, respectively, each up significantly from 2022 levels.
BWMX began trading in March 2020 after the company’s merger with SPAC sponsor DD3 Acquisition Corp. BWMX specifically targets the Mexican market; it serves three million households through distributors and associates in approximately 800 communities throughout Mexico.
Tupperware Brands Corporation (NYSE: TUP) was the worst performing large cap member of the DSCI in March, declining 39.0%. This added to both its YTD loss of 39.6% and its 12.3% decline since the direct selling index was established 37 months ago.
On April 7, TUP announced that it has engaged financial advisors to help improve its capital structure and remediate doubts regarding its ability to continue as a going concern. The company is taking immediate action to seek additional financing and to address its weak financial position.
TUP still has not filed its Form 10-K for 2022. Consequently, the company will be in violation of its Credit Facility covenants. In turn, TUP may not have adequate liquidity in the near term.
In early March, TUP reported preliminary 4Q 2022 net sales of $313.7 million, down 20% from 4Q 2021. TUP’s adjusted diluted loss in the December quarter was $0.79 per share versus positive $0.32 per share in the year-ago period. In North America, pricing and compensation plan actions resulted in lower sales than expected.
Nu Skin Enterprises, Inc. (NYSE: NUS) fell 1.3% in March, bringing its YTD loss to 6.8%. Since the March 2020 establishment of the DSCI, NUS has gained 66.6%, significantly outperforming both the direct selling stock index (+29.2%) and the Dow Jones Industrial Average (+31.0%).
On March 30, NUS announced that CFO Mark Lawrence was resigning to pursue an outside opportunity. Mr. Lawrence, who held the CFO role for six years will stay on through April 2023 as a senior advisor to NUS. James Thomas, SVP and chief accounting officer, will take on the CFO responsibilities on an interim basis. As part of the CFO transition announcement, NUS reiterated the 1Q 2023 and full-year 2023 guidance it released in mid-February in conjunction with the release of its 4Q 2022 earnings (see below). NUS will report 1Q 2023 results on May 3.
On February 15, NUS reported 4Q 2022 revenue and adjusted EPS of $522.3 million and $0.89, down from $673.4 million and $1.11, respectively, in 4Q 2021. A challenging global macro environment was the principal reason for the lower results; however, the company expects conditions to improve gradually as 2023 progresses.
For the full-year 2023, NUS projects revenue of $2.03 to $2.18 billion, down from $2.23 billion in 2022. Adjusted EPS is similarly expected to decline in 2023 to $2.35 to $2.75. NUS reported $2.90 of adjusted EPS in 2022.
Herbalife Nutrition, Inc. (NYSE: HLF) fell 16.8% in March, breaking a pattern of successive double-digit percentage increases in February (+10.1%) and January (+18.1%). In the first quarter of 2023, HLF gained 8.2%. However, since the March 2020 establishment of the DSCI, HLF has lost 50.2%, making it the worst performing DSCI large cap stock which has traded continuously since index inception.
In mid-February, HLF reported 4Q 2022 net sales of $1.2 billion, down 10.4% from 4Q 2021. The company’s adjusted diluted EPS totaled $0.53 compared with $0.57 in the year-ago period. Macroeconomic pressures continued to impact HLF’s operations and customer demand in 4Q 2022.
HLF has implemented a Transformation Program which is expected to deliver $70 million in annual savings, about half of which should be realized in 2023. Nevertheless, given the shifting macroeconomic backdrop and rapid sentiment changes, HLF is not providing 2023 revenue or EPS guidance. The company will report 1Q 2023 results on May 2.
Medifast, Inc. (NYSE: MED) fell 7.5% in March, adding to its YTD loss of 10.1%. More constructively, since the March 1, 2020 establishment of the DSCI, the stock has gained 30.4%. After boosting its quarterly dividend 0.6% in mid-March, MED’s annual dividend rate is $6.60 per share, making its dividend yield a very attractive 6.9%.
In February, MED announced 4Q 2022 revenue of $337.2 million, down 10.7% from $377.8 million in the year-ago period. MED’s 4Q 2022 EPS was $2.41 versus $2.91 in 4Q 2021. Continued pressure on customer acquisition limited results in 4Q 2022.
For the first quarter of 2023, MED expects to report revenue and diluted EPS of $300-$320 million and $1.75 to $2.40, respectively.
USANA Health Sciences, Inc. (NYSE: USNA) posted its third successive monthly gain in March. USNA’s 3.5% increase during the month added to its YTD gain of 18.2%. Since the March 2020 inception of the DSCI, USANA shares have declined 4.8% compared with gains in both the direct selling index and the DJIA.
In early February, USANA announced 4Q 2022 revenue and diluted EPS of $228 million and $0.66, lower than comparable 4Q 2021 figures of $267 million and $1.03, respectively. Incremental sales of certain products in mainland China over the last two weeks of 2022 following the country’s unanticipated shift in COVID policy boosted 4Q 2022 results. USANA had approximately 490,000 total active customers as of December 31, 2022.
USANA issued 2023 sales and diluted EPS guidance of $850-$950 million and $2.35 to $3.30, respectively. Uncertainties about the duration of China’s recovery and its subsequent normalized level of business represent key reasons for the broad guidance ranges.
On July 1, USNA President Jim Brown will assume the title of CEO under the company’s planned succession strategy. At that time, Kevin Guest, who has held the CEO position since 2015, will transition to the role of Executive Chairman.
eXp World Holdings, Inc. (NASDAQ: EXPI), the DSCI’s best performer since its March 2020 establishment, rose 5.0% in March, partially reversing a 22.5% decline in February. EXPI gained 14.5% in 1Q 2023 and has appreciated 165.5% over the last 37 months.
EXPI, the fastest growing real estate brokerage in the world, reported 4Q 2022 revenue and adjusted EBITDA of $933.4 million and $3.6 million, down from $1.077 billion and $13.1 million, respectively, in 4Q 2021. EXPI’s real estate transaction volume in 4Q 2022 was $37.6 billion, 16% less than in the year-ago period. As of December 31, 2022, EXPI had 86,203 agents.
A leading provider of financial services in the U.S. and Canada, and the largest market cap stock in the DSCI, Primerica, Inc. (NYSE: PRI) fell 10.3% in March, matching the index’s performance during the month. Nevertheless, PRI has gained 21.4% and 57.2% YTD and since the March 2020 establishment of the DSCI, respectively. Both increases well surpass the respective gains in the direct selling index.
In late February, PRI reported that 4Q 2022 adjusted operating revenue was $684.5 million, 5% lower than the comparable figure in 4Q 2021. Conversely, 4Q 2022 adjusted net operating income reached $129.9 million, up 11% from the year-ago period. PRI’s Term Life unit benefitted from a significant reduction in COVID-related death claims in 4Q 2022. Also, overall claims in the December 2022 quarter were favorable to historic trends.
PRI repurchased $356.3 million of its own shares in 2022. In November 2022, PRI’s Board set a $375 million stock buyback target for 2023.
Nature’s Sunshine Products, Inc. (NASDAQ: NATR) dropped 5.8% in March. This decline trimmed NATR’s YTD gain to 22.7%. Since the establishment of the DSCI on March 1, 2020, NATR, which markets and distributes nutritional and personal care products in more than 40 countries, has slightly outperformed both the direct selling index and the Dow Jones Industrials Average.
On March 15, NATR reported 4Q 2022 net sales and adjusted EBITDA of $102.7 million and $8.0 million versus $117.9 million and $11.6 million, respectively, in the year-ago period. The fundamentals of NATR’s business remained strong in the fourth quarter of 2022 despite unprecedented pressure from external factors such as significant inflation and volatile foreign exchange movements.
The Beachbody Company, Inc. (NYSE: BODY), a leading subscription health and wellness company, lost 25.4% of its value in March, making it the second worst performing large cap component during the month. In the first quarter of 2023, BODY declined 8.4%.
On March 14, BODY reported 4Q 2022 revenue and adjusted EBITDA of $148.2 million and $3.5 million compared with $216.3 million and negative $26.6 million, respectively, in 4Q 2021. The 4Q 2022 results represented solid progress in the company’s One-Brand strategy and highlight management’s focus on improving profitability.
In 1Q 2023, BODY expects to record revenue of $135 million to $140 million and realize an adjusted EBITDA loss of $3 million to $6 million.
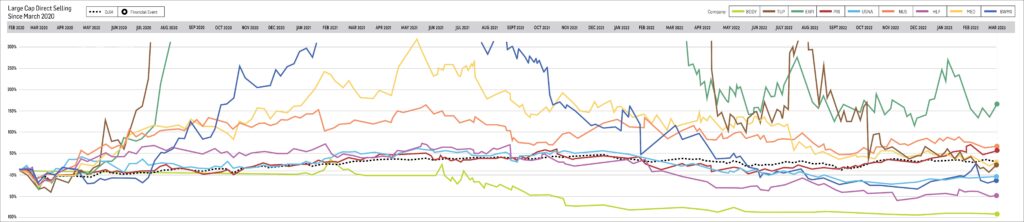
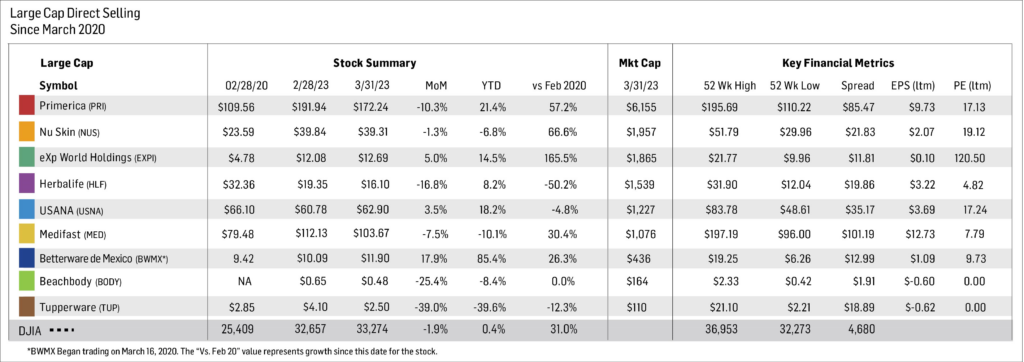
Small Cap
Our small cap tracking set’s disappointing performance mirrored that of the large cap stocks in March. Two of the six smaller direct selling stocks rose during the month, while four declined.
Mannatech, Incorporated (NASDAQ: MTEX) was the second best performing small cap stock in the DSCI in March. It gained 0.3% during the month, cutting its YTD loss to 3.6%. Since the index was established just over three years ago, MTEX has gained 26.1%. MTEX, a global health and wellness company, reported revenue of $34.3 million and a $2.7 million operating loss in the fourth quarter of 2022 versus $39.5 million in net sales and $1.0 million of operating income in 4Q 2021.
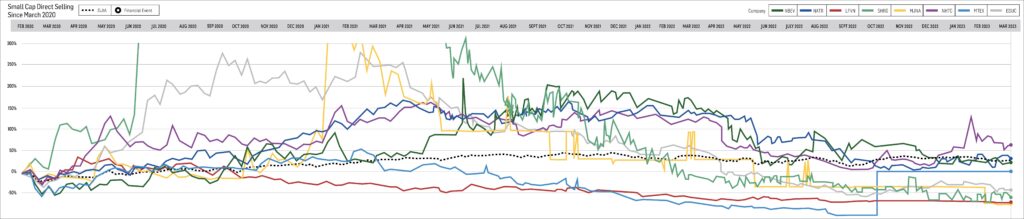
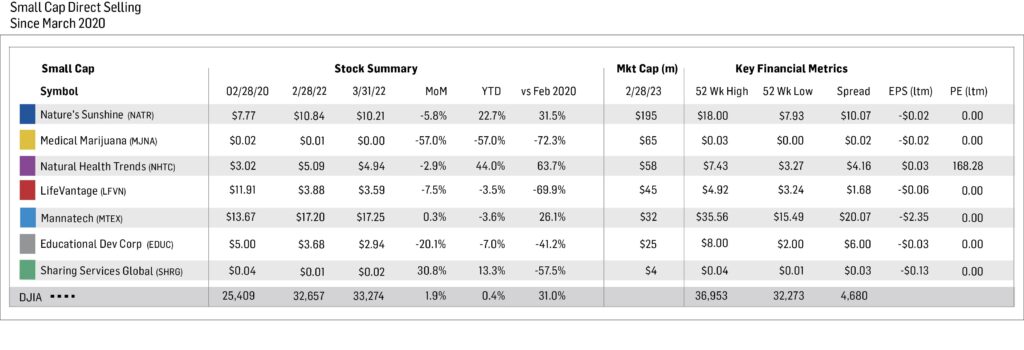
Short Interest Data & Analysis
The following chart is an aggregate index of “days to cover” among the entire tracking set. Days to cover (DTC) is a measurement determined by dividing the total outstanding short interest by average daily trading volume.
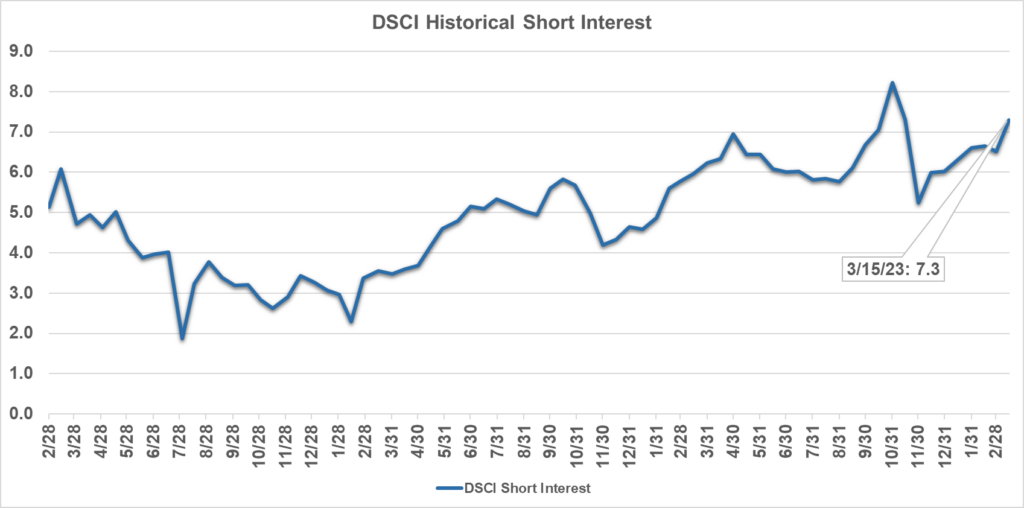 As indicated in the chart above, short interest in DSCI stocks was 6.7 days in mid-March, flat compared with the readings at both the end of February and in mid-February. The 6.7 DTC figure is up dramatically from 4.6 days in mid-January 2023. Aggregate DSCI “days-to-cover” have approximately tripled since bottoming in mid-February 2021.
The biggest absolute increase in DTC from the end of February to mid-March for a DSCI component was HLF’s jump to 7.7 days from 5.5 days. The biggest absolute decrease was MED’s decline to 5.0 days from 6.0 days.
Short interest can be a difficult indicator to analyze. On the one hand, an increase in short interest can be a bearish sign in that it indicates an increased view among investors that a stock is likely to decline based on any number of factors, such as a belief that the company’s fundamentals are deteriorating or that it has run too far, too fast. On the other hand, as a stock moves higher, a significant short interest can serve as extra fuel on the fire as investors scramble to “buy to cover” their short positions and mitigate losses.
Analyst Sentiment Index
Our Analyst Sentiment Index fell slightly in March from all-time highs in February. During the month, the proportion of sell-side analysts maintaining “buy” and “hold” ratings on industry stocks was 97%, down from 100% in February. Conversely, the percentage of stocks which analysts recommend selling was approximately 3% in March versus nil in February.
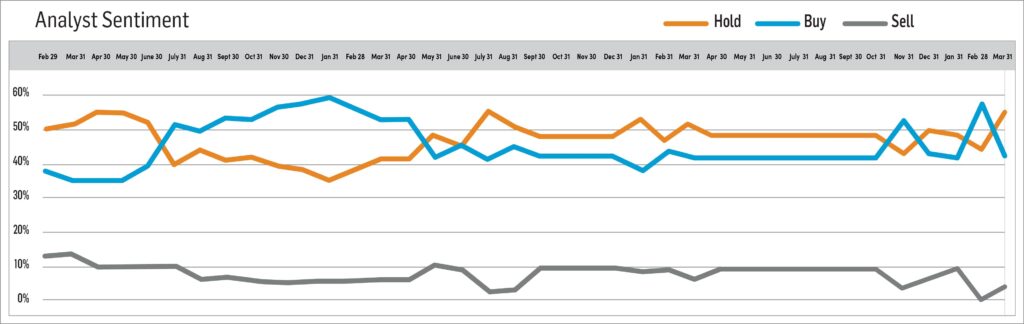
Methodology: The DSCA Analyst Sentiment Index is a consensus tracking tool that aggregates and averages the recommendations of all covering analysts across all public direct selling companies.
-
February 2023
Brought to you by Direct Selling Capital Advisors
Direct Selling Index Jumped 8.9% in February, its Second Successive Extremely Strong Month; DSCI Dramatically Outperformed DJIA in February
The Direct Selling Capital Advisors Direct Selling Index (DSCI) soared for a second consecutive month in February, gaining 8.9% after posting a 10.2% increase in January. Furthermore, the DSCI handily outpaced the Dow Jones Industrials for a second straight month in February. The Dow fell 4.2% in February after rising only 2.8% in January.
The large cap direct selling stocks significantly outperformed their small cap peers in February. Seven of the ten large caps rose, three by double digit percentages. On the other hand, only two of six small caps gained in price (one by more than 10%); three declined, and one small cap was unchanged.
From a longer-term perspective, the DSCI has appreciated an aggregate 44.1% since its March 1, 2020 inception. With its strong February performance, the DSCI has overtaken the DJIA’s performance over the last three years. Since March 1, 2020, the DJIA has gained 28.5%.
The DJIA was about flat through mid-February, as investors continued to embrace many of the same risky areas of the market they favored in January. However, midway through the month, investors began to fear the slow pace at which inflation was declining and the gap between the inflation rate and the Fed funds rate. When Home Depot and Walmart issued cautious consumer spending outlooks, the market also had to contend with fears of economic weakness. The combination of all these factors caused the DJIA to fade during the second half of February.
Despite all this, and despite the generally lackluster 4Q 2022 earnings reported by the direct selling stocks, as well as the lukewarm 2023 guidance many provided, the DSCI rose sharply for the second consecutive month in February. Part of the reason for the rally is likely a bounce after the stocks sold off too sharply in 2022 (the DSCI fell nearly 30% last year). However, to sustain the gains realized in the first two months of 2023, earnings of the direct selling stocks will likely have to improve over the course of the year.
Looking Forward
Since most direct selling stocks have already reported their 4Q 2022 earnings, the DSCI stocks will likely move in tandem with the overall stock market in March. As has been the case for some time, two of the most important catalysts for the broad market during the month will be the March 14th release of the consumer price inflation (CPI) index data and the Fed’s next interest rate setting meeting on March 22.
If the March CPI reading shows some tempering of inflation, the Fed statement eight days later describing future interest policy may have a less stringent tone, which in turn could allow stocks to rally. A less constructive inflation reading could have the opposite effect.
CHARTS & ANALYSIS
Direct Selling Capital Advisors Index
The DSCI is a market capitalization weighted index of all domestic public direct selling companies with a market capitalization of at least $25 million. The index is rebalanced monthly, and no single issue is permitted to represent more than 20% of its total value. In such an event, the excess weighting would be redistributed among the other index components.
The DSCI rose in February and outperformed the DJIA during the month. The DSCI gained 8.9% in February, trouncing the DJIA which declined 4.2%. DSCI data is tracked back to March 1, 2020. The direct selling index has risen 44.1% since that date versus a 28.5% gain for the DJIA. At its peak in June 2021, the DSCI had risen 115.6% since inception.
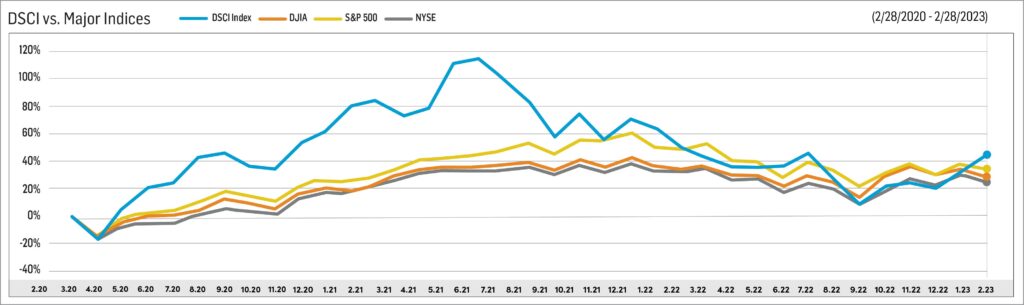
Large Cap
Betterware de Mexico (NASDAQ: BWMX) surged 20.3% higher in February, making it the best performing DSCI component during the month. Furthermore, February’s performance follows an even more impressive 30.7% jump in January. Over the first two months of 2023, BWMX has soared 57.2%. Since DSCI inception, the volatile stock is up 7.1%.
Buoyed by the inclusion of Jafra Mexico and Jafra USA’s results, Betterware’s 4Q 2022 net revenue totaled 3.23 billion pesos, up 48% from 2.182 billion pesos in 4Q 2021. Similarly, consolidated EBITDA in 4Q 2022 increased 53.6% to 566.3 million pesos from 368.8 million pesos in the year-ago period.
Management expressed confidence in its long-term growth prospects in Mexico, the U.S., and internationally. The company expects its full-year 2023 net revenue and EBITDA to reach 13.2 to 14.2 billion pesos and 2.6 to 2.8 billion pesos, respectively, each up significantly from 11.499 billion pesos and 2.213 billion pesos, respectively, in 2022.
BWMX began trading in March 2020 after the company’s merger with SPAC sponsor DD3 Acquisition Corp. BWMX specifically targets the Mexican market; it serves three million households through distributors and associates in approximately 800 communities throughout Mexico.
Tupperware Brands Corporation (NYSE: TUP) was the second worst performing large cap DSCI member in February, falling 7.4%. Year to date, TUP has declined 1.0%. The stock has gained 43.9% since the direct selling index was established three years ago.
On March 1, TUP reported preliminary 4Q 2022 net sales of $313.7 million, down 20% from $390.1 million in 4Q 2021. TUP’s adjusted diluted loss per share in the just-completed quarter was $0.79 per share versus positive $0.32 per share in the year-ago period. In North America, pricing and compensation plan actions resulted in lower sales than expected. In addition, TUP’s Asia Pacific operations continued to be adversely affected by COVID.
As it was closing its financial statements for 2022, TUP identified accounting misstatements which originated in prior annual and unaudited interim periods, most of which related to the accounting for income taxes. When TUP completes its final close, it will issue corrected statements in its 2022 Form 10-K.
Nu Skin Enterprises, Inc. (NYSE: NUS) declined 7.1% in February, bringing its YTD loss to 5.5%. Since the March 2020 establishment of the DSCI, NUS has gained 68.9%, significantly outperforming both the direct selling stock index (+44.1%) and the Dow Jones Industrial Average (+28.5%).
On February 15, NUS reported 4Q 2022 revenue and adjusted EPS of $522.3 million and $0.89, down from $673.4 million and $1.11, respectively, in 4Q 2021. A challenging global macro environment was the principal reason for the lower results; however, the company expects conditions to improve gradually as 2023 progresses.
For the full-year 2023, NUS projects revenue of $2.03 to $2.18 billion, down from $2.23 billion in 2022. Adjusted EPS is similarly expected to decline in 2023 to $2.35 to $2.75. NUS reported $2.90 of adjusted EPS in 2022.
Herbalife Nutrition, Inc. (NYSE: HLF) jumped 10.1% in February, its second successive double-digit percentage monthly stock price increase (+18.1% in January 2023). Over the first two months of 2023, HLF has gained 30.0%. However, since the March 2020 establishment of the DSCI, HLF has lost 40.2%, making it the worst performing DSCI large cap stock which has traded continuously since index inception.
On February 14, HLF reported 4Q 2022 net sales of $1.2 billion, down 10.4% from 4Q 2021. The company’s adjusted diluted EPS totaled $0.53 compared with $0.57 in the year-ago period. Macroeconomic pressures continued to impact HLF’s operations and customer demand in 4Q 2022.
HLF has implemented a Transformation Program which is expected to deliver $70 million in annual savings, about half of which should be realized in 2023. Nevertheless, given the shifting macroeconomic backdrop and rapid sentiment changes, HLF is not providing 2023 revenue or EPS guidance.
Medifast, Inc. (NYSE: MED) inched 0.6% higher in February, ending a two-month string of declines. Year to date, MED has declined 2.8%. More constructively, since the March 1, 2020 establishment of the DSCI, the stock has gained 41.1%. MED’s annual dividend rate is $6.56 per share, making its dividend yield an attractive 6.2%.
On February 21, MED announced 4Q 2022 revenue of $337.2 million, down 10.7% from $377.8 million in the year-ago period. MED’s 4Q 2022 EPS was $2.41 versus $2.91 in 4Q 2021. Continued pressure on customer acquisition limited results in 4Q 2022.
MED issued 1Q 2023 revenue and diluted EPS guidance of $300-$320 million and $1.75 to $2.40.
USANA Health Sciences, Inc. (NYSE: USNA) gained 4.0% in February, bringing its YTD gain to 14.2%. Since the March 2020 inception of the DSCI, USANA shares have declined 8.0% compared with gains in both the direct selling index and the DJIA.
On February 7, USANA announced 4Q 2022 revenue and diluted EPS of $228 million and $0.66, lower than comparable 4Q 2021 figures of $267 million and $1.03, respectively. The 4Q 2022 results are consistent with preliminary results the company issued in early January. Incremental sales of certain products in mainland China over the last two weeks of 2022 following the country’s unanticipated shift in COVID policy boosted 4Q 2022 results. USANA had approximately 490,000 total active customers as of December 31, 2022.
USANA released 2023 sales and diluted EPS guidance of $850-$950 million and $2.35 to $3.30, respectively. Uncertainties about the duration of China’s recovery and its subsequent normalized level of business represent the key reasons for the broad guidance ranges.
eXp World Holdings, Inc. (NASDAQ: EXPI), the DSCI’s best performer since its March 2020 establishment and the index’s fourth largest member by stock market capitalization, lost 22.5% in February. Nevertheless, EXPI has gained 9.0% YTD and 152.7% over the last three years.
EXPI, the fastest growing real estate brokerage in the world, reported 4Q 2022 revenue and adjusted EBITDA of $933.4 million and $3.6 million, down from $1.077 billion and $13.1 million, respectively, in 4Q 2021. EXPI’s real estate transaction volume in 4Q 2022 was $37.6 billion, 16% less than in the year-ago period. As of December 31, 2022, EXPI had 86,203 agents.
A leading provider of financial services in the U.S. and Canada and the largest market cap stock in the DSCI, Primerica, Inc. (NYSE: PRI) was the DSCI’s second best performer in February after jumping 18.7%. PRI has gained 35.3% and 75.2% YTD and since the March 2020 establishment of the DSCI, respectively. Both increases well exceed the respective gains in the direct selling index.
On February 23, PRI reported that 4Q 2022 adjusted operating revenue was $684.5 million, 5% lower than the comparable figure in 4Q 2021. Conversely, 4Q 2022 adjusted net operating income reached $129.9 million, up 11% from the year-ago period. PRI’s Term Life unit benefitted from a significant reduction in COVID-related death claims in 4Q 2022. Also, overall claims in the most recent quarter were favorable to historic trends.
In 4Q 2022, PRI repurchased $32.0 million of its own stock, bring 2022 buybacks to $356.3 million and completing the Board’s prior authorization. In November, PRI’s Board set a $375 million stock buyback target for 2023.
Nature’s Sunshine Products, Inc. (NASDAQ: NATR) gained 2.7% in February. This increase, when coupled with a 26.9% jump in January, brought NATR’s YTD appreciation to 30.3%. Since the establishment of the DSCI three years ago, NATR, which markets and distributes nutritional and personal care products in more than 40 countries, has slightly underperformed the direct selling index and outperformed the Dow Jones Industrials Average.
In early November, NATR reported 3Q 2022 net sales and adjusted EBITDA of $104.5 million and $6.8 million versus $114.7 million and $12.9 million, respectively, in the year-ago period. While down from 3Q 2021 results, NATR’s solid 3Q 2022 results show the company surmounted significant inflation and volatile foreign exchange movements during the quarter. NATR will report its 4Q 2022 earnings on March 15th.
Shares in The Beachbody Company, Inc. (NYSE: BODY), a leading subscription health and wellness company, rose 4.0% in February. Over the first two months of 2023, BODY has moved up 22.8%.
In early November, BODY announced 3Q 2022 revenue and adjusted EBITDA of $165.9 million and negative $6.2 million versus 3Q 2021 levels of $208.1 million and a loss of $43.4 million, respectively. The significant YOY cash flow improvement stemmed from the company’s tight control of its costs even in the face of challenging market dynamics.
On January 9, BODY reiterated its 4Q 2022 revenue projection of $140-$150 million range and said it expects to record a $9 million to $14 million adjusted EBITDA loss in the quarter. The company plans to release 4Q 2022 results on March 14th.
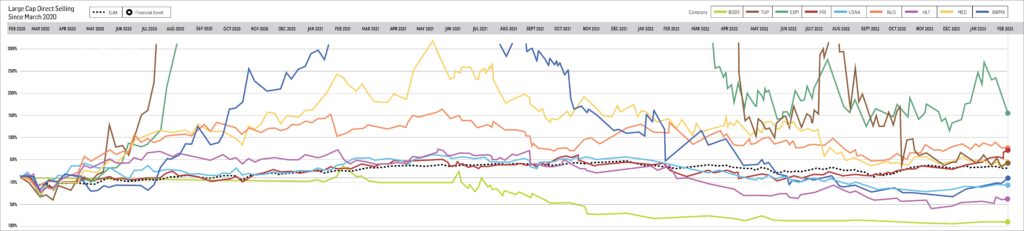
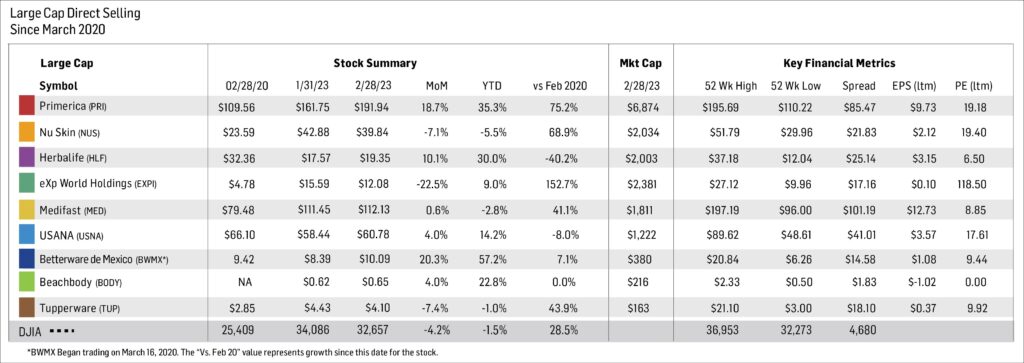
Small Cap
Our small cap tracking set did not perform as well as its large-cap peers in February. Two of the six smaller direct selling stocks rose during the month, three fell, and one was unchanged.
Natural Health Trends Corp. (NASDAQ: NHTC) was the second best performing small cap stock in the DSCI in February. It gained 9.0% during the month and has appreciated a direct selling index-beating 48.4% YTD and 68.6% since the index was established three years ago. NHTC, a direct selling company that markets premium quality personal care, wellness and “quality of life” products, reported revenue of $12.5 million and $0.02 in diluted EPS in 4Q 2022 versus $16.1 million and $0.02, respectively, in the year-ago period.
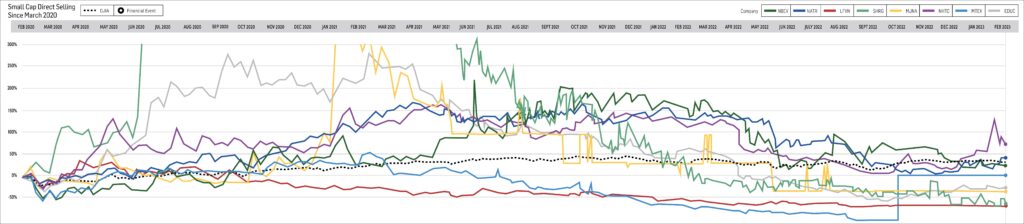
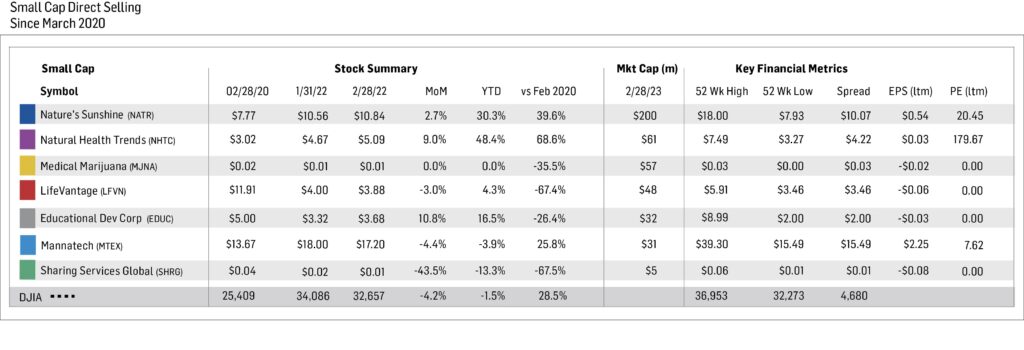
Short Interest Data & Analysis
The following chart is an aggregate index of “days to cover” among the entire tracking set. Days to cover (DTC) is a measurement determined by dividing the total outstanding short interest by average daily trading volume.
As indicated in the chart above, short interest in DSCI stocks was 6.7 days in mid-February, about flat compared with 6.6 days at the end of January, but up dramatically from 4.6 days in mid-January. The 4.6 DTC reading was the lowest since a similar reading in mid-January 2022.
The biggest absolute increase in DTC from mid-January to mid-February for a DSCI component was MED’s jump to 13.2 days from 4.0 days. With the increase in mid-February 2023 DTC levels, aggregate DSCI “days-to-cover” have approximately tripled since bottoming in mid-February 2021.
Short interest can be a difficult indicator to analyze. On the one hand, an increase in short interest can be a bearish sign in that it indicates an increased view among investors that a stock is likely to decline based on any number of factors, such as a belief that the company’s fundamentals are deteriorating or that it has run too far, too fast. On the other hand, as a stock moves higher, a significant short interest can serve as extra fuel on the fire as investors scramble to “buy to cover” their short positions and mitigate losses.
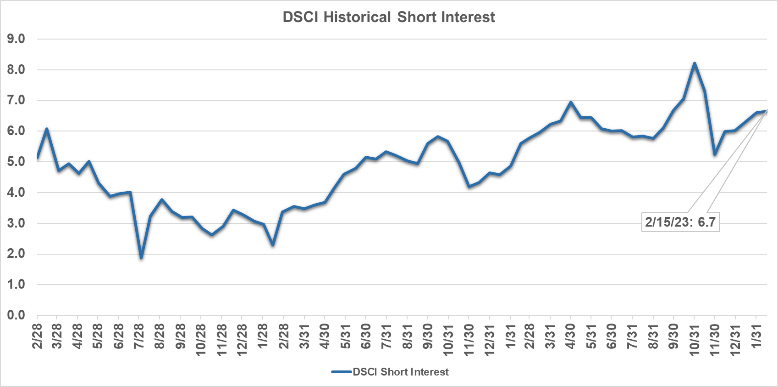
Analyst Sentiment Index
Our Analyst Sentiment Index jumped in February to all-time highs. During the month, the proportion of sell-side analysts maintaining “buy” and “hold” ratings on industry stocks was nearly 100%, up from about 90% in January. Conversely, the percentage of stocks which analysts recommend selling was approximately nil in February.
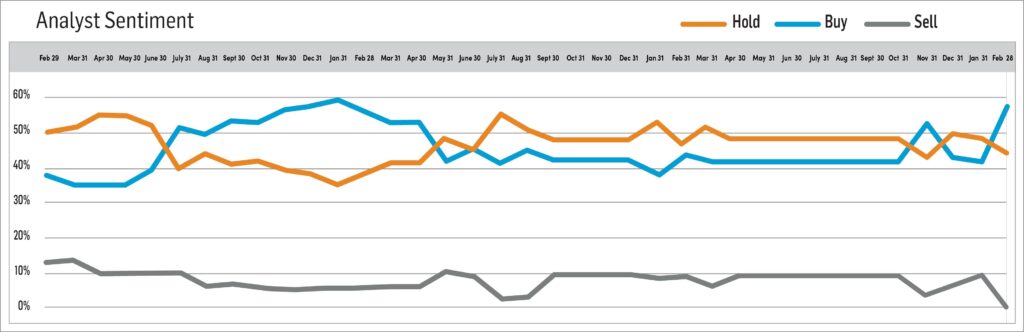
-
January 2023
Brought to you by Direct Selling Capital Advisors
Direct Selling Index Soars 10.2% in January, Dramatically Outperforming the DJIA During the Month
The Direct Selling Capital Advisors Direct Selling Index (DSCI) soared 10.2% in January, handily outpacing the Dow Jones Industrials which gained 2.8% during the month. The DSCI posted its best monthly performance since October 2022 when it rose 12.5%.
Almost all direct selling stocks participated in the rally in January. Nine of the ten large-cap components rose, six by double-digit percentages points. A seventh increased 9.8%. Similarly, five of the six small-cap DSCI members gained ground during the month, two by more than 10%. The other small-cap member was unchanged.
From a longer-term perspective, the DSCI has gained an aggregate 32.3% since its March 1, 2020 inception. This nearly matches the performance of the DJIA which has appreciated 34.1% since that date.
The solid performance of the DJIA in January masked even more robust gains in areas linked to technology and consumer spending, including stocks in direct selling, travel, auto and entertainment and media. Investors in these names enthusiastically greeted news that inflation as measured by the consumer price index (CPI) cooled for the sixth consecutive month in December. The CPI increased 6.5% over the twelve months ended December 2022 versus 7.1% for the twelve months ended November 2022.
This, together with a Goldilocks-type GDP report for 4Q 2022 (2.9% annualized growth; not too hot, not too cold) has prompted investors to expect a slower pace of interest rate hikes from the Federal Reserve and possibly even a rate cut by the end of 2023.
On February 1, the Fed increased overnight interest rates by 25 basis points to a range of 4.5% to 4.75%. At his press conference after the Fed meeting, Chairman Powell seemed to acknowledge that the rate-setting body was approaching the end of its tightening cycle.
Looking Forward
Most of the direct selling stocks will report their 4Q 2022 earnings in February 2023. Perhaps even more important, many will provide sales and earnings guidance for 2023. The details and trends in those reports will significantly impact investor sentiment, which, as noted above, was decidedly optimistic in January.
In early January, USANA Health Sciences, Inc. (NYSE: USNA) reported preliminary 2022 results and provided lukewarm guidance for 2023. The company cited macroeconomic uncertainties in China and other Asia Pacific countries, and foreign exchange headwinds as key reasons that sales and earnings could be lower in 2023 compared with 2022. The stock market accepted that news well as USANA rose nearly 10% in January, but if several other direct selling companies anticipate similar downturns in 2023, the degree of investor optimism could be tested.
Investors will likewise pay close attention to the February 14 release of CPI data for the twelve months ended January 31, 2023. Further tempering of inflation, particularly core inflation excluding food and energy, is necessary for equity markets to continue to perform well over both the short and intermediate terms. The next scheduled meeting of the Federal Open Market Committee (FOMC) happens March 21-22.
CHARTS & ANALYSIS
Direct Selling Capital Advisors Index
The DSCI is a market capitalization weighted index of all domestic public direct selling companies with a market capitalization of at least $25 million. The index is rebalanced monthly, and no single issue is permitted to represent more than 20% of its total value. In such an event, the excess weighting would be redistributed among the other index components.
The DSCI rose in January and outperformed the DJIA during the month. The DSCI gained 10.2% in the month, nearly four times the DJIA’s 2.8% increase. DSCI data is tracked back to March 1, 2020. The direct selling index has risen 32.3% since that date versus a 34.1% gain for the DJIA. At its peak in June 2021, the DSCI had risen 115.6% since inception.
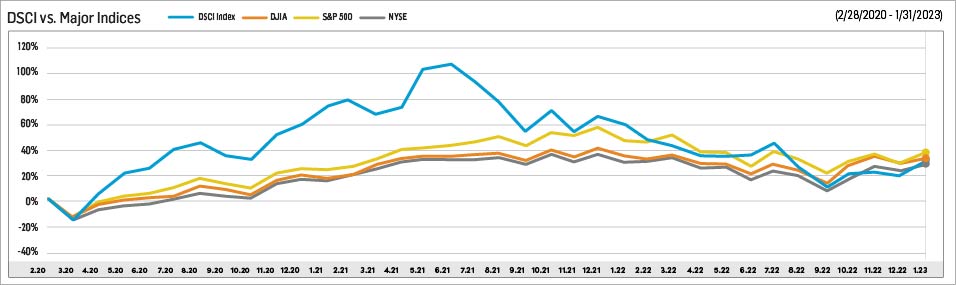
Large Cap
Betterware de Mexico (NASDAQ: BWMX) soared 30.7% in January, making it the second best performing large cap DSCI component during the month. BWMX’s January 2023 gain, which was its best monthly performance since September 2020, cut its losses since DSCI inception to 10.9%.
A softer-than-expected economic environment marked by weak consumer spending and high inflation rates in Mexico adversely impacted 3Q 2022 financial results, causing net revenue and EBITDA to decline 37% and 62%, respectively, from the year-ago period. BWMX management believes the company is positioned to resume top-line growth and return to profitability in 2023 due to stabilization of its salesforce and the benefits from its business restructuring. BWMX is on track to begin operations in the U.S. late this year.
BWMX began trading in March 2020 after the company’s merger with SPAC sponsor DD3 Acquisition Corp. BWMX specifically targets the Mexican market; it serves three million households through distributors and associates in approximately 800 communities throughout Mexico.
Tupperware Brands Corporation (NYSE: TUP) rose 7.0% in January, breaking a two-month string of double-digit percentage declines. TUP has gained 55.4% since the direct selling index was established 35 months ago.
In early November 2022, TUP reported 3Q 2022 net sales and adjusted diluted earnings of $302.8 million and $0.14 per share, down 20% and 88%, respectively, from the year-ago period. TUP experienced decelerating revenue trends in the Asia Pacific and North American regions, and continuing declines in Europe. The company plans to announce 4Q 2022 results on March 1, 2023.
In late December 2022, TUP announced it had reached agreement with its creditors to amend the terms of its credit agreement. The amount that can now be borrowed was cut slightly to $435 million from $450 million. In addition, TUP’s maximum permitted Consolidated Net Leverage Ratio for 1Q 2023 and beyond was reduced markedly, and the maturity date for the credit accord was moved up a year to November 23, 2025.
Nu Skin Enterprises, Inc. (NYSE: NUS) inched 1.7% higher in January. While a positive result, the January performance broke a two-month skein when NUS led all large-cap DSCI members. From the March 2020 establishment of the DSCI, NUS has gained 81.8%, significantly outperforming both the direct selling stock index (+32.3%) and the Dow Jones Industrial Average (+34.1%).
NUS reported 3Q 2022 revenue and adjusted EPS of $537.8 million and $0.47, down from $641.2 million and $0.97, respectively, in the year-ago quarter. Prolonged COVID-related disruptions in Mainland China, an economic slowdown in South Korea, persistent global inflation and the strong U.S. dollar all negatively affected NUS’ third quarter results. NUS will report its 4Q 2022 earnings on February 15, 2023.
Herbalife Nutrition, Inc. (NYSE: HLF) jumped 18.1% in January, approximately reversing a 15.1% decline in December 2022. Since the March 2020 establishment of the DSCI, HLF has lost 45.7%, making it the worst performing DSCI large cap stock which has traded continuously since index inception.
In late October, HLF reported 3Q 2022 net sales of $1.3 billion, down 9.5% from $1.43 billion in 3Q 2021. Third quarter adjusted diluted EPS was $0.91, a notable downtick from $1.21 in the year-ago period. HLF will release its 4Q 2022 results on February 14, 2023.
Just before year-end 2022, Michael Johnson agreed to be CEO of HLF. In late October, the company renamed him as its chairman and interim CEO. Mr. Johnson served as HLF’s chairman from 2007 to early 2020 and as its CEO from 2003 to 2017 and from 2019 to early 2020. During Mr. Johnson’s first tenure as CEO, HLF quadrupled its sales.
Medifast, Inc. (NYSE: MED), declined 3.4% in January; it was the only DSCI component to fall during the month. This performance followed an 8.5% drop in December 2022. More constructively, since the March 1, 2020 establishment of the DSCI, the stock has gained 40.2%. MED’s annual dividend rate is $6.56 per share, making its dividend yield an attractive 5.7%.
In early November, MED announced 3Q 2022 revenue of $390.4 million, 5.5% below 3Q 2021 sales of $413.4 million. The company’s adjusted diluted EPS likewise declined to $3.32 from $3.56 in the year-ago period. MED now projects full-year 2022 revenue and adjusted diluted EPS of $1.51-$1.59 billion and $11.61-$13.05, respectively.
USANA Health Sciences, Inc. (NYSE: USNA) gained 9.8% in January. Since the March 2020 inception of the DSCI, USANA shares have declined 11.6% compared with gains in both the direct selling index and the DJIA.
On January 5, USANA announced preliminary full-year 2022 results; the company expects to report annual net sales and diluted EPS of $995 million and $3.65, respectively. These figures exceeded the top ends of guidance ranges management issued when the company reported 3Q 2022 results ($955-$975 million of net sales and EPS $3.15 to $3.40). Incremental sales of certain products in mainland China over the last two weeks of 2022 following the country’s unanticipated shift in COVID policy boosted 4Q 2022 results. USANA had approximately 490,000 total active customers as of December 31, 2022.
USANA also released 2023 net sales and diluted EPS guidance of $850 to $950 million and $2.35-$3.30, respectively. Reasons that both measures should be lower in 2023 than 2022 include a lower beginning active customer base, ongoing uncertainty in mainland China and other Asia Pacific markets, and an estimated $30 million unfavorable currency exchange rate impact on net sales. USANA will release detailed 4Q 2022 earnings results on February 7, 2023.
eXp World Holdings, Inc. (NASDAQ: EXPI), the DSCI’s best performer since its March 2020 establishment and the index’s second largest member by stock market capitalization, soared 40.7% in January. EXPI has gained 226.2% over the last 35 months.
EXPI, the fastest growing real estate brokerage in the world, reported 3Q 2022 revenue of $1.2 billion, up 12% from 3Q 2021 and gross profit of $93.1 million, up 17% from the prior-year period. EXPI’s real estate transaction volume in 3Q 2022 was $50.4 billion, 8% greater than in 3Q 2021.
In December, EXPI announced an expansion into Dubai. EXPI now operates in 24 countries across the globe and employs more than 86,000 agents.
A leading provider of financial services in the U.S. and Canada, and the largest market cap stock in the DSCI, Primerica, Inc. (NYSE: PRI) rose 14.1% in January. PRI has gained 47.6% since the March 2020 establishment of the DSCI.
In early November, PRI reported 3Q 2022 revenue and adjusted operating EPS of $673.3 million and $3.02 versus $693.2 million and $2.98, respectively, in 3Q 2021. Market volatility in the quarter led to a substantial decline in client asset values and lower sales volumes in PRI’s Investment and Savings Product segment. PRI will report 4Q 2022 results on February 23, 2023.
Nature’s Sunshine Products, Inc. (NASDAQ: NATR) jumped 26.9% in January. Since the establishment of the DSCI nearly three years ago, NATR, which markets and distributes nutritional and personal care products in more than 40 countries, has slightly outperformed (+36.0%) both the direct selling index (+32.3%) and the Dow Jones Industrials Average (+34.1%).
In early November, NATR reported 3Q 2022 net sales and adjusted EBITDA of $104.5 million and $6.8 million versus $114.7 million and $12.9 million, respectively, in the year-ago period. While down from 3Q 2021 results, NATR’s solid 3Q 2022 results show the company surmounted significant inflation and volatile foreign exchange movements during the quarter.
Shares in The Beachbody Company, Inc. (NYSE: BODY), a leading subscription health and wellness company, gained 18.1% in January. This performance nearly reversed a 24.9% loss in December 2022.
In early November, BODY announced 3Q 2022 revenue and adjusted EBITDA of $165.9 million and negative $6.2 million versus 3Q 2021 levels of $208.1 million and a loss of $43.4 million, respectively. The significant YOY cash flow improvement stemmed from the company’s tight control of its costs even in the face of challenging market dynamics.
BODY projects 4Q 2022 revenue to be in the $140-$150 million range and expects to record a $9 million to $14 million 4Q 2022 adjusted EBITDA loss. The company reiterated that guidance on January 9.
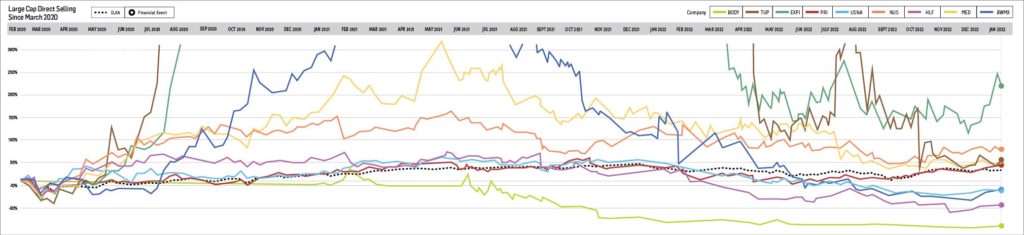
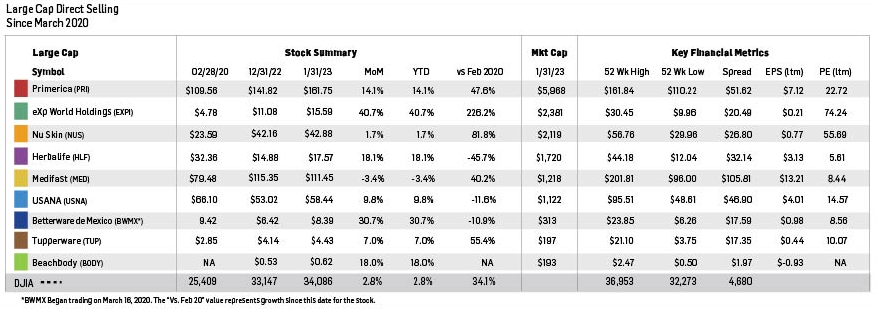
Note: For the purposes of this report, Direct Selling Capital considers companies with a market capitalization in excess of $1 billion “Large Cap.”
Small Cap
Our small cap tracking set rose in January, albeit at a somewhat slow pace, on average, versus its large-cap peers. Five of the six smaller direct selling stocks rose during the month, and another was unchanged.
Natural Health Trends Corp. (NASDAQ: NHTC) was the second best performing small cap stock in the DSCI in January. It gained 36.2% during the month and has appreciated 54.7% since the index was established 35 months ago. NHTC, a direct selling company that markets premium quality personal care, wellness and “quality of life” products, reported revenue of $11.7 million and breakeven earnings per share in 3Q 2022 versus $14.3 million and $0.04, respectively, in the year-ago period. NHTC will report its 4Q 2022 earnings on February 8, 2023.
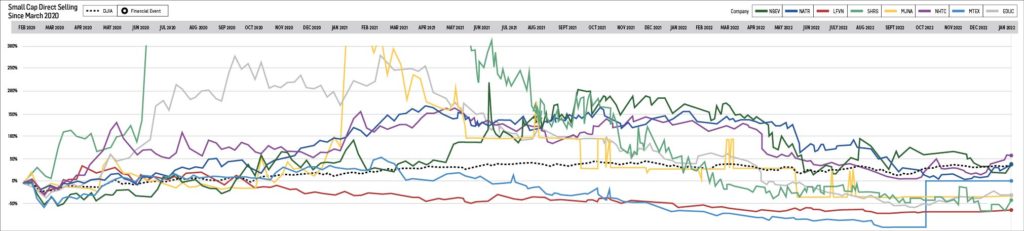
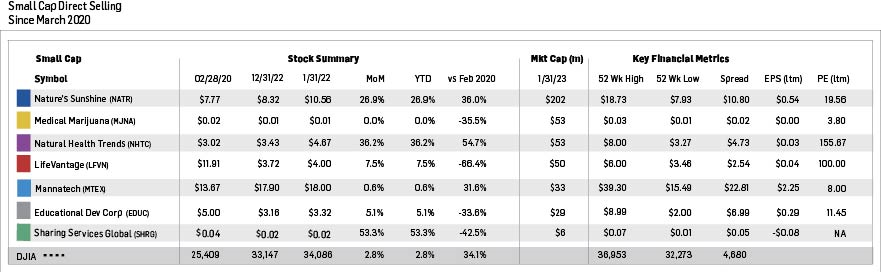
Short Interest Data & Analysis
The following chart is an aggregate index of “days to cover” among the entire tracking set. Days to cover (DTC) is a measurement determined by dividing the total outstanding short interest by average daily trading volume.
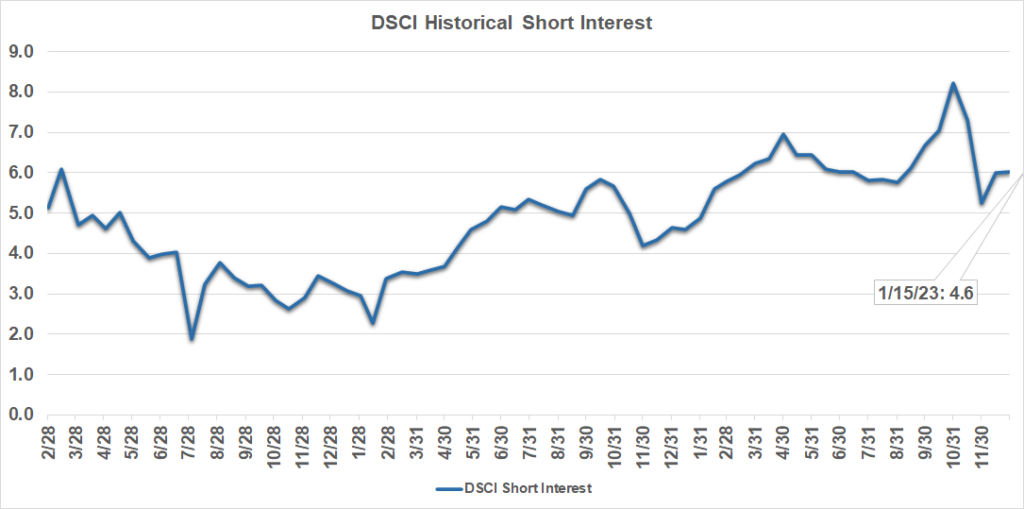
As indicated in the chart above, short interest in DSCI stocks was 4.6 days in mid-January, down significantly from 6.0 days as of both mid-December and the end of December. This 4.6 DTC reading was the lowest since a similar reading in mid-January 2022. The biggest absolute decrease in DTC from late December to mid-January for a DSCI component was EXPI’s marked decline to 4.7 days from 13.6 days. Despite the notable drop in mid-January 2023 from December levels, aggregate DSCI “days-to-cover” have approximately doubled since bottoming in mid-February 2021.
Short interest can be a difficult indicator to analyze. On the one hand, an increase in short interest can be a bearish sign in that it indicates an increased view among investors that a stock is likely to decline based on any number of factors, such as a belief that the company’s fundamentals are deteriorating or that it has run too far, too fast. On the other hand, as a stock moves higher, a significant short interest can serve as extra fuel on the fire as investors scramble to “buy to cover” their short positions and mitigate losses.
Analyst Sentiment Index
Our Analyst Sentiment Index declined in January but remains at elevated levels. During the month, the proportion of sell-side analysts maintaining “buy” and “hold” ratings on industry stocks was about 90% versus 92% in December. Conversely, the percentage of stocks which analysts recommend selling equaled just 10% in January.
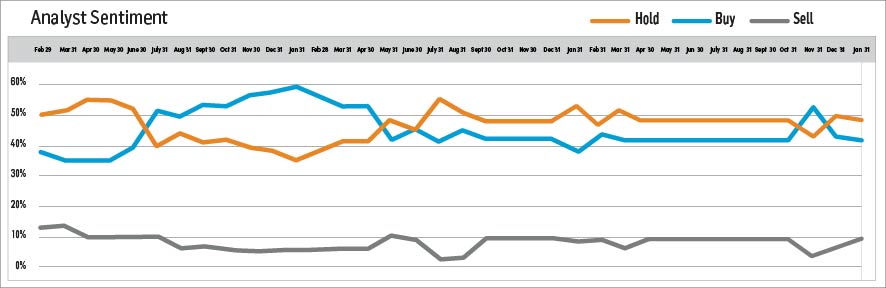
Methodology: The DSCA Analyst Sentiment Index is a consensus tracking tool that aggregates and averages the recommendations of all covering analysts across all public direct selling companies.
-
December 2022
Brought to you by Direct Selling Capital Advisors
Direct Selling Index Declines 3.3% in December but Outperforms DJIA During the Month
The Direct Selling Capital Advisors Direct Selling Index (DSCI) declined 3.3% in December, breaking a two-month string of gains (+2.4% in November and +12.5% in October). Nevertheless, the DSCI outperformed the Dow Jones Industrial Average (DJIA) in December, as the DJIA dropped 4.2% during the month.
Both large cap and small cap DSCI components generally trended down in December. Eight of the nine large caps fell during the month, four by more than 10%. Similarly, five of the seven small caps lost value in December, three by double-digit percentage points.
From a longer-term perspective, the DSCI fell 29.8% over the full-year 2022, a wider loss than the 8.8% decline of the DJIA. The direct selling index has gained an aggregate 20.1% since its March 1, 2020 inception. However, the DSCI has moderately underperformed the DJIA since that time. The DJIA has risen 30.5% since March 1, 2020.
The key driver for the December performance of both the DJIA and the DSCI was not only the Federal Reserve’s decision to raise overnight interest rates by an additional 50 basis points mid-month, but also (and more importantly) the content of the Federal Open Market Committee (FOMC) policy statement released in conjunction with the rate hike. The Fed reiterated plans to continue raising rates through 2023 and does not expect to cut rates again until 2024.
Many stock market investors had hoped that after relatively constructive inflation data released in November and December (before the Fed action), the Fed would consider “pivoting” to a more accommodative stance sometime in 2023. The DJIA had risen nearly 6% in November and a resounding 14% in October partly on hopes of such a change in Fed policy, and it gave back some of those gains in December when those rosy expectations had to be tempered.
DSCI stocks were pressured throughout 2022 by a 33% drop in the risky, technology-laden NASDAQ index in 2022, its largest percentage drop since 2008. While direct selling stocks are not technology stocks, they carry an element of risk and their trading patterns can be negatively affected by poor performances of the riskiest stocks in the market. The NASDAQ fell 8.7% in December.
Looking Forward
Investors are faced with conflicting signals at the start of 2023. On the one hand, many economists believe an economic downturn is inevitable, and, in such a scenario, corporate earnings could prove to be lower than forecasted and stocks could struggle to perform well. On the other hand, and as previously noted, inflation does appear to be cooling and further progress on the inflation front could form the backdrop for improving equity markets. Plus, it is possible that the Fed could achieve its admittedly difficult-to-achieve soft landing goal.
DSCI component stocks are likely to trade in line with broad stock market trends in January, as 4Q 2022 earnings are not expected to begin to be released until early February. No Federal Reserve meeting is scheduled during January, but the central bank’s February 1 rate decision and accompanying rhetoric will doubtless have a significant impact on February stock market performance.
CHARTS & ANALYSIS
Direct Selling Capital Advisors Index
The DSCI is a market capitalization weighted index of all domestic public direct selling companies with a market capitalization of at least $25 million. The index is rebalanced monthly, and no single issue is permitted to represent more than 20% of its total value. In such an event, the excess weighting would be redistributed among the other index components.
The DSCI rose in December and outperformed the DJIA during the month. The DSCI lost 3.3% in December while the DJIA fell 4.2%. Over the full-year 2022, the direct selling index and the DJIA fell 29.8% and 8.8%, respectively. DSCI data is tracked back to March 1, 2020. The direct selling index has risen 20.1% since that date versus a 30.5% gain for the DJIA. At its peak in June 2021, the DSCI had risen 115.6% since inception.
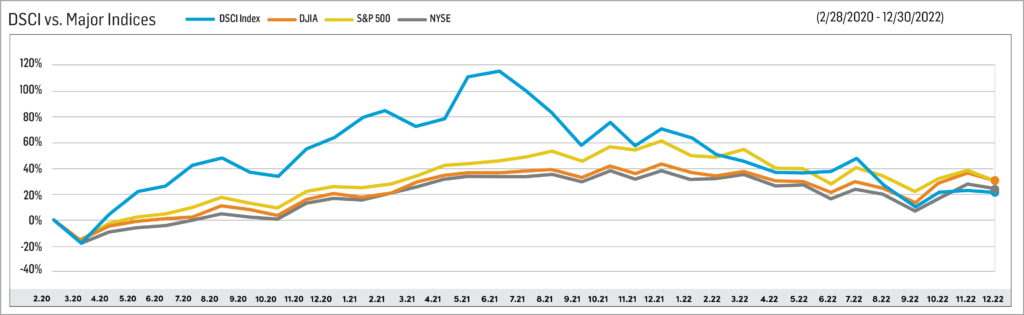
Large Cap
In December, Betterware de Mexico (NASDAQ: BWMX) stock dropped 5.4%, bringing its full-year 2022 loss to 69.4%. It has depreciated 31.8% since DSCI index inception. A softer-than-expected economic environment marked by weak consumer spending and high inflation rates in Mexico adversely impacted 3Q 2022 financial results, causing net revenue and EBITDA to decline 37% and 62%, respectively, from the year-ago period.
BWMX management believes the company is positioned to resume top-line growth and return to profitability in 2023 due to stabilization of its sales force and the benefits from its business restructuring. BWMX is on track to begin operations in the U.S. late this year.
BWMX began trading in March 2020 after the company’s merger with SPAC sponsor DD3 Acquisition Corp. BWMX specifically targets the Mexican market; it serves three million households through distributors and associates in approximately 800 communities throughout Mexico.
Tupperware Brands Corporation (NYSE: TUP) declined 10.6% in December which represented its second successive double-digit monthly percentage loss (minus 40.1% in November). In 2022, the stock has lost 72.9% of its value, making it the second worst performing large cap DSCI component during the year. Still and quite remarkably, TUP has gained 45.3% over the last 34 months.
In early November, TUP reported 3Q 2022 net sales and adjusted diluted earnings of $302.8 million and $0.14 per share, down 20% and 88%, respectively, from the year-ago period. TUP experienced decelerating revenue trends in the Asia Pacific and North American regions, and continuing declines in Europe.
On December 22, TUP announced it had reached agreement with its creditors to amend the terms of its credit agreement. The amount that can now be borrowed was cut slightly to $435 million from $450 million, TUP’s maximum permitted Consolidated Net Leverage Ratio for 1Q 2023 and beyond was reduced markedly, and the maturity date for the credit accord was moved up a year to November 23, 2025. In September, TUP had announced it would likely be unable to maintain compliance with terms of the original credit agreement over the next twelve months.
Nu Skin Enterprises, Inc. (NYSE: NUS) was the only gainer among the DSCI large caps in December (+1.1%) as it led all large-cap DSCI members for the second consecutive month. NUS jumped 9.2% in November. The stock declined 16.9% in the full-year 2022, but since the March 2020 establishment of the DSCI, NUS has gained 78.7%, significantly outperforming both the direct selling stock index (+20.1%) and the Dow Jones Industrial Average (+30.5%).
NUS reported 3Q 2022 revenue and adjusted EPS of $537.8 million and $0.47, down from $641.2 million and $0.97, respectively, in the year-ago quarter. Prolonged COVID-related disruptions in Mainland China; an economic slowdown in South Korea; persistent global inflation; and the strong U.S. dollar all negatively affected NUS’ third quarter results.
Herbalife Nutrition, Inc. (NYSE: HLF) dropped 15.1% in December, bringing its full-year 2022 loss to 63.6%. Since the March 2020 establishment of the DSCI, HLF has lost 54.0%, making it the worst performing DSCI large cap stock which has traded continuously since index inception 34 months ago.
In late October, HLF reported 3Q 2022 net sales of $1.3 billion, down 9.5% from $1.43 billion in 3Q 2021. Third quarter adjusted diluted EPS was $0.91, a notable downtick from $1.21 in the year-ago period.
On December 27, Michael Johnson agreed to be CEO of HLF. In late October, the company renamed him as its chairman and interim CEO. He replaced John Agwunobi in those roles. Mr. Johnson served as HLF’s chairman from 2007 to early 2020, and its CEO from 2003 to 2017 and from 2019 to early 2020. During Mr. Johnson’s first tenure as CEO, HLF quadrupled its sales.
On December 7, HLF sold $250 million of convertible senior notes with a 4.25% interest rate and a maturity date of June 15, 2028. The conversion price of the notes is approximately $16.98 per share. Most of the proceeds from this offering will be used to repurchase its existing 2.625% convertible senior notes due 2024 in privately negotiated transactions.
Medifast, Inc. (NYSE: MED) declined 8.5% in December, approximately reversing its 7.7% gain in November. MED stock dropped 44.9% in the full-year 2022. More constructively, since the March 1, 2020 establishment of the DSCI, the stock has gained 45.1%, outperforming both the direct selling stock index and the Dow Jones Industrials over that period. MED’s annual dividend rate is $6.56 per share, making its dividend yield a very attractive 5.5%.
In early November, NUS announced 3Q 2022 revenue of $390.4 million, 5.5% below 3Q 2021 sales of $413.4 million. The company’s adjusted diluted EPS likewise declined to $3.32 from $3.56 in the year-ago period. MED now projects full-year 2022 revenue and adjusted diluted EPS of $1.51-$1.59 billion and $11.61-$13.05, respectively.
USANA Health Sciences, Inc. (NYSE: USNA) declined 3.3% in December, making it the second best performing large cap DSCI component during the month. The December performance brought USNA’s full-year 2022 loss to 47.4%. Since the March 2020 inception of the DSCI, USANA shares have declined 19.5% compared with gains in both the direct selling index and the DJIA.
In late October, USANA reported 3Q 2022 net sales of $233 million, 15% below 3Q 2021 revenue of $274 million. The company’s 3Q 2022 diluted EPS was $0.78 versus $1.36 in the year-ago period.
In late November, USANA announced that it had acquired two health and wellness companies, Rise Bar and Oola. Rise Bar manufactures and sells high-quality protein bars. Oola is a direct selling company that offers a step-by-step personal development framework.
eXp World Holdings, Inc. (NASDAQ: EXPI), the DSCI’s best performer since its March 2020 establishment, and the index’s third largest member by stock market capitalization, fell 15.2% in December. This drop brought EXPI’s full-year 2022 loss to 67.1%. Despite this significant correction in 2022, EXPI has rallied 131.8% since March 1, 2020.
EXPI, the fastest growing real estate brokerage in the world, reported 3Q 2022 revenue of $1.2 billion, up 12% from 3Q 2021, and gross profit of $93.1 million, up 17% from the prior-year period. EXPI’s real estate transaction volume in 3Q 2022 was $50.4 billion, 8% more than in 3Q 2021.
On December 21, EXPI announced an expansion into Dubai. EXPI now operates in 24 countries across the globe and employs more than 86,000 agents.
A leading provider of financial services in the U.S. and Canada, and the largest market cap stock in the DSCI, Primerica, Inc. (NYSE: PRI) fell 4.8% in December. PRI’s full-year 2022 loss of 7.5% makes it the best performing DSCI member, large cap or small cap, during the year. PRI has gained 29.4% since the March 2020 establishment of the DSCI.
On November 8, PRI reported 3Q 2022 revenue and adjusted operating EPS of $673.3 million and $3.02 versus $693.2 million and $2.98, respectively, in 3Q 2021. Market volatility in the quarter led to a substantial decline in client asset values and lower sales volumes in PRI’s Investment and Savings Product segment.
The company repurchased $97.4 million of its shares in 3Q 2022, bringing its YTD total to $324.3 million. An additional $32 million was expected to be repurchased in 4Q 2022. In addition, PRI’s Board has authorized $375 million of stock buybacks for the full-year 2023.
The Beachbody Company, Inc. (NYSE: BODY) stock was the worst performer among DSCI large-cap members in December, losing 24.9%. BODY, a leading subscription health and wellness company, lost 77.8% of its value in 2022.
On November 9, BODY announced 3Q 2022 revenue and adjusted EBITDA of $165.9 million and negative $6.2 million versus 3Q 2021 levels of $208.1 million and a loss of $43.4 million, respectively. The significant YOY cash flow improvement stemmed from the company’s tight control of its costs even in the face of challenging market dynamics.
BODY projects 4Q 2022 revenue to be in the $140-$150 million range and expects to record a $9 million to $14 million 4Q 2022 adjusted EBITDA loss.
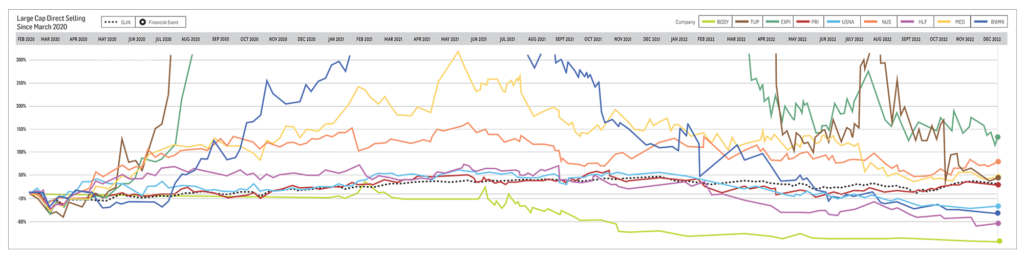
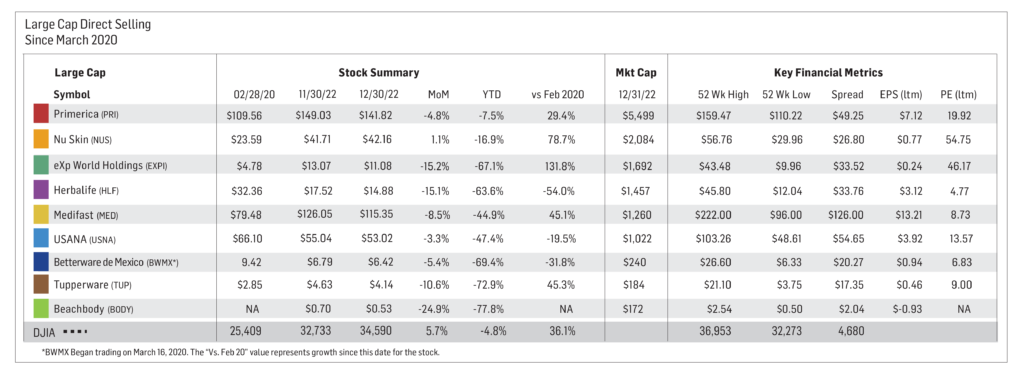
Small Cap
Our small cap tracking set declined in December and generally tracked its large-cap peers during the month. Only one small cap rose during December (see just below); five declined; and another was unchanged.
Education Development Corporation (NASDAQ: EDUC), the best performing small cap stock in the direct selling index in each of the last two months, rose 6.0% during December. This followed a 19.2% jump in November. EDUC, a publishing company specializing in books for children, declined 65.1% and 36.8% in the full-year 2022 and since DSCI inception, respectively. The company announced 2Q FY2023 (fiscal year 2023 ends February 2023) net revenue and pretax earnings of $19.4 million and a loss of $1.1 million versus $33.0 million and a gain of $2.7 million, respectively, in the year-ago period.
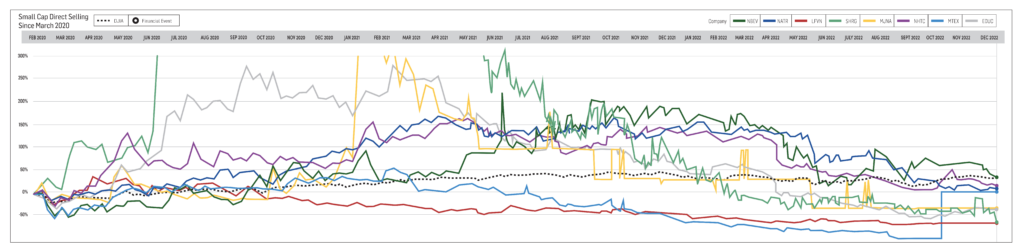
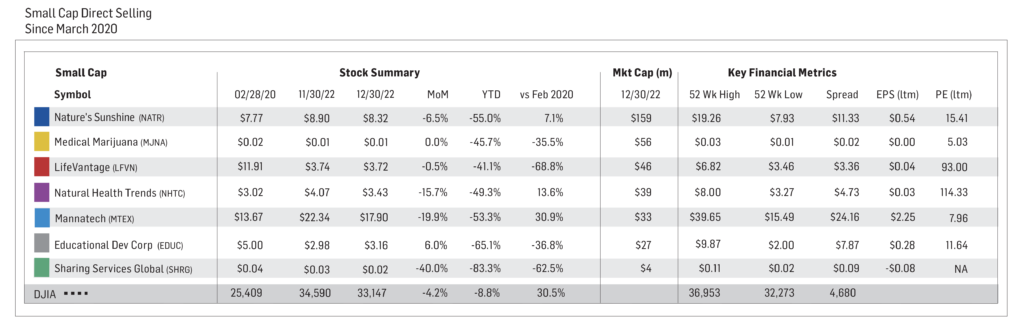
Short Interest Data & Analysis
The following chart is an aggregate index of “days to cover” among the entire tracking set. Days To Cover (DTC) is a measurement determined by dividing the total outstanding short interest by average daily trading volume.
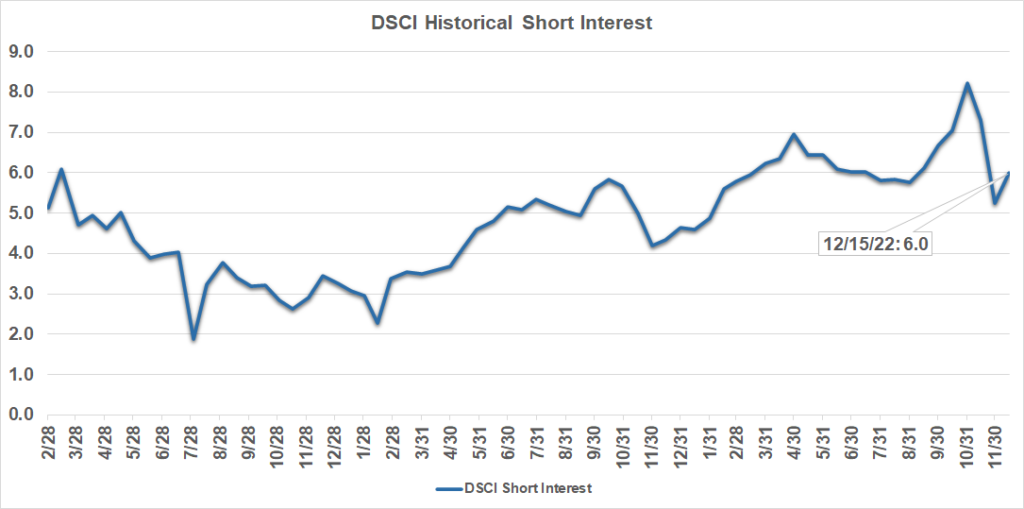
As indicated in the chart above, short interest in DSCI stocks was 6.0 days as of mid-December, down significantly from 7.3 days as of mid-November, but up from 5.2 days as of the end of November. That 5.2 DTC reading was the lowest since a 4.9-day mark at the end of January 2022. The biggest absolute increase in DTC from late November to mid-December for a DSCI component was HLF’s more than doubling to 6.5 days from 3.2 days. Aggregate days-to-cover have approximately tripled since bottoming in mid-February 2021.
Short interest can be a difficult indicator to analyze. On the one hand, an increase in short interest can be a bearish sign in that it indicates an increased view among investors that a stock is likely to decline based on any number of factors, such as a belief that the company’s fundamentals are deteriorating or that it has run too far, too fast. On the other hand, as a stock moves higher, a significant short interest can serve as extra fuel on the fire as investors scramble to “buy to cover” their short positions and mitigate losses.
Analyst Sentiment Index
Our Analyst Sentiment Index declined in December but remains at elevated levels. During the month, the proportion of sell-side analysts maintaining “buy” and “hold” ratings on industry stocks was about 92%, down from 95% in November. Conversely, the percentage of stocks which analysts recommend selling equaled just 8% in December.
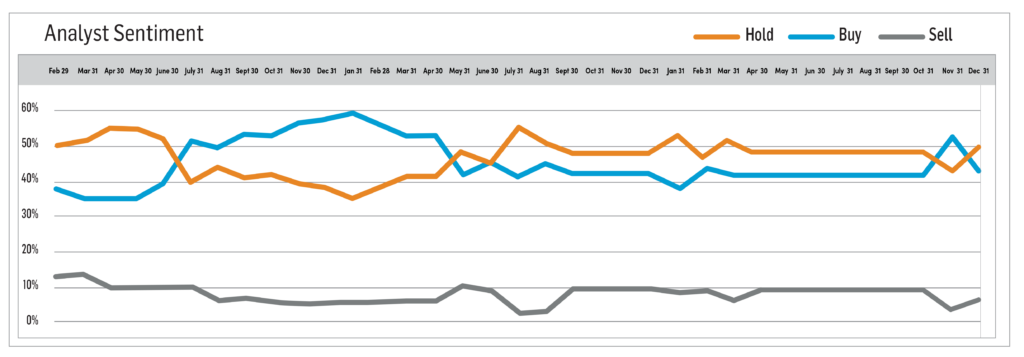
Methodology: The DSCA Analyst Sentiment Index is a consensus tracking tool that aggregates and averages the recommendations of all covering analysts across all public direct selling companies.
-
November 2022
Brought to you by Direct Selling Capital Advisors
Direct Selling Index Rises 2.4% in November—Its Second Consecutive Monthly Gain
In November, the Direct Selling Capital Advisors Direct Selling Index (DSCI) rose 2.4%, building upon its 12.5% gain in October. The Dow Jones Industrial Average (DJIA) also moved higher in November, rising 5.7% during the month.
Small cap DSCI components outperformed the larger direct selling companies in November. Five of the seven small cap members rose, two by more than 10%, and only one declined. One small cap was unchanged over the 30-day period. In comparison, four large cap members gained during November, while five fell, three by more than double-digit percentage points.
From a longer-term perspective, the DSCI fell 27.4% over the first eleven months of 2022, a wider loss than the 4.8% decline of the DJIA over the same period. The direct selling index has gained an aggregate 24.2% since its March 1, 2020, inception. However, the DSCI has moderately underperformed the DJIA since that time. The DJIA has increased 36.1% since March 1, 2020.
In November, investors were buoyed by a constructive Consumer Price Index (CPI) release, indications that the Federal Reserve will slow what has been a historic pace of rate hikes, and, late in the month, by signals from China that it would ease COVID restrictions for its citizens. Such an action could help alleviate lingering supply chain fears in the U.S.
Remarkably, the Dow’s strong performance in October (+14.0%) and November (+5.7%) means the benchmark index has gained more than 20% from its late September lows. Accordingly, the DJIA may now be considered in a bull market.
Interestingly, the broad market has rallied even as the yield spread between the U.S. two-year Treasury note and the U.S. ten-year Treasury bond is the most deeply inverted it has been since the dark economic times of 1981. An inverted yield curve generally suggests investors are worried about the economy’s long-term prospects; they are lending their money out for the long term at rates well below short-term rates.
Looking Forward
A potential sign that direct selling stocks, as a group, could have limited further downside—and perhaps substantial upside—is that the DSCI shook off in November disappointing 3Q 2022 earnings results from several high-profile DSCI members like Tupperware Brands Corporation (NYSE: TUP) and Herbalife Nutrition, Inc. (NYSE: HLF). If the DSCI stocks can show gains as a group in the face of such weak fundamental developments, the stocks may have already discounted the effects of a potential economic downturn in 2023.
As has become customary over the course of this year, investors will pay close attention to the details of the December 13th release of the CPI for the twelve months ended November 2022. The next day, the Federal Reserve is expected to raise short-term interest rates by at least 50 basis points. The Fed’s accompanying commentary that discusses the potential pace and magnitude of future rate increases will significantly impact investor sentiment.
CHARTS & ANALYSIS
Direct Selling Capital Advisors Index
The DSCI is a market capitalization weighted index of all domestic public direct selling companies with a market capitalization of at least $25 million. The index is rebalanced monthly, and no single issue is permitted to represent more than 20% of its total value. In such an event, the excess weighting would be redistributed among the other index components.
The DSCI rose in November but underperformed the DJIA during the month. The DSCI gained 2.4% in November, while the DJIA rose 5.7%. Over the first eleven months of 2022, the direct selling index and the DJIA fell 27.4% and 4.8%, respectively. DSCI data is tracked back to March 1, 2020. The direct selling index has risen 24.2% since that date versus a 36.1% gain for the DJIA. At its peak in June 2021, the DSCI had risen 115.6% since inception.
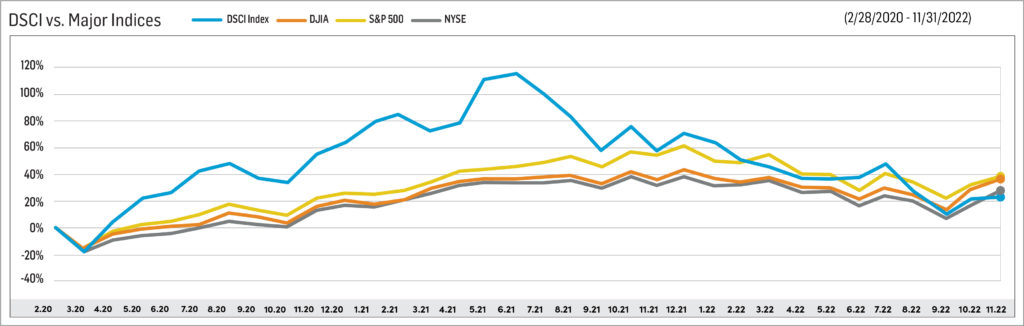
Large Cap
In November, Betterware de Mexico (NASDAQ: BWMX) stock fell 7.0%, bringing its YTD loss to 67.6%. It has lost 22.5% since DSCI index inception. In late October, BWMX announced 3Q 2022 net revenue and EBITDA of 1,490 million and 267 million nominal Mexican pesos, respectively, down 37% and 62% from the year-ago period. A softer-than-expected economic environment marked by weak consumer spending and high inflation rates in Mexico adversely impacted 3Q 2022 financial results.
BWMX management believes the company is positioned to resume top-line growth and return to profitability in 2023 due to stabilization of its sales force and the benefits from its business restructuring. BWMX is on track to begin operations in the U.S. in late 2023.
BWMX began trading in March 2020 after the company’s merger with SPAC sponsor DD3 Acquisition Corp. BWMX specifically targets the Mexican market; it serves three million households through distributors and associates in approximately 800 communities throughout Mexico.
Tupperware Brands Corporation (NYSE: TUP) was the worst performing DSCI component in November, declining 40.1%. Over the first eleven months of 2022, the stock has lost 67.6% of its value. Still, TUP has gained 62.5% over the last 33 months, making it the third best performing large cap index member over that period.
In early November, TUP reported 3Q 2022 net sales and adjusted diluted earnings of $302.8 million and $0.14 per share, down 20% and 88%, respectively, from the year-ago period. TUP experienced decelerating revenue trends in the Asia Pacific and North American regions and continuing declines in Europe.
As of September 24, 2022, the end of TUP’s 3Q 2022, the company was in compliance with the covenants contained in its credit agreement. However, TUP will likely be unable to maintain compliance over the next twelve months. Consequently, the company is currently negotiating with its lenders to amend the terms of the credit accord.
Nu Skin Enterprises, Inc. (NYSE: NUS) led all large-cap DSCI members in November. The shares jumped 9.2% in the month, building on a 14.4% gain in October, and cutting its loss over the first eleven months of 2022 to 17.8%. Since the March 2020 establishment of the DSCI, NUS has gained 76.8%, significantly outperforming both the direct selling stock index (+24.2%) and the Dow Jones Industrial Average (+36.1%).
NUS reported 3Q 2022 revenue and adjusted EPS of $537.8 million and $0.47, down from $641.2 million and $0.97, respectively, in the year-ago quarter. Prolonged COVID-related disruptions in Mainland China, an economic slowdown in South Korea, persistent global inflation, and the strong U.S. dollar all negatively affected NUS’ third quarter results.
Effective December 1, the S&P Dow Jones Indices announced that NUS was being transferred to the S&P SmallCap 600 Index from the S&P MidCap 400 Index.
Herbalife Nutrition, Inc. (NYSE: HLF) fell 17.6% in November. For the first eleven months of 2022, the stock is down 57.2%. Since the March 2020 establishment of the DSCI, HLF has lost 45.9%, making it the worst performing DSCI large cap stock which has traded continuously since index inception 33 months ago.
In late October, HLF reported 3Q 2022 net sales of $1.3 billion, down 9.5% from $1.43 billion in 3Q 2021. Third quarter adjusted diluted EPS was $0.91, a notable downtick from $1.21 in the year-ago period. Inflationary pressures negatively impacted HLF’s results, as did an unfavorable geographic revenue mix and the strength of the U.S. dollar
On the same day as its earnings announcement, the company renamed Michael Johnson as its chairman and interim CEO, replacing John Agwunobi in those roles. No reason was given for Mr. Agwunobi’s departure. HLF plans to name a new CEO in 2023. Mr. Johnson served as HLF’s chairman from 2007 to early 2020, and its CEO from 2003 to 2017 and from 2019 to early 2020.
On December 5, HLF announced plans to offer $250 million of convertible senior notes due 2028. Some of the net proceeds from this offering would be used to repurchase a portion of its existing 2.625% convertible senior notes due 2024 in privately negotiated transactions.
Medifast, Inc. (NYSE: MED) gained 7.7% in October, making it the second best performing large-cap DSCI component during the month. MED’s November increase follows an almost identical 8.0% jump in October. Nevertheless, MED has dropped 39.8% over the first eleven months of 2022. More constructively, since the March 1, 2020, establishment of the DSCI, the stock has gained 58.6%, significantly outperforming both the direct selling stock index and the Dow Jones Industrials over that period.
In early November, NUS announced 3Q 2022 revenue of $390.4 million, 5.5% below 3Q 2021 sales of $413.4 million. The company’s adjusted diluted EPS likewise declined to $3.32 from $3.56 in the year-ago period. MED now projects full-year 2022 revenue and adjusted diluted EPS of $1.51-$1.59 billion and $11.61-$13.05, respectively
USANA Health Sciences, Inc. (NYSE: USNA) increased 4.8% in November, cutting its YTD loss to 45.6%. Since the March 2020 inception of the DSCI, USANA shares have declined 16.7% compared with gains in both the direct selling index and the DJIA.
In late October, USANA reported 3Q 2022 net sales of $233 million, 15% below 3Q 2021 revenue of $274 million. The company’s 3Q 2022 diluted EPS was $0.78 versus $1.36 in the year-ago period. A challenging operating environment in the Asia Pacific region, coupled with an appreciating U.S. dollar, significantly impacted 3Q 2022 results.
On November 28, USANA announced that it had acquired two health and wellness companies, Rise Bar and Oola. Rise Bar manufactures and sells high-quality protein bars. Oola is a direct selling company that offers a step-by-step personal development framework.
eXp World Holdings, Inc. (NASDAQ: EXPI), the DSCI’s best performer since its March 2020 establishment, and the index’s third largest member by stock market capitalization, inched 1.1% lower in November. This fall added to its YTD loss of 61.2%. Despite this significant correction in 2022, EXPI has rallied a remarkable 173.4% since March 1, 2020.
EXPI, the fastest growing real estate brokerage in the world, reported 3Q 2022 revenue of $1.2 billion, up 12% from 3Q 2021, and gross profit of $93.1 million, up 17% from the prior-year period. EXPI’s real estate transaction volume in 3Q 2022 was $50.4 billion, 8% more than in 3Q 2021.
A leading provider of financial services in the U.S. and Canada, and the largest market cap stock in the DSCI, Primerica, Inc. (NYSE: PRI) rose 3.0% in November, slightly outperforming the direct selling stock index (+2.4%). PRI’s YTD loss is now 2.8%. It has gained 36.0% since the March 2020 establishment of the DSCI.
On November 8, PRI reported 3Q 2022 revenue and adjusted operating EPS of $673.3 million and $3.02 versus $693.2 million and $2.98, respectively, in 3Q 2021. Market volatility in the quarter led to a substantial decline in client asset values and lower sales volumes in PRI’s Investment and Savings Product segment.
The company repurchased $97.4 million of its shares in 3Q 2022, bringing its YTD total to $324.3 million. An additional $32 million is expected to be repurchased in 4Q 2022. In addition, PRI’s Board authorized $375 million of stock buybacks for the full-year 2023.
The Beachbody Company, Inc. (NYSE: BODY) stock was the second worst performer among DSCI large-cap members in November, losing 30.7%. BODY, a leading subscription health and wellness company, has declined 70.5% over the first eleven months of 2022.
On November 9, BODY announced 3Q 2022 revenue and adjusted EBITDA of $165.9 million and negative $6.2 million versus 3Q 2021 levels of $208.1 million and a loss of $43.4 million, respectively. The significant YOY cash flow improvement stemmed from the company’s tight control of its costs even in the face of challenging market dynamics.
BODY projects 4Q 2022 revenue to be in the $140-$150 million range and expects to record a $9 million to $14 million 4Q 2022 adjusted EBITDA loss.
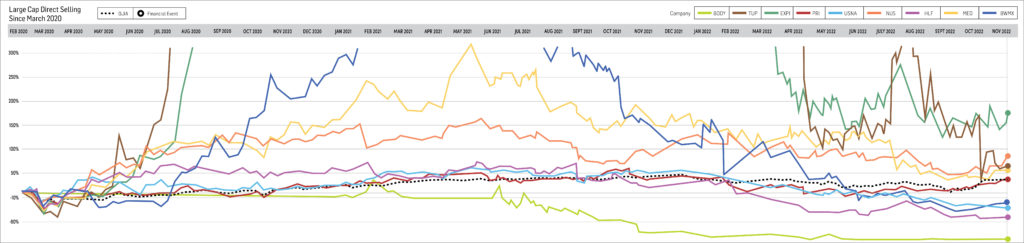
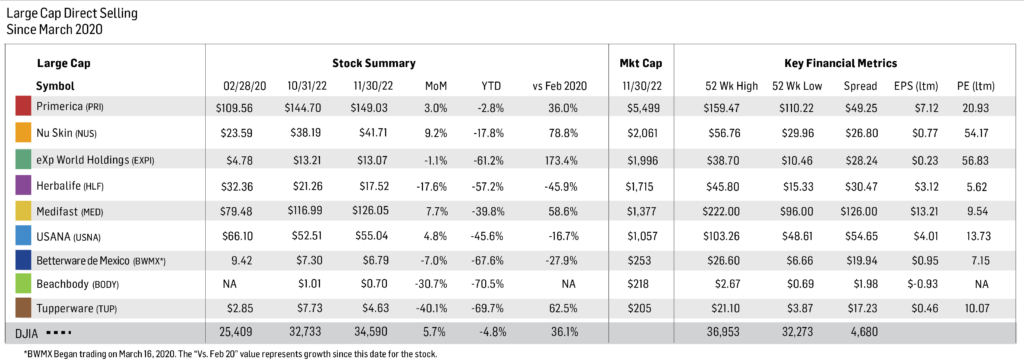
Small Cap
Our small cap tracking set gained in November and generally outperformed its large-cap peers during the month. Five small caps rose during November, only one declined, and another was unchanged.
Education Development Corporation (NASDAQ: EDUC), the best performing small cap stock in the direct selling index in November, rose 19.2% during the month. EDUC, a publishing company specializing in books for children, is down 67.1% and 40.4% YTD and since DSCI inception, respectively. In October, the company announced 2Q FY2023 (fiscal year 2023 ends February 2023) net revenue and pretax earnings of $19.4 million and a loss of $1.1 million versus $33.0 million and a gain of $2.7 million, respectively, in the year-ago period.
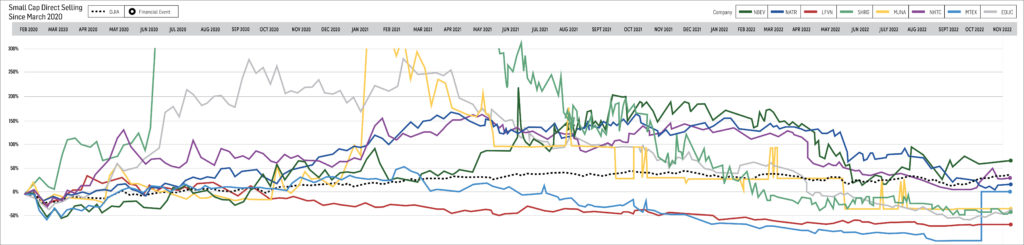
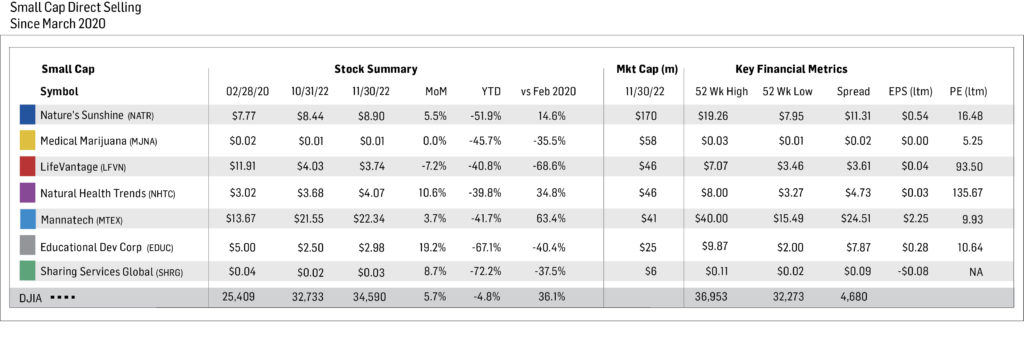
Short Interest Data & Analysis
The following chart is an aggregate index of “days to cover” among the entire tracking set. Days to cover (DTC) is a measurement determined by dividing the total outstanding short interest by average daily trading volume.
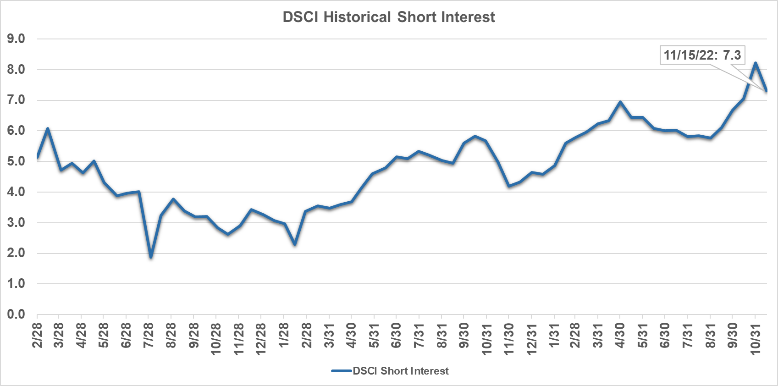
As indicated in the chart above, short interest in DSCI stocks was 7.3 days as of mid-November, down significantly from 8.2 days at the end of October, but slightly higher than 7.1 days as of mid-October. The biggest absolute decrease in DTC from late October to mid-November for a DSCI component was NUS’s fall to 3.7 days from 7.3 days. Aggregate “days-to-cover” have more than tripled since bottoming in mid-February 2021.
Short interest can be a difficult indicator to analyze. On the one hand, an increase in short interest can be a bearish sign in that it indicates an increased view among investors that a stock is likely to decline based on any number of factors, such as a belief that the company’s fundamentals are deteriorating or that it has run too far, too fast. On the other hand, as a stock moves higher, a significant short interest can serve as extra fuel on the fire as investors scramble to “buy to cover” their short positions and mitigate losses.
Analyst Sentiment Index
Our Analyst Sentiment Index rose in November, returning to its late summer 2021 peaks (since the March 2020 DSCI establishment). During November, the proportion of sell-side analysts maintaining “buy” and “hold” ratings on industry stocks was about 95%, up from 90% in October. Conversely, the percentage of stocks which analysts recommend selling equaled just 5%.
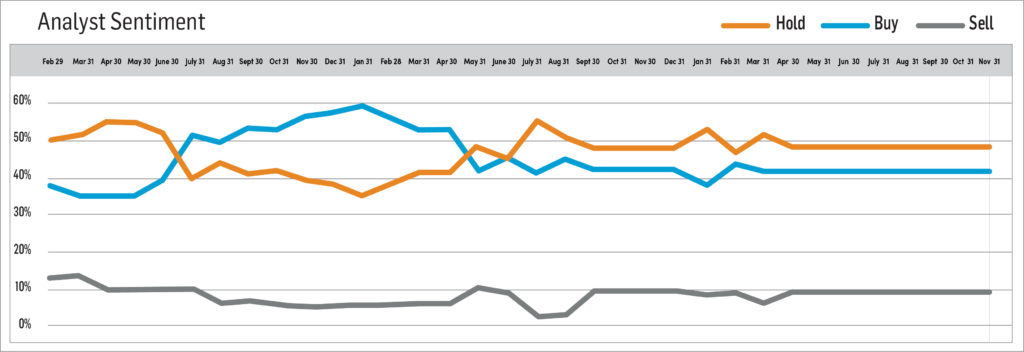
Methodology: The DSCA Analyst Sentiment Index is a consensus tracking tool that aggregates and averages the recommendations of all covering analysts across all public direct selling companies.
-
October 2022
Brought to you by Direct Selling Capital Advisors
Direct Selling Index Soars 12.5% in October, as the DJIA Records Its Biggest Monthly Percentage Gain in More than 45 Years
In October, the Direct Selling Capital Advisors Direct Selling Index (DSCI) soared 12.5%, nearly reversing a 14.8% loss in September. The DSCI rose in tandem with the Dow Jones Industrial Average (DJIA) during October (+14.0%). Indeed, October 2022 marked the DJIA’s best percentage gain in any month since 1976.
The DSCI’s October gains were quite broad, particularly among its large-cap members. Six of the nine large cap components rose in October, four by more than 10%. Two large caps fell and one was unchanged. Small cap DSCI members also appreciated in October, but not to the same degree. Six small caps rose, one declined, and one was flat on the month.
From a longer-term perspective, the DSCI fell 29.1% over the first ten months of 2022, a wider loss than the 9.9% decline of the DJIA over the same period. The direct selling index has gained an aggregate 21.3% since its March 1, 2020 inception. However, the index has moderately underperformed the DJIA since that time. The DJIA has increased 28.8% since March 1, 2020.
In October, investors were aggressive buyers of traditional large-cap stocks, like banks and energy companies, which translated into the Dow’s sterling monthly performance. Somewhat surprisingly, these gains occurred despite a mixed start to the 3Q 2022 earnings season, which showed slowing overall profit growth and included disappointing results from the tech giants Meta Platforms, Inc. and Amazon.com, Inc.
The stock market’s momentum was at least temporarily halted in early November when the Federal Reserve reiterated its resolve to aggressively raise interest rates to combat inflation. On November 2, the central bank implemented its fourth successive 75 basis point funds rate increase and signaled the likelihood of further boosts of greater magnitude than most analysts expected. In addition, Chairman Powell noted that the Fed is not yet contemplating any pause in its rate increase program.
Looking Forward
In addition to overall stock market uncertainty, DSCI components may be pressured in November by generally weak 3Q 2022 earnings reports. Specifically, large cap components Tupperware Brands Corporation (NYSE: TUP), Herbalife Nutrition, Inc. (NYSE: HLF), Nu Skin Enterprises, Inc. (NYSE: NUS), Medifast, Inc. (NYSE: MED) and USANA Health Sciences, Inc. (NYSE: USNA) reported results that were softer than expected.
Specifically, in conjunction with its earnings announcement, HLF withdrew its previous full-year 2022 revenue and earnings guidance due to global economic uncertainties. Similarly, managements of NUS, MED and USANA all reduced their 2022 sales and earnings projections because of slower than anticipated growth, as well as rising inflation rates and a strong U.S. dollar.
CHARTS & ANALYSIS
Direct Selling Capital Advisors Index
The DSCI is a market capitalization weighted index of all domestic public direct selling companies with a market capitalization of at least $25 million. The index is rebalanced monthly, and no single issue is permitted to represent more than 20% of its total value. In such an event, the excess weighting would be redistributed among the other index components.
The DSCI soared in October but underperformed the DJIA during the month. The DSCI gained 12.5% during the month, while the DJIA rose 14.0%. Over the first ten months of 2022, the direct selling index and the DJIA fell 29.1% and 9.9%, respectively. DSCI data is tracked back to March 1, 2020. The direct selling index has risen 21.3% since that date versus a 28.8% gain for the DJIA. At its peak in June 2021, the DSCI had risen 115.6% since inception.
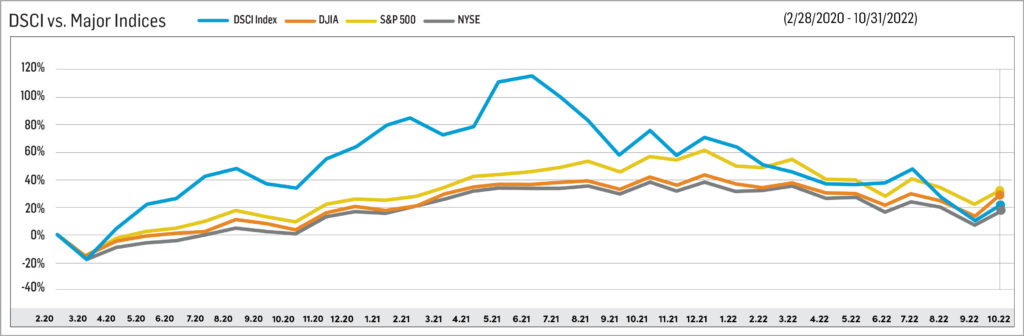
Large Cap
In October, Betterware de Mexico (NASDAQ: BWMX) stock declined 1.7%, making it one of just two large cap DSCI components which fell during the month. In the first ten months of 2022, BWMX lost 65.2% of its value. It has lost 22.5% since DSCI index inception.
On October 27, BWMX announced 3Q 2022 net revenue of 1,490 million nominal Mexican pesos, down 37% from the year-ago period. In addition, the company reported EBITDA of 267 million nominal Mexican pesos, 62% below the 3Q 2021 level. A softer-than-expected economic environment marked by weak consumer spending and high inflation rates in Mexico adversely impacted 3Q 2022 financial results.
BWMX management believes the company is positioned to resume top-line growth and return to profitability in 2023. Stabilization of its sales force and business restructuring should be key elements in the company’s recovery. BWMX is on track to begin operations in the U.S. in late 2023.
BWMX began trading in March 2020 after the company’s merger with SPAC sponsor DD3 Acquisition Corp. BWMX specifically targets the Mexican market; it serves three million households through distributors and associates in approximately 800 communities throughout Mexico.
Tupperware Brands Corporation (NYSE: TUP) rose 18.0% in October. The volatile stock had soared since the March 1, 2020 inception of the DSCI, but gave back much of those outsized gains in May 2022 when it fell more than 60% on a disappointing 1Q 2022 earnings report. TUP then surged in July and August before falling sharply in September and rallying strongly last month. After factoring in all these moves, TUP has gained 171.2% over the last 32 months, making it one of only two DSCI components to appreciate by more than 100% over that extended period. (The global real estate brokerage, eXp World Holdings, Inc. [NASDAQ: EXPI], is the other.)
On November 2, TUP reported 3Q 2022 net sales and adjusted diluted earnings of $302.8 million and $0.14 per share, down 20% and 88%, respectively, from the year-ago period. Both figures were well below analysts’ projections. TUP experienced decelerating revenue trends in the Asia Pacific and North American regions and continuing declines in Europe. Given weak revenue trends over the first nine months of 2022, TUP expects to implement additional restructuring actions and inventory reduction programs in 4Q 2022.
As of September 24, 2022, the end of TUP’s 3Q 2022, the company was in compliance with the covenants contained in its credit agreement. However, it is likely that TUP will not be able to maintain compliance over the next twelve months. Consequently, the company is currently negotiating with its lenders to amend the terms of the credit accord.
Nu Skin Enterprises, Inc. (NYSE: NUS) appreciated 14.4% in October, cutting its YTD loss to 24.7%. Since the March 2020 establishment of the DSCI, NUS has gained 61.9%, significantly outperforming both the direct selling stock index (+21.3%) and the Dow Jones Industrial Average (+28.8%).
On November 2, NUS reported 3Q 2022 revenue and adjusted EPS of $537.8 million and $0.47, down from $641.2 million and $0.97, respectively, in the year-ago quarter. Prolonged COVID-related disruptions in Mainland China, an economic slowdown in South Korea, persistent global inflation and the strong U.S. dollar all negatively affected NUS’ third quarter results.
In turn, NUS’s management cut its full-year 2022 revenue guidance to $2.2 to $2.25 billion from its prior $2.33 to $2.41 billion. In addition, the company now expects its adjusted 2022 EPS to be $2.40-$2.60 compared with its previous forecast of $3.30-$3.60.
Herbalife Nutrition, Inc. (NYSE: HLF) rose 6.9% in October. For the first ten months of 2022, HFL is down 48.1%. Since the March 2020 establishment of the DSCI, HLF has lost 34.3%, making it the worst performing DSCI large cap stock which has traded continuously since index inception 32 months ago.
On October 31, HLF reported 3Q 2021 net sales of $1.3 billion, down 9.5% from $1.43 billion in 3Q 2021. Third quarter adjusted diluted EPS was $0.91, a downtick from $1.21 in the year-ago period. Inflationary pressures negatively impacted HLF’s results, as did an unfavorable geographic revenue mix and the strength of the U.S. dollar.
Sales trends softened as the third quarter progressed due to macroeconomic uncertainties, and management expects this trend to continue into 4Q 2022. As a consequence, HLF withdrew its full-year 2022 guidance. The company’s most recent 2022 guidance had called for a year-over-year sales decline of 4% to 10%, and EPS of $3.25-$3.75.
Medifast, Inc. (NYSE: MED) gained 8.0% in October but underperformed the DSCI (+12.5%) in the month. Over the first ten months of 2022, MED declined 44.1%. More constructively, since the March 1, 2020 establishment of the DSCI, the stock has gained 47.2% and has significantly outperformed both the direct selling stock index and the Dow Jones Industrials over that period.
On November 3, NUS announced 3Q 2022 revenue of $390.4 million, 5.5% below 3Q 2021 sales of $413.4 million. The company’s adjusted diluted EPS likewise declined to $3.32 from $3.56 in the year-ago period. The slowing global economy is impacting spending levels and the pace of customer acquisition at consumer-facing companies like MED.
For the second consecutive quarter, MED trimmed its 2022 revenue and adjusted diluted EPS guidance ranges. Specifically, in early November, the company cut its revenue and EPS forecasts to $1.51-$1.59 billion and $11.61-$13.05 from $1.58-$1.66 billion and $12.70-$14.10, respectively.
USANA Health Sciences, Inc. (NYSE: USNA) lost 6.3% in October making it the worst performing DSCI large cap component during the month. YTD, USANA is down 48.1%. Since the March 2020 inception of the DSCI, USANA shares have declined 20.6% compared with notable gains in both the direct selling index and the DJIA.
On October 25, USANA reported 3Q 2022 net sales of $233 million, 15% below 4Q 2021 revenue of $274 million. The company’s 3Q 2022 diluted EPS was $0.78 versus $1.36 in the year-ago period. A challenging operating environment in the Asia Pacific region, coupled with an appreciating U.S. dollar, significantly impacted 3Q 2022 results.
These factors, as well as a 7% decline in active customers from 2Q 2022 to 3Q 2022, prompted management to reduce its full-year 2022 net sales and diluted EPS guidance ranges to $955-$975 million and $3.15-$3.40, respectively. USANA’s prior 2022 revenue and EPS forecast ranges were $1.015-$1.065 billion and $3.85-$4.45, respectively.
eXp World Holdings, Inc. (NASDAQ: EXPI), the DSCI’s best performer since its March 2020 establishment and the index’s third largest member by stock market capitalization, gained 17.8% in October. This performance cut its YTD loss to 60.8%. Despite this significant correction in 2022, EXPI has rallied 176.4% since March 1, 2020.
On November 2, EXPI reported 3Q 2022 revenue of $1.2 billion, up 12% from 3Q 2021, and gross profit of $93.1 million, up 17% from the prior-year period. EXPI’s real estate transaction volume in 3Q 2022 was $50.4 billion, up 8% from 2Q 2022.
EXPI is the fastest-growing real estate brokerage in the world; it has 84,911 agents across the globe as of September 30, 2022. The company expanded into Chile and Poland in 3Q 2022, bringing to 24 the total number of countries in which it has a presence.
A leading provider of financial services in the U.S. and Canada, and the largest market cap stock in the DSCI, Primerica, Inc. (NYSE: PRI) rose 17.2% in October, outperforming the direct selling stock index (+12.5%). PRI’s YTD loss is now 5.6%. It has gained 32.1% since the March 2020 establishment of the DSCI.
In early August, PRI reported 2Q 2022 revenue of $668.7 million, up 2% from $654.7 million in the year-ago period. The company’s 2Q 2022 adjusted diluted EPS was $2.86, down 12% from 2Q 2021. PRI plans to release its 3Q 2022 results on November 8, 2022.
The Beachbody Company, Inc. (NYSE: BODY) stock was unchanged in October, breaking a two-month string of outperformance versus the DSCI. BODY, a leading subscription health and wellness company has declined 57.4% over the first ten months of 2022.
In early August, BODY released 2Q 2022 financial results. Its quarterly revenue was $179.1 million, down 20% from $223.1 million in 2Q 2021. Adjusted 2Q 2022 EBITDA was a loss of $1.5 million, an improvement from negative $4.4 million in the year-ago period. BODY plans to release its 3Q 2022 results on November 9, 2022.
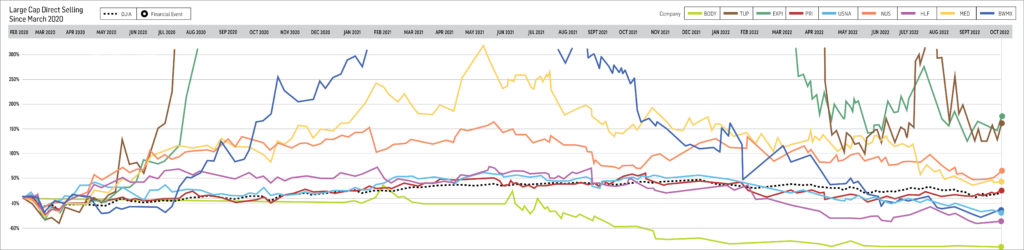
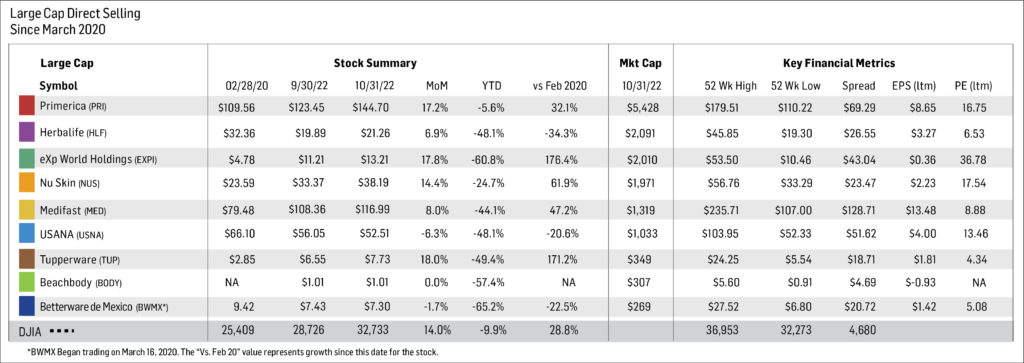
Note: For the purposes of this report, Direct Selling Capital considers companies with a market capitalization in excess of $1 billion “Large Cap.”
Small Cap
Our small cap tracking set gained in October but generally underperformed its large-cap peers during the month. Six small caps rose during October, while one declined and another was unchanged.
The largest small cap stock in the direct selling stock index, Nature’s Sunshine Products, Inc. (NASDAQ: NATR), rose 2.4% in October. NATR, a producer of herbal and nutritional products, is down 54.4% YTD but is up 8.7% since DSCI inception. On November 3, the company announced 3Q 2022 net sales and adjusted EBITDA of $104.5 million and $6.8 million, respectively, down 8.9% and 47.3% from the year-ago period.
Short Interest Data & Analysis
The following chart is an aggregate index of “days to cover” among the entire tracking set. Days to cover (DTC) is a measurement determined by dividing the total outstanding short interest by average daily trading volume.
As indicated in the chart above, short interest in DSCI stocks was 7.1 days as of mid-October, up significantly from 6.7 days at the end of September, and 6.1 days as of mid-September. The biggest absolute increase in DTC from late September to mid-October for a DSCI component was HLF’s jump to 6.5 days from 5.3 days. Aggregate “days-to-cover” have more than tripled since bottoming in mid-February 2021.
Short interest can be a difficult indicator to analyze. On the one hand, an increase in short interest can be a bearish sign in that it indicates an increased view among investors that a stock is likely to decline based on any number of factors, such as a belief that the company’s fundamentals are deteriorating or that it has run too far, too fast. On the other hand, as a stock moves higher, a significant short interest can serve as extra fuel on the fire as investors scramble to “buy to cover” their short positions and mitigate losses.
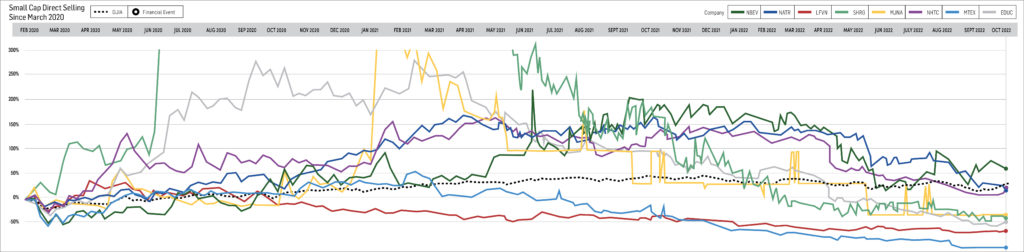
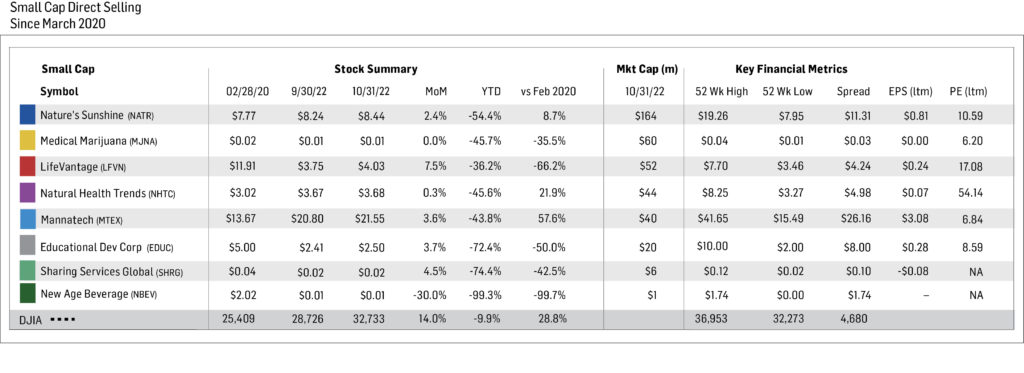
Analyst Sentiment Index
Our Analyst Sentiment Index was unchanged in October from September. This qualitative sentiment index is not far from its late summer 2021 levels, the peak since the DSCI’s March 2020 establishment. During October, the proportion of sell-side analysts maintaining “buy” and “hold” ratings on industry stocks was 90%. Conversely, the percentage of stocks which analysts recommend selling equaled just 10%.
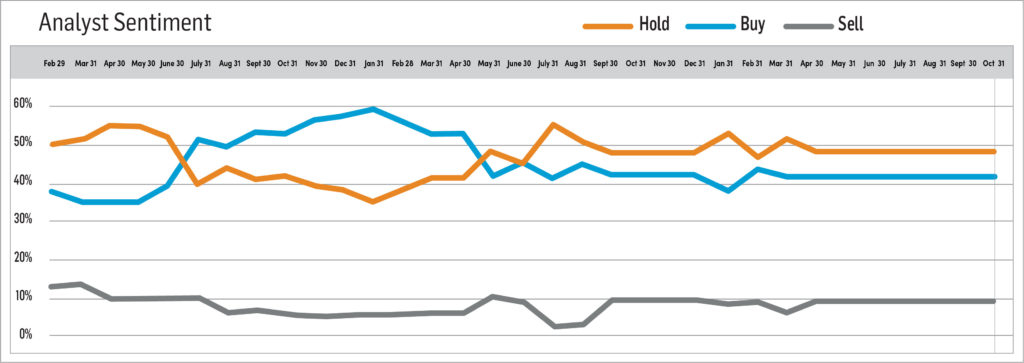
-
September 2022
Brought to you by Direct Selling Capital Advisors
In Conjunction with the Worst Stock Market Month in 2½ Years, the Direct Selling Index Stumbles for a Second Consecutive Month in September
In September, the Direct Selling Capital Advisors Direct Selling Index (DSCI) fell 14.8%, mirroring a 14.0% drop in August. The Dow Jones Industrial Average (DJIA) also lost substantial value in September, but its 8.8% loss was less pronounced than the DSCI’s.
The DSCI’s declines in September were widespread. No DSCI component rose during the month. All nine large cap members declined, seven by more than 10%; and seven of the eight small cap components fell, six by double-digit percentage points. One small cap was unchanged.
From a longer-term perspective, the DSCI fell 37.0% over the first three quarters of 2022, a wider loss than the 20.9% decline of the DJIA over the same period. The direct selling index has gained an aggregate 7.8% since its March 1, 2020 inception. Factoring in September’s results, the index has moderately underperformed the DJIA since that time. The DJIA has increased 13.1% since March 1, 2020.
In September, stocks suffered their worst monthly loss since the onset of the COVID-19 pandemic in March 2020. The broad-based S&P 500 Index fell 9.3% in the month, bringing its losses for the first nine months of 2022 to 21.9% (expressed on a total return basis). The S&P 500 Index has now lost ground for three successive quarters, the first time that has occurred since 2009.
The two chief reasons for the poor September performance were a hotter-than-expected inflation report released in mid-September—the Consumer Price Index rose 8.3% in the twelve months ended August 2022—and the Federal Reserve’s decision a week later to raise overnight interest rates by 75 basis points, coupled with hawkish commentary from Chairman Powell at his news conference. The Fed members projected a year-end 2022 Federal Funds Rate somewhere in the mid 4% range, more than 100 basis points higher than the current 3.25% rate.
In response, U.S. Treasury note and bonds yields surged across the yield curve, and the dollar rose value versus other currencies. Specifically, the yield on the benchmark U.S. ten-year Treasury bond increased to 3.83% on September 30 from 3.27% at the end of August, and the DXY U.S. Dollar Currency Index gained approximately 2% during the month. Sharp increases in both of these key indicators frequently put substantial pressure on equity markets.
Looking Forward
As in September, movements in DSCI stocks in October will likely be determined by the direction of the overall stock market as opposed to company-specific news. Such news is unlikely to be released until the direct selling companies begin to report 3Q 2022 results in early November. With this as a backdrop, October has gotten off to a good start; the S&P 500 soared by nearly 6% in just the first two trading days of October, its sharpest two-day advance since spring 2020. A short squeeze, plus hopes of a fairly rapid Fed pivot to a more accommodative monetary policy, fueled these gains.
Also much like in September, the release date of the next CPI data October 13, promises to be an important event for companies and investors. A market-friendly inflation reading could positively impact both investor sentiment and the overall economy. Conversely, another higher-than-forecasted figure could have the opposite effect. The next scheduled meeting of the Fed’s Open Market Committee is November 1-2.
CHARTS & ANALYSIS
Direct Selling Capital Advisors Index
The DSCI is a market capitalization weighted index of all domestic public direct selling companies with a market capitalization of at least $25 million. The index is rebalanced monthly, and no single issue is permitted to represent more than 20% of its total value. In such an event, the excess weighting would be redistributed among the other index components.
The DSCI dropped in September and underperformed the DJIA during the month. Specifically, the DSCI lost 14.8% during September, while the DJIA declined 8.8%. Over the first nine months of 2022, the direct selling index and the DJIA fell 37.0% and 20.9%, respectively. DSCI data is tracked back to March 1, 2020. The index has risen 7.8% since that date versus a 13.1% gain for the DJIA. At its peak in June 2021, the index had risen 115.6% since inception.
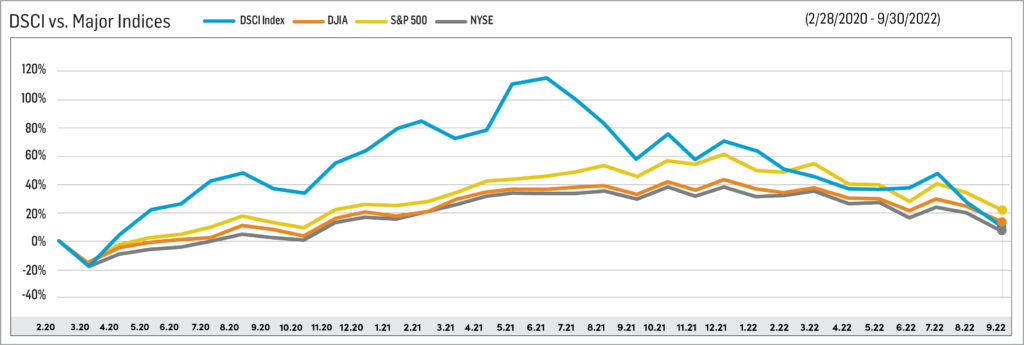
Large Cap
In September, Betterware de Mexico (NASDAQ: BWMX) stock fell 8.8%, but that performance made it the second best performing large cap DSCI component during the month. In the first three quarters of 2022, BWMX declined 64.6%. It has lost 21.1% since DSCI index inception.
BWMX’s 2Q 2022 revenue increased 25% versus 2Q 2021, but much of that gain stemmed from its April 7, 2022 acquisition of JAFRA, a leader in the beauty and personal care products industry. BWMX’s 2Q 2022 adjusted EPS declined 48% from the year-ago period.
BWMX began trading in March 2020 after the company’s merger with SPAC sponsor DD3 Acquisition Corp. BWMX specifically targets the Mexican market; it serves three million households through distributors and associates in approximately 800 communities throughout Mexico.
Tupperware Brands Corporation (NYSE: TUP) tumbled 41.7% in September, reversing a 50.7% gain in August. The volatile stock had soared since the March 1, 2020 inception of the DSCI, but gave back much of those outsized gains in May 2022 when it fell more than 60% on a disappointing 1Q 2022 earnings report. TUP then surged in July and August before, as noted above, falling sharply in September. Nevertheless, after factoring in all these moves, TUP has gained 129.8% over the last 31 months, making it one of only two DSCI components to appreciate by more than 100% over that extended period. (The global real estate brokerage, eXp World Holdings, Inc. (NASDAQ: EXPI), is the other.)
TUP reported 2Q 2022 net sales of $340.6 million, down 18% from 2Q 2021 and adjusted diluted 2Q 2022 EPS of $0.41 versus $0.90 in the year-ago period. Lockdowns in China and shifts in consumer behavior in Europe significantly affected 2Q 2022 results.
In late September, TUP paid a small civil penalty (which had been fully accrued in its 2Q 2022 results) to settle an SEC inquiry into the accounting practices of a since-divested beauty business.
Nu Skin Enterprises, Inc. (NYSE: NUS) dropped 18.5% in September, bringing its YTD loss to 34.2%. However, since the March 2020 establishment of the DSCI, NUS has appreciated 41.4%, significantly outperforming both the direct selling stock index (+7.8%) and the Dow Jones Industrial Average (+13.1%).
NUS reported 2Q 2022 revenue of $560.5 million, down 20% versus 2Q 2021. Earnings likewise fell in the quarter; 2Q22 adjusted EPS was $0.77 compared with $1.15 in the year-ago period. NUS’ full-year 2022 revenue and adjusted EPS guidance ranges are now $2.33-$2.41 billion and $3.30-$3.60, respectively.
Herbalife Nutrition, Inc. (NYSE: HLF) fell 23.8% in September, approximately reversing gains of 6.9% and 19.4% in August and July, respectively. For the first nine months of 2022, HFL is down 51.4%. Since the March 2020 establishment of the DSCI, HLF has lost 38.5%, making it the worst performing DSCI large cap stock which has traded continuously since index inception 31 months ago.
HLF’s 2Q 2022 net sales totaled $1.4 billion, down 10.3% compared with the year-ago period. Perhaps more importantly, management asserted that HLF’s underlying business trends stabilized over the last two months of 2Q 2022 versus April levels. The company’s second quarter adjusted diluted EPS was $0.96 versus $1.55 in 2Q 2021. HLF plans to release its 3Q 2022 results on October 31.
Medifast, Inc. (NYSE: MED) lost 13.6% in September and therefore slightly outperformed the DSCI (-14.8%) in the month. Over the first three quarters of 2022, MED declined 48.3%. More constructively, since the March 1, 2020 establishment of the DSCI, the stock has gained 36.3% and has significantly outperformed both the direct selling stock index and the Dow Jones Industrials over that period.
In early August, MED reported second-quarter 2022 revenue of $453.3 million, up 15.0% from 2Q 2021. Its 2Q 2022 diluted EPS was $3.42, down 13.6% from $3.96 in the year-ago period. Management adjusted its full-year 2022 revenue guidance to $1.58-$1.66 billion and its 2022 non-GAAP diluted EPS projection to $12.70-$14.10.
USANA Health Sciences, Inc. (NYSE: USNA) fell 13.1% in September, adding to its YTD loss of 44.6%. Since the March 2020 inception of the DSCI, USANA shares have declined 15.2% compared with moderate gains in both the direct selling index and the DJIA.
USANA’s 2Q 2022 net sales were $264 million, down 21% from 2Q 2021. Diluted EPS in the quarter was $1.00 versus $1.87 in the year-ago period. Positively, management reiterated its full-year 2022 net sales and diluted EPS guidance ranges of $1.015-$1.065 billion and $3.85-$4.45, respectively.
eXp World Holdings, Inc. (NASDAQ: EXPI), the DSCI’s best performer since its March 2020 establishment and the index’s third largest member by stock market capitalization, declined 13.3% in September. This performance brought its YTD loss to 66.7%. Despite this significant correction in 2022, EXPI has rallied 134.5% since March 1, 2020.
EXPI’s 2Q 2022 revenue reached $1.4 billion, up 42% from 2Q 2021, and its gross profit in the period was $107.3 million, 34% ahead of the year-ago quarter. EXPI’s real estate transaction volume in 2Q 2022 was 44% higher than in 2Q 2021.
EXPI is the fastest-growing real estate brokerage in the world; it has more than 84,000 agents across the globe. The company plans to expand into Poland before the end of 2022. With this expansion, the company will have a presence in 24 countries.
A leading provider of financial services in the U.S. and Canada and the largest market cap stock in the DSCI, Primerica, Inc. (NYSE: PRI) was by far the best large-cap DSCI performer in September. PRI declined 2.6% during the month versus a 14.8% drop in the direct selling stock index. PRI’s YTD loss is now 19.5%. PRI has gained 12.7% since the March 2020 establishment of the DSCI.
In early August, PRI reported 2Q 2022 revenue of $668.7 million, up 2% from $654.7 million in the year-ago period. The company’s 2Q 2022 adjusted diluted EPS was $2.86, down 12% from 2Q 2021. On August 11, PRI’s Board of Directors authorized a $50 million increase in the company’s share repurchase authorization to $375 million from $325 million. As a result, PRI expects to repurchase $356 million of its common stock in the second half of 2022; it had already purchased $19 million thus far in 2022.
The Beachbody Company, Inc. (NYSE: BODY) stock dropped 12.9% in September and thereby outperformed the DSCI for the second consecutive month. The DSCI fell 14.8% in September. BODY, a leading subscription health and wellness company has declined 57.4% over the first nine months of 2022.
In early August, BODY released 2Q 2022 financial results. Its quarterly revenue was $179.1 million, down 20% from $223.1 million in 2Q 2021. Adjusted 2Q 2022 EBITDA was a loss of $1.5 million, an improvement from negative $4.4 million in the year-ago period. For the full-year 2022, BODY’s combined adjusted EBITDA loss and capital expenditure outlays are projected to be $110 million-$120 million more favorable than in 2021.
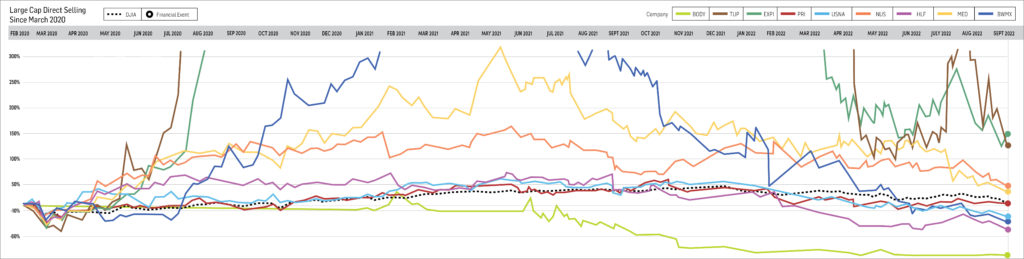
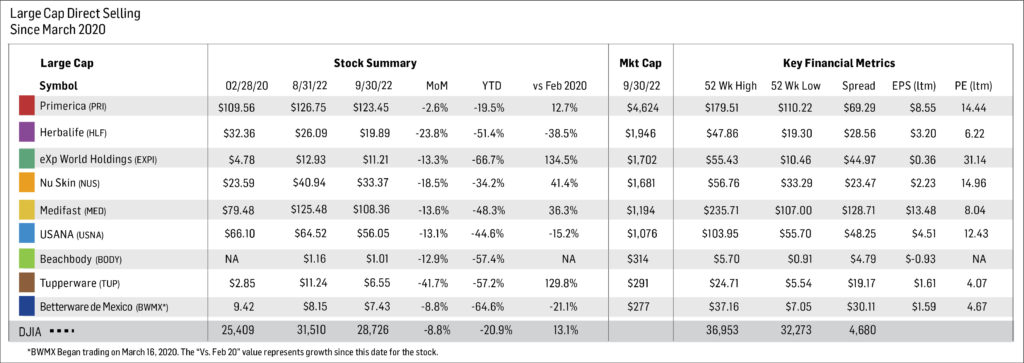
Small Cap
Our small cap tracking set fell sharply in September; its performance was very similar to its large-cap peers. One small cap was unchanged during the month, while seven declined, six by more than 10%.
The largest small cap stock in the direct selling stock index, Nature’s Sunshine Products, Inc. (NASDAQ: NATR), declined 15.1% in September. NATR, a producer of herbal and nutritional products, is down 55.5% YTD but is up 6.1% since DSCI inception. In early August, the company announced 2Q 2022 net sales and adjusted EBITDA of $104.2 million and $9.0 million, respectively; down 4.4% and 32.8% from the year-ago period.
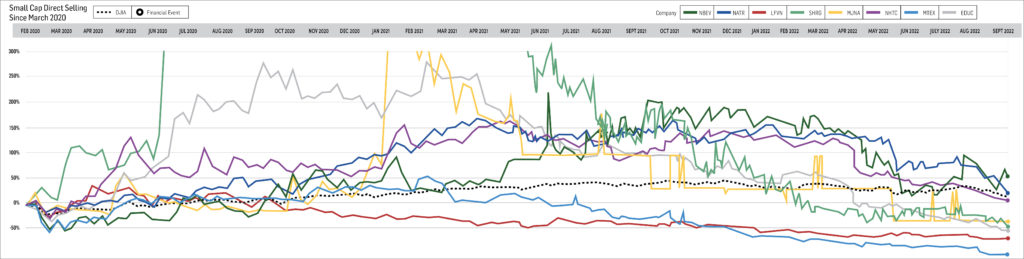
 Short Interest Data & Analysis
The following chart is an aggregate index of “days to cover” among the entire tracking set. Days to cover (DTC) is a measurement determined by dividing the total outstanding short interest by average daily trading volume.
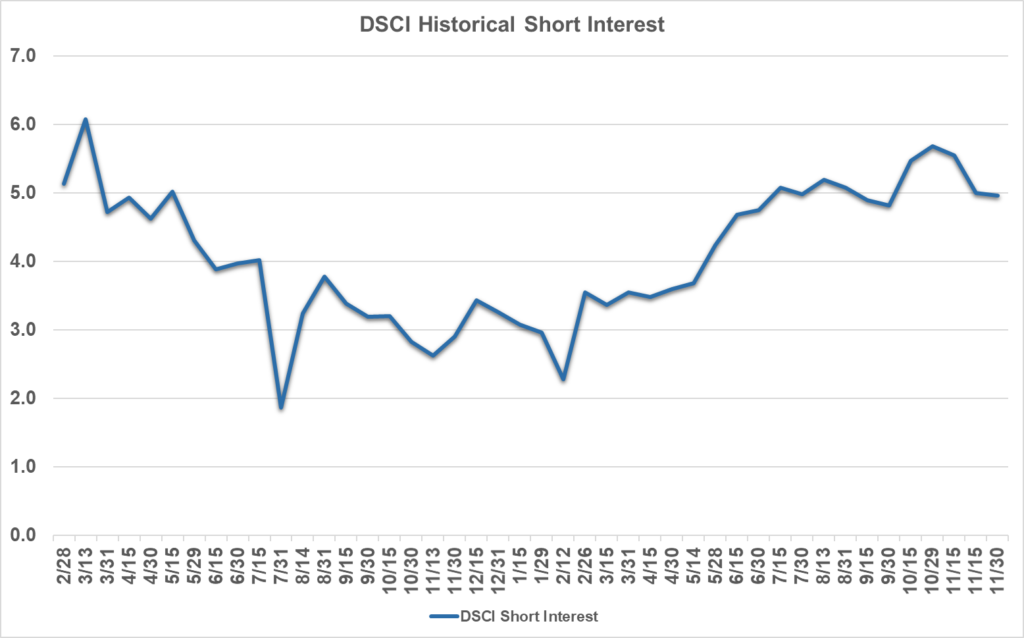 As indicated in the chart above, short interest in DSCI stocks was 6.1 days as of mid-September, up from 5.8 days as of both mid-August and August 31. The biggest absolute increase in DTC from late August to mid-September for a DSCI component was EXPI’s jump to 15.1 days from 13.9 days. Aggregate “days-to-cover” have approximately tripled since bottoming in mid-February 2021.
Short interest can be a difficult indicator to analyze. On the one hand, an increase in short interest can be a bearish sign in that it indicates an increased view among investors that a stock is likely to decline based on any number of factors, such as a belief that the company’s fundamentals are deteriorating, or a belief that it has run too far too fast. On the other hand, as a stock moves higher, a significant short interest can serve as extra fuel on the fire as investors scramble to “buy to cover” their short positions and mitigate losses.
Analyst Sentiment Index
Our Analyst Sentiment Index was unchanged in September from August. Despite the DSCI’s underperformance in September 2022, this qualitative sentiment index is not far from its late summer 2021 levels, the peak since the DSCI’s March 2020 establishment. During September, the proportion of sell-side analysts maintaining “buy” and “hold” ratings on industry stocks was 90%. Conversely, the percentage of stocks which analysts recommend selling equaled just 10%.
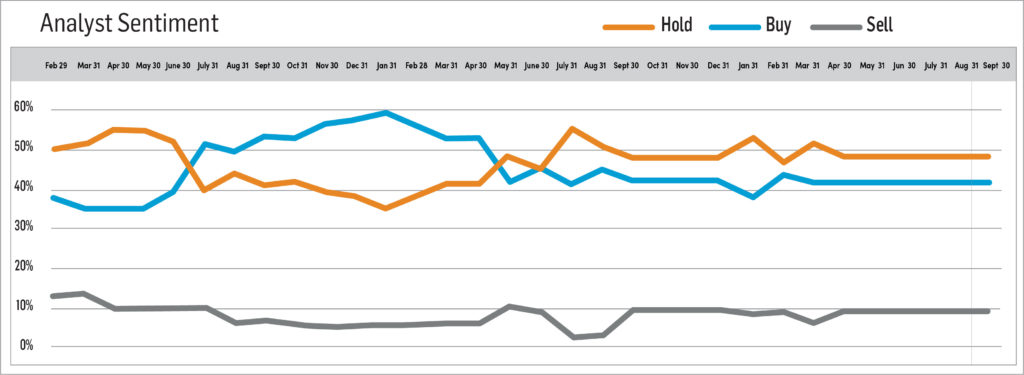
-
August 2022
Brought to you by Direct Selling Capital Advisors
In August, the Direct Selling Stocks Index Fell 14% and Markedly Underperformed the DJIA
In August, the Direct Selling Capital Advisors Direct Selling Index (DSCI) declined 14.0%, more than reversing a 7.0% increase in July and ending a three-month streak of gains. The Dow Jones Industrial Average (DJIA) also fell in August, but its 4.1% loss was significantly narrower than the DSCI’s.
The DSCI’s declines in August were widespread. Seven large-cap components fell during the month, while only two rose. Similarly, six small-cap members lost ground, just one gained, and one was unchanged. vOne large cap, Tupperware Brands Corporation (NYSE: TUP), and one small cap, Mannatech, Incorporated (NASDAQ: MTEX), increased by more than 10%, while three large caps and two small caps fell by more than that benchmark.
From a longer-term perspective, the DSCI fell 26.0% over the first eight months of 2022, a wider loss than the 13.3% decline of the DJIA over the same period. However, the direct selling index has gained a cumulative 26.5% since its March 1, 2020 inception and it has outperformed the DJIA since that time. The DJIA has appreciated 24.0% since March 1, 2020.
Stocks declined across the board in August, particularly in the latter stages of the month. Investors reacted negatively to Fed Chairman Powell’s late August comments that the Fed funds rate must be raised further, perhaps much further, until inflation is under control—despite the risks of a recession. Until the time of his speech, many market participants had hoped the Fed would pivot away from its tightening program fairly soon in order to avoid the possibility of an economic downturn.
The broad-based S&P 500 Index’s 4.2% loss in August represents further evidence of the mercurial nature of the market and the degree it is tied to the direction of Federal Reserve policy. Indeed, the S&P 500 had gained 5.2% in the first ten trading days of the month, which at the time represented a four-month high.
Relatively small changes in sentiment can cause substantial moves in the headline market indices. In July, investor expectations of a friendlier long-term path of Fed action, coupled with better-than-expected 2Q 2022 earnings reports from a number of large companies, fueled a 9.1% gain in the S&P 500 during that period, its best monthly gain in nearly two years.
Looking Forward
The direction of DSCI stocks in September seems likely to be dictated by major economic releases and their projected impact on future Fed actions. Reports detailing inflationary and weekly unemployment trends may have the greatest impact on any presumed policy changes and investor sentiment. The Fed’s next meeting is scheduled for September 20-21.
As an aside, September has on average been the weakest calendar month for stocks. However, in this unpredictable year, one should not necessarily expect the market to follow historic norms.
The direct selling stocks have all reported their 2Q 2022 results, and 3Q 2022 results will not begin to be released until late October. As a consequence, little company-specific news should be expected in September. Of all the DSCI components, TUP bested analysts’ consensus 2Q 2022 revenue and earnings estimates by the widest margins, and those results were the catalyst for the stock’s strong performance in late July and August.
CHARTS & ANALYSIS
Direct Selling Capital Advisors Index
The DSCI is a market capitalization weighted index of all domestic public direct selling companies with a market capitalization of at least $25 million. The index is rebalanced monthly, and no single issue is permitted to represent more than 20% of its total value. In such an event, the excess weighting would be redistributed among the other index components.
The DSCI dropped in August and markedly underperformed the DJIA during the month. Specifically, the DSCI lost 14.0% during August, while the DJIA declined 4.1%. Over the first eight months of 2022, the direct selling index and the DJIA fell 26.0% and 13.3%, respectively. DSCI data is tracked back to March 1, 2020. The index has risen 26.5% since that date versus a 24.0% gain for the DJIA. At its peak in June 2021, the index had risen 115.6% since inception.
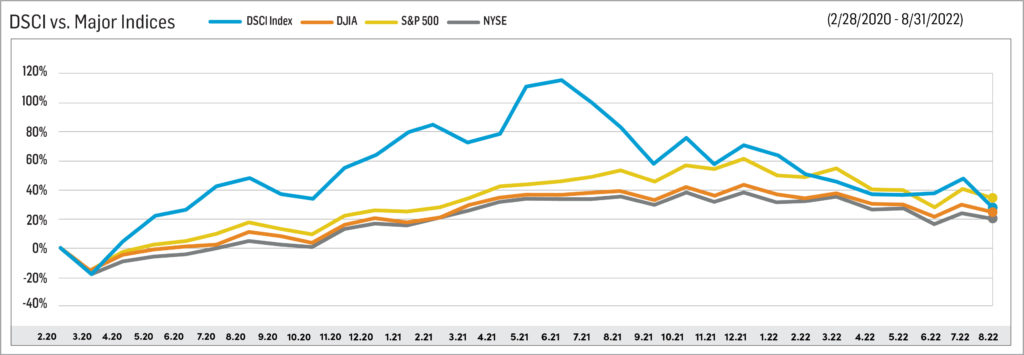
Large Cap
In August, Betterware de Mexico (NASDAQ: BWMX) stock fell 18.8%, essentially reversing its July increase of 16.2%. In the first eight months of 2022, BWMX declined 61.1%. It has lost 13.5% since DSCI index inception.
BWMX’s 2Q 2022 revenue increased 25% versus 2Q 2021, but much of that gain stemmed from its April 7, 2022 acquisition of JAFRA, a leader in the beauty and personal care products industry. BWMX’s 2Q 2022 adjusted EPS declined 48% from the year-ago period.
BWMX began trading in March 2020 after the company’s merger with SPAC sponsor DD3 Acquisition Corp. BWMX specifically targets the Mexican market; it serves three million households through distributors and associates in approximately 800 communities throughout Mexico.
Tupperware Brands Corporation (NYSE: TUP) skyrocketed 50.7% in August, building on a 17.7% gain in July. The stock has soared since the March 1, 2020 inception of the DSCI, but gave back much of those outsized gains in May 2022 when it fell more than 60% on a disappointing 1Q 2022 earnings report. Nevertheless, after factoring in its strong performance in July and August, TUP has gained 294.4% over the last 2 ½ years, making it by far the best performing DSCI component over that period.
TUP reported 2Q 2022 net sales of $340.6 million, down 18% from 2Q 2021, and adjusted diluted 2Q 2022 EPS of $0.41 versus $0.90 in the year-ago period. Lockdowns in China and shifts in consumer behavior in Europe significantly affected 2Q 2022 results.
Nu Skin Enterprises, Inc. (NYSE: NUS) lost 5.9% in August. Since the March 2020 establishment of the DSCI, NUS has appreciated 73.5%, significantly outperforming both the direct selling stock index (+26.5%) and the Dow Jones Industrial Average (+24.0%).
NUS reported 2Q 2022 revenue of $560.5 million, down 20% versus 2Q 2022. Earnings likewise fell in the quarter; 2Q22 adjusted EPS was $0.77 compared with $1.15 in the year-ago period. In light of heightened global uncertainties impacting its business, NUS reduced its full-year 2022 revenue and adjusted EPS guidance ranges to $2.33-$2.41 billion and $3.30-$3.60, respectively.
Herbalife Nutrition, Inc. (NYSE: HLF) gained 6.9% in August, making it one of only two DSCI large cap stocks which rose during the month. Furthermore, HLF’s August increase marked its second successive positive month; it rose 19.4% in July. Nevertheless, HLF is still down 36.3% YTD. Since the March 2020 establishment of the DSCI, HLF has lost 19.4%. It is the worst performing DSCI large cap stock which has traded continuously since index inception 30 months ago.
HLF’s 2Q 2022 net sales totaled $1.4 billion, down 10.3% compared with the year-ago period. Perhaps more importantly, management asserted that HLF’s underlying business trends stabilized over the last two months of 2Q 2022 versus April levels. The company’s second quarter adjusted diluted EPS was $0.96 versus $1.55 in 2Q 2021.
Medifast, Inc. (NYSE: MED) lost 25.4% in August, making it the worst performing large cap index component for the second consecutive month. Over the first eight months of 2022, MED declined 40.1%. On the other hand, since the March 1, 2020 establishment of the DSCI, the stock has gained 57.9%. By comparison, the direct selling stock index and the Dow Jones Industrials have gained 26.5% and 24.0%, respectively, over that 2 ½-year period.
On August 3, MED reported second-quarter 2022 revenue of $453.3 million, up 15.0% from 2Q 2021. Its 2Q 2022 diluted EPS was $3.42, down 13.6% from $3.96 in the year-ago period. Factoring in these results, management cut its full-year 2022 revenue guidance to $1.58-$1.66 billion. The company also reduced its 2022 non-GAAP diluted EPS projection to $12.70-$14.10. Macroeconomic factors such as inflation and consumer sentiment have impacted customer retention.
USANA Health Sciences, Inc. (NYSE: USNA) dropped 7.3% in August, bringing its YTD loss to 36.2%. Since the March 2020 inception of the DSCI, USANA shares have declined 2.4% versus gains in both the direct selling index and the DJIA.
USANA’s 2Q 2022 net sales were $264 million, down 21% from 2Q 2021. Diluted EPS in the quarter was $1.00 versus $1.87 in the year-ago period. USANA continues to experience COVID-related disruptions in several key markets, including mainland China. Management reiterated its full-year 2022 net sales and diluted EPS guidance ranges of $1.015-$1.065 billion and $3.85-$4.45, respectively.
eXp World Holdings, Inc. (NASDAQ: EXPI), the DSCI’s second best performer since its March 2020 establishment and the index’s fourth largest member by stock market capitalization, declined 13.0% in August. This performance brought its YTD loss to 61.6%. Despite this correction in 2022, EXPI has rallied 170.5% since March 1, 2020.
EXPI’s 2Q 2022 revenue reached $1.4 billion, up 42% from 2Q 2021, and its gross profit in the period was $107.3 million, 34% ahead of the year-ago quarter. EXPI’s real estate transaction volume in 2Q 2022 was 44% higher than in 2Q 2021.
A leading provider of financial services in the U.S. and Canada, and the largest market cap stock in the DSCI, Primerica, Inc. (NYSE: PRI) dropped 1.5% in August bringing its YTD loss to 17.3%. PRI has gained 15.7% since the March 2020 establishment of the DSCI.
On August 8, PRI reported 2Q 2022 revenue of $668.7 million, up 2% from $654.7 million in the year-ago period. The company’s 2Q 2022 adjusted diluted EPS was $2.86, down 12% from 2Q 2021. Earnings in PRI’s Investment and Savings division were negatively affected by the 2Q 2022 stock market correction. Both sales and client asset values declined as volatility heightened investors’ apprehension.
On August 11, PRI’s Board of Directors authorized a $50 million increase in the company’s share repurchase authorization to $375 million from $325 million. As a result, PRI expects to repurchase $356 million of its common stock in 2022.
Even though it fell 3.3% in August, The Beachbody Company, Inc. (NYSE: BODY) stock handily outperformed the DSCI, which dropped 14.0% during the month. BODY, a leading subscription health and wellness company has declined 51.1% YTD.
On August 8, BODY released 2Q 2022 earnings. Revenue was $179.1 million, down 20% from $223.1 million in 2Q 2021. Adjusted 2Q 2022 EBITDA was a loss of $1.5 million, an improvement from negative $4.4 million in the year-ago period. For the full-year 2022, BODY management estimates that its combined adjusted EBITDA loss and capital expenditure outlays will be $110 – $120 million more favorable than in 2021.
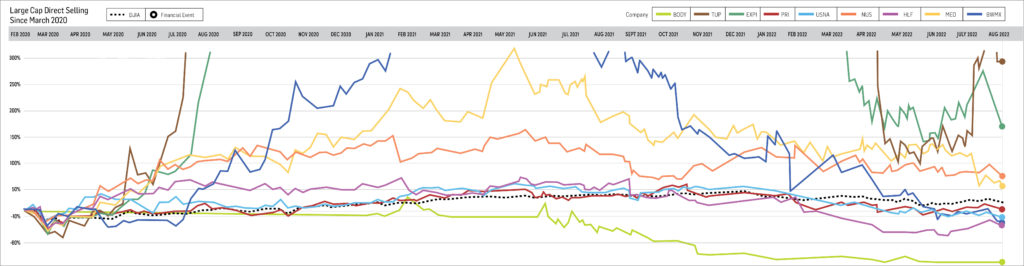
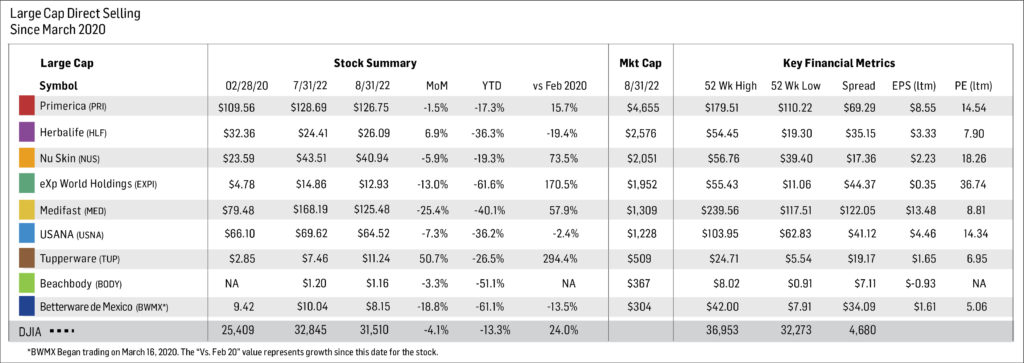
Small Cap
Our small cap tracking set fell sharply during August; its performance mirrored its large-cap peers. Only one small cap advanced during the month, while six declined and one was unchanged.
The top-performing small cap stock in August was Mannatech, Incorporated (NASDAQ: MTEX). MTEX, which is a global health and wellness company, gained 32.6% during the month. However, it is still down 39.0% YTD. On August 12, MTEX reported 2Q 2022 revenue and diluted EPS of $35.0 million and $0.34 versus $42.5 million and $0.99, respectively. Supply constraints worldwide continued to impact MTEX’s business.
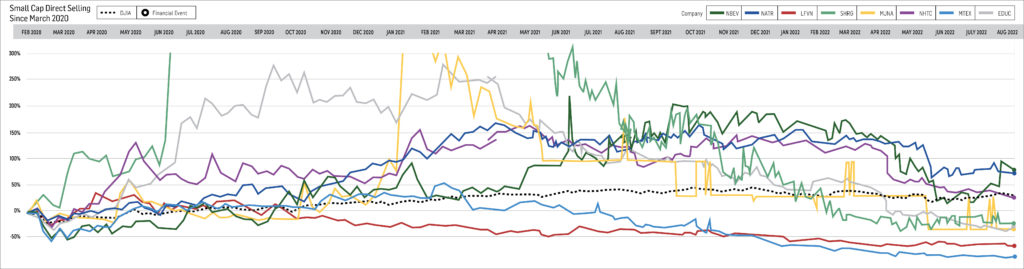
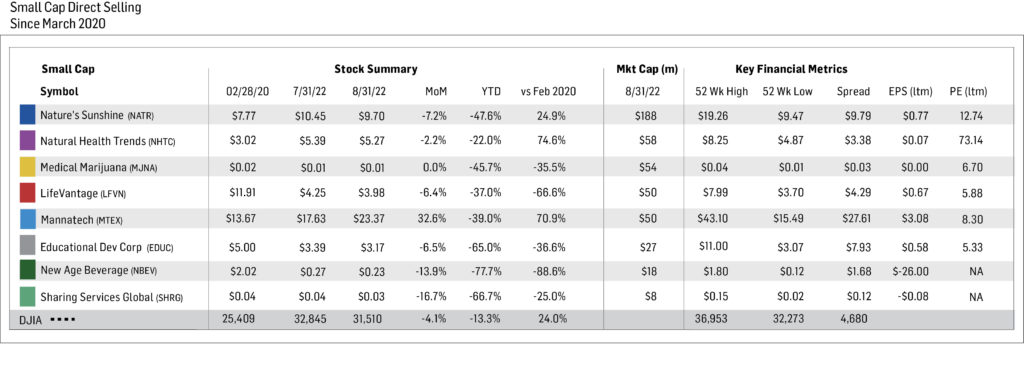
Short Interest Data & Analysis
The following chart is an aggregate index of “days to cover” among the entire tracking set. Days to cover (DTC) is a measurement determined by dividing the total outstanding short interest by average daily trading volume.
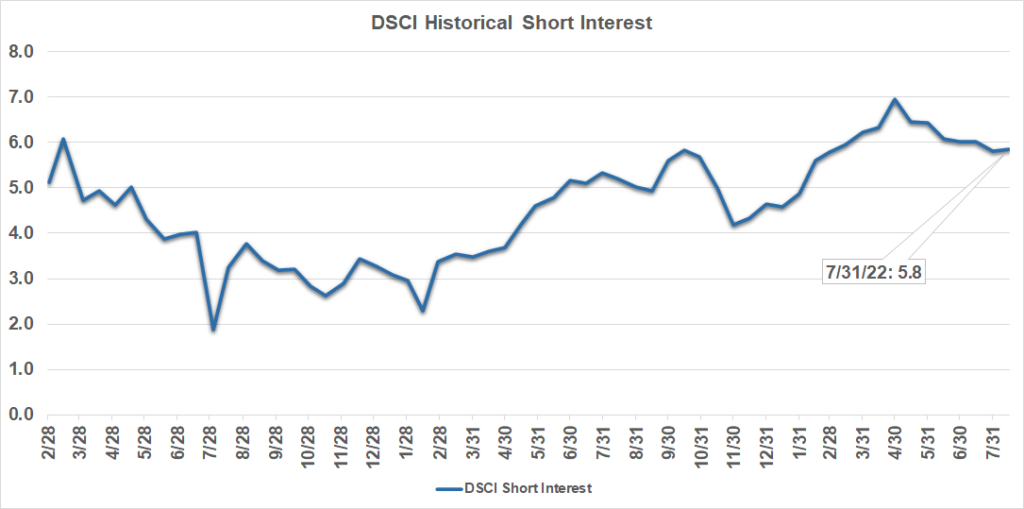
As indicated in the chart above, short interest in DSCI stocks was 5.8 days as of mid-August 2022, unchanged from the end of July and down from the index’s 6.9-day all-time high on April 30, 2022. The biggest absolute decrease in DTC from late July to mid-August for a DSCI component was EXPI’s drop from 13.9 days to 13.5 days. Aggregate “days-to-cover” have approximately tripled since bottoming in mid-February 2021.
Short interest can be a difficult indicator to analyze. On the one hand, an increase in short interest can be a bearish sign in that it indicates an increased view among investors that a stock is likely to decline based on any number of factors, such as a belief that the company’s fundamentals are deteriorating, or a belief that it has run too far too fast. On the other hand, as a stock moves higher, a significant short interest can serve as extra fuel on the fire as investors scramble to “buy to cover” their short positions and mitigate losses.
Analyst Sentiment Index
Our Analyst Sentiment Index was unchanged in August 2022 from July 2022. This qualitative index is not far from its late summer 2021 levels, the peak since the DSCI’s March 2020 establishment. During August, the proportion of sell-side analysts maintaining “buy” and “hold” ratings on industry stocks was 90%. Conversely, the percentage of stocks which analysts recommend selling equaled just 10%.
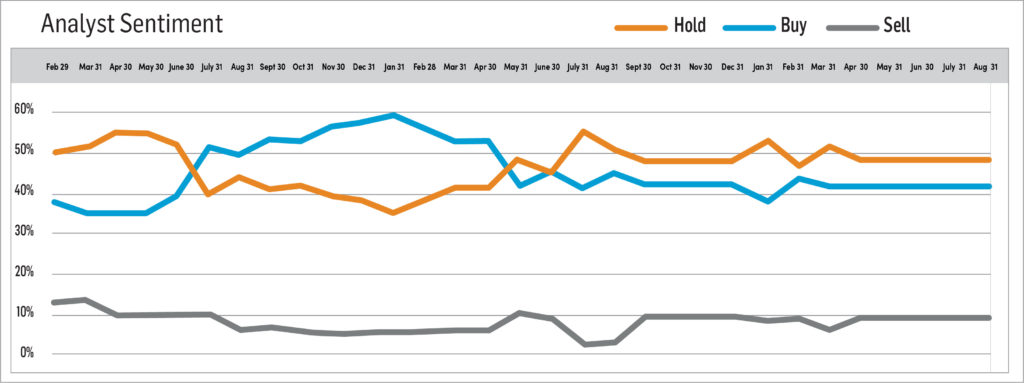
-
July 2022
Brought to you by Direct Selling Capital Advisors
In July, the Direct Selling Stocks Index Posts its Biggest Gain Since October 2021; DSCI Outperforms the DJIA During the Month
In July, the Direct Selling Capital Advisors Direct Selling Index (DSCI) posted its biggest monthly gain since October 2021. The index rose 7.0% during the month and now has increased for three successive months. (The DSCI rose 10.0% in October 2021.) Nevertheless, the index is still down about 40% from its mid-2021 peak. By comparison, the Dow Jones Industrial Average (DJIA) rose 6.7% in July. As a result, the DSCI slightly outperformed the overall stock market during the month.
The DSCI’s gains in July were broad-based. Six large cap components rose during the month, while only two fell and one was unchanged. Similarly, four small cap members gained, three declined and one did not vary in price. Even more encouraging, six DSCI components (four large caps and two small caps) increased by more than 10% in July. Only one member, small cap Educational Development Corporation (NASDAQ: EDUC) fell by more than that percentage.
From a longer-term perspective, the DSCI fell 14.0% over the first seven months of 2022, a wider loss than the 9.6% decline of the DJIA over the same period. However, the direct selling index has gained a cumulative 47.0% since its March 1, 2020 inception, and it has markedly outperformed the DJIA since that time. The DJIA has appreciated 29.3% since March 1, 2020.
After enduring one of the most disappointing stock market environments in many years in the first half of 2022—the broad S&P 500 Index was down 21% in that period, its worst first half performance since 1970—investors had adopted a decidedly pessimistic view toward equities and seemed to expect a very disappointing 2Q 2022 earnings season. When many key companies, including large cap tech firms, began reporting better-than-expected results and the Federal Reserve Board signaled that, at some point, it could tone down the magnitude of rate increases, investor sentiment rapidly swung to a more positive (maybe more correctly, less negative) stance. In turn, the S&P 500 rose 9.1% in July, its best month since November 2020.
Looking Forward
Of course, the stock market’s—and the direct selling index’s—gain in July does not mean that the dual problems of high inflation and potentially Fed-induced slower economic growth have been fully addressed. These concerns will almost certainly reappear as market touchpoints as economic data is released and updated. These data points will dictate the Fed’s next interest rate decisions.
DSCI components have begun reporting their 2Q 2022 earnings and the substance and tone of these releases will significantly impact stock-by-stock trading patterns. Both Herbalife Nutrition, Inc. (NYSE: HLF) and Tupperware Brands Corporation (NYSE: TUP), two companies which reported early in the cycle, issued well-received earnings reports. Herbalife’s business trends have stabilized since a difficult stretch in April; and Tupperware’s 2Q 2022 revenue and earnings markedly exceeded analysts’ projections. If other direct selling stocks can offer similar constructive accounts of business trends, the group could add to its strong July share price performance in August.
CHARTS & ANALYSIS
Direct Selling Capital Advisors Index
The DSCI is a market capitalization weighted index of all domestic public direct selling companies with a market capitalization of at least $25 million. The index is rebalanced monthly, and no single issue is permitted to represent more than 20% of its total value. In such an event, the excess weighting would be redistributed among the other index components.
The DSCI soared in July and slightly outperformed the DJIA during the month. Specifically, the DSCI gained 7.0% during July, while the DJIA gained 6.7%. Over the first seven months of 2022, the direct selling index and the DJIA fell 14.0% and 9.6%, respectively. DSCI data is tracked back to March 1, 2020. The index has risen 47.0% since that date versus a 29.3% gain for the DJIA. At its peak in June 2021, the index had risen 115.6% since inception.
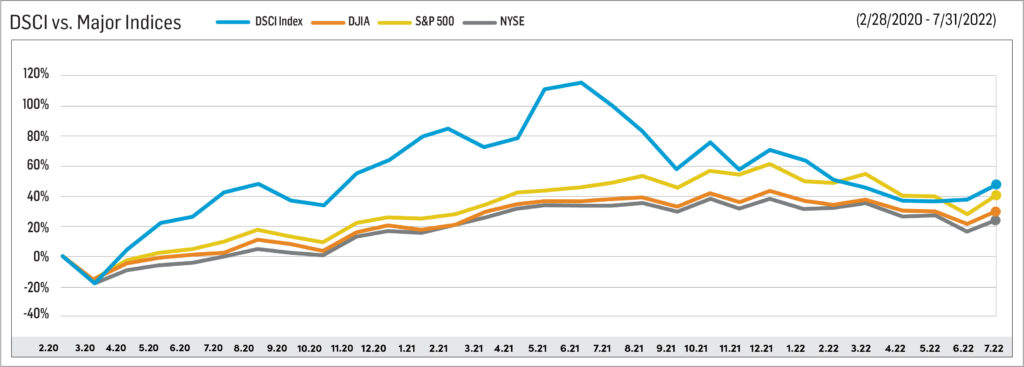
Large Cap
In July, Betterware de Mexico (NASDAQ: BWMX) stock posted its best monthly performance since April 2021, as it increased 16.2%. This gain ended a streak of five consecutive down months. In the first seven months of 2022, BMWX declined 52.1%. BWMX appreciated a remarkable 500+% from late March 2020 through early July 2021 but has declined about 80% since that peak.
BWMX’s 2Q 2022 revenue increased 25% versus 2Q 2021, but much of that gain stemmed from its April 7, 2022 acquisition of JAFRA, a leader in the beauty and personal care products industry. BWMX’s 2Q 2022 adjusted EPS was 5.99 Mexican Pesos (Ps.), down 48% from the year-ago period.
Separately, BWMX began a share repurchase program in February 2022, the company repurchased 72,626 shares in 1Q 2022. BWMX paused that program in the second quarter as it completed the JAFRA acquisition.
BWMX began trading in March 2020 after the company’s merger with SPAC sponsor DD3 Acquisition Corp. BWMX specifically targets the Mexican market; it serves three million households through distributors and associates in approximately 800 communities throughout Mexico.
Tupperware Brands Corporation (NYSE: TUP) jumped 17.7% in July, partially reversing a sizable three-month downturn. The stock had soared since the March 1, 2020 inception of the DSCI, but gave back much of those outsized gains in May 2022 when it fell more than 60% on a disappointing 1Q 2022 earnings report. Nevertheless, after factoring in its strong performance in July, TUP has gained 161.8% over the last 29 months, making it the second-best performing DSCI component over that period.
TUP reported 2Q 2022 net sales of $340.6 million, down 18% from $416.6 million in 2Q 2021 and adjusted diluted 2Q 2022 EPS of $0.41 versus $0.90 in the year-ago period. While both these key measures were lower than they were twelve months ago, each handily bested analysts’ consensus estimates. Lockdowns in China and shifts in consumer behavior in Europe significantly affected 2Q 2022 results.
In early June, TUP reached a deal to sell its Nutrimetics beauty business as part of its strategy of divesting non-core assets. Terms of the sale of Nutrimetics, which operates in Australia, New Zealand and France, were not disclosed.
Nu Skin Enterprises, Inc. (NYSE: NUS) gained 0.5% in July. Since the March 2020 establishment of the DSCI, NUS has appreciated 84.4%, significantly outperforming both the direct selling stock index (+47.0%) and the Dow Jones Industrial Average (+29.3%).
On August 4, NUS reported 2Q 2022 revenue of $560.5 million, down 20% versus $704.1 million in 2Q 2022. Earnings likewise fell in the quarter; 2Q22 adjusted EPS was $0.77 compared with $1.15 in the year-ago period. In light of heightened global uncertainties impacting its business, NUS reduced its full-year 2022 revenue and adjusted EPS guidance ranges to $2.33-$2.41 billion and $3.30-$3.60, respectively.
In mid-February, NUS increased its annual dividend rate to $1.54 from $1.52 per share. Its dividend yield is now 3.5%, more than twice that of the overall stock market.
Herbalife Nutrition, Inc. (NYSE: HLF) rose 19.4% in July, making it the second best performing DSCI member during the month. Nevertheless, HLF is still down 40.4% YTD. Since the March 2020 establishment of the DSCI, HLF has lost 24.6%. It is the only DSCI large cap stock trading continuously since index inception to post a loss over the last 29 months.
HLF’s 2Q 2022 net sales totaled $1.4 billion, down 10.3% compared with the year-ago period, but above the high end of management’s guidance. Perhaps more importantly, management asserted that HLF’s underlying business trends stabilized over the last two months of 2Q 2022 versus April levels. The company’s second quarter adjusted diluted EPS was $0.96 versus $1.55 in 2Q 2021.
HLF affirmed that its full-year 2022 revenue should decline 4%-10% versus 2021; however, management cut its 2022 EPS guidance to $3.25 to $3.75 from a $3.50-$4.00 range. HLF bought back 1.1 million shares in 2Q 2022 at an aggregate purchase price of $30.2 million.
Medifast, Inc. (NYSE: MED) lost 6.8% in July, making it the worst performing large cap index component during the month. This represents a complete flip from June when MED gained 8.3% which made it the best performing large cap DSCI member that month. Over the first seven months of 2022, MED declined 19.7%. Since the March 1, 2020 establishment of the DSCI, the stock has gained 111.6%, the third best appreciation of any index member. By comparison, the direct selling stock index and the Dow Jones Industrials have gained 47.0% and 29.3%, respectively, over the last 29 months.
On August 3, MED reported second-quarter 2022 revenue of $453.3 million, up 15.0% from 2Q 2021. Its 2Q 2022 diluted EPS was $3.42, down 13.6% from $3.96 in the year-ago period. Factoring in these results, management cut its full-year 2022 revenue guidance to $1.58-$1.66 billion from $1.78-$1.84 billion. The company also reduced its 2022 non-GAAP diluted EPS projection to $12.70-$14.10 from $14.60-$16.05. Macroeconomic factors such as inflation and consumer sentiment have impacted customer retention.
On June 1, MED implemented a $100 million accelerated share repurchase program. About 600,000 shares will be repurchased, equivalent to around 5% of total shares outstanding. About 480,000 were bought back as of June 30, 2022. After completion of this program, the company will still have Board authorization to buy back 1.4 million additional shares.
USANA Health Sciences, Inc. (NYSE: USNA) was one of only two DSCI large cap components to fall in July. The 3.8% decline during the month bumped its YTD loss to 31.2%. Since the March 2020 inception of the DSCI, USANA shares have gained 5.3%, which trails the returns of both the direct selling index and the DJIA.
USANA’s 2Q 2022 net sales were $264 million, down 21% from the 2Q 2021 level of $337 million. Diluted EPS in the quarter was $1.00 versus $1.87 in the year-ago period. USANA continues to experience COVID-related disruptions in several key markets, including mainland China. Management reiterated its full-year 2022 net sales and diluted EPS guidance ranges of $1.015-$1.065 billion and $3.85-$4.45, respectively.
eXp World Holdings, Inc. (NASDAQ: EXPI), the DSCI’s best performer since its March 2020 establishment and the index’s third largest member by stock market capitalization, was the index’s biggest gainer in July (+26.3%). This performance cut its YTD loss to 55.9%. Despite this correction in 2022, EXPI has rallied 210.9% since March 1, 2020.
EXPI’s 2Q 2022 revenue reached $1.4 billion, up 42% from 2Q 2021, and its gross profit in the period was $107.3 million, 34% ahead of the year-ago quarter. EXPI’s real estate transaction volume in 2Q 2022 was 44% higher than in 2Q 2021. As of June 30, 2022, the company’s global roster of brokers and agents reached 82,856.
In addition, EXPI, the fastest growing real estate brokerage firm in the world, repurchased around $50 million of its shares in 2Q 2022. On July 29, the company increased its quarterly dividend rate to $0.045 per share from $0.04 a share.
A leading provider of financial services in the U.S. and Canada, and the largest market cap stock in the DSCI, Primerica, Inc. (NYSE: PRI) rose 7.5% in July, reducing its YTD loss to 16.0%. PRI has gained 17.5% since the March 2020 establishment of the DSCI.
PRI’s 1Q 2022 total revenue increased 8% from the year-ago period. However, adjusted diluted earnings per share for the quarter fell 16% versus 1Q 2021. The earnings downturn was driven by a $15 million after-tax loss in the company’s Senior Health segment. The company plans to release its 2Q 2022 results after the stock market close on August 8.
Uncharacteristically, The Beachbody Company, Inc. (NYSE: BODY) stock was the least volatile large cap DSCI component in July; the stock finished the month unchanged. BODY was the worst performing large cap member in June and the best performer in May (-46.4% in June and +36.6% in May). BODY, a leading subscription health and wellness company has declined 49.4% YTD.
In early May, BODY released 1Q 2022 earnings. Revenue and adjusted EBITDA were $198.9 million and negative $19.1 million, respectively. Still soft at-home fitness demand affected results in the quarter. The company plans to release its 2Q 2022 earnings after the stock market close on August 8.
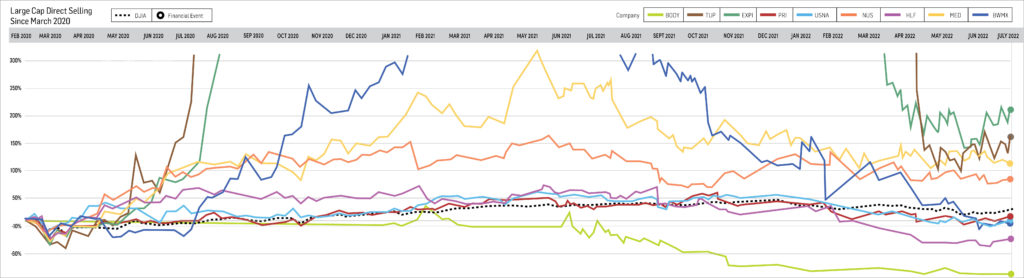
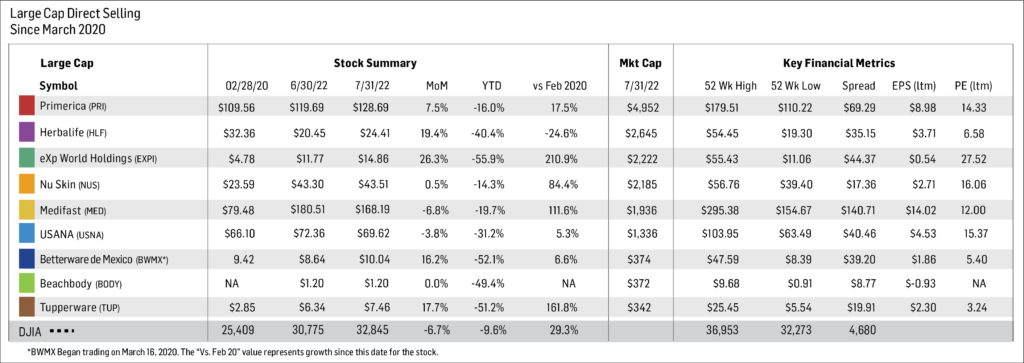
Small Cap
Our small cap tracking set rose during July, but its performance was generally more subdued than its large cap peers. Four of the eight small caps advanced during the month, while three declined and one was unchanged.
The top-performing small cap stock in July was NewAge, Inc. (NASDAQ: NBEV). NBEV, which is a direct seller of health and wellness, beauty, and nutritional performance products, gained 19.2% during the month. However, it is still down 74.1% YTD and 86.8% since the March 2020 DSCI inception.
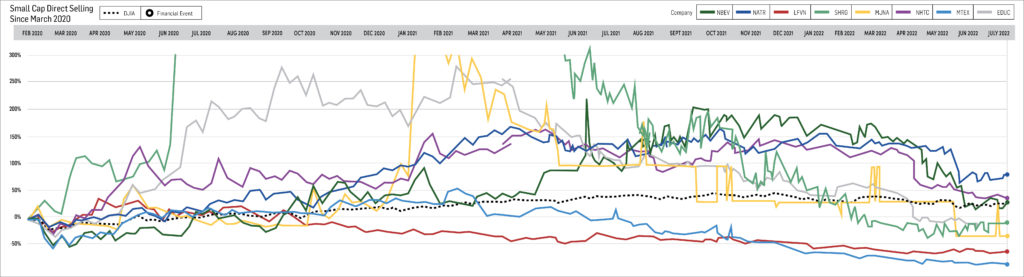
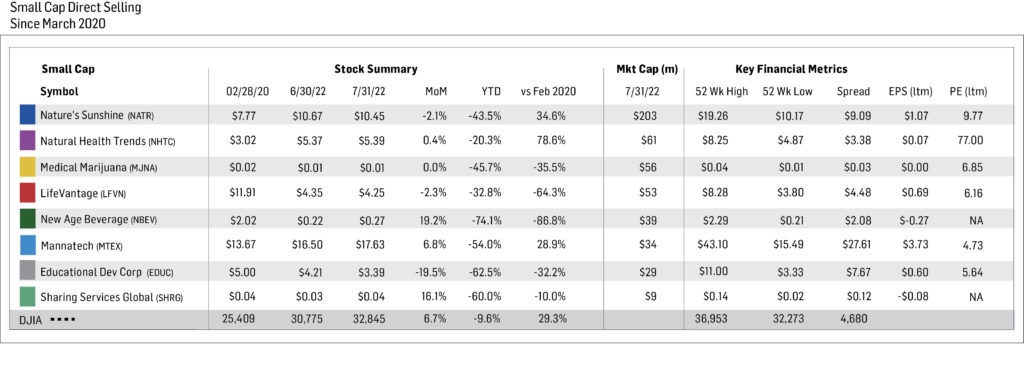
Short Interest Data & Analysis
The following chart is an aggregate index of “days to cover” among the entire tracking set. Days to cover (DTC) is a measurement determined by dividing the total outstanding short interest by average daily trading volume.
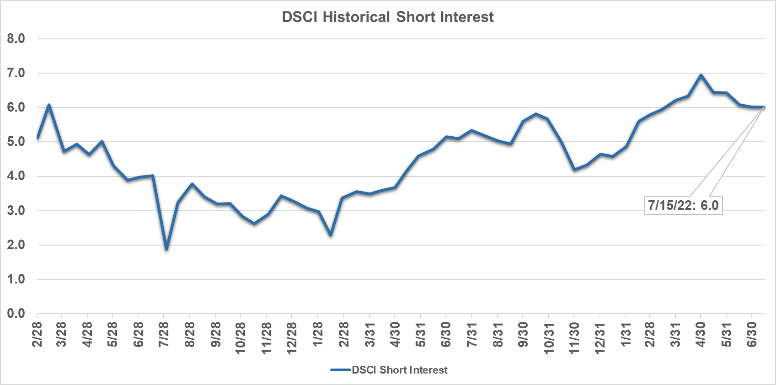
As indicated in the chart above, short interest in DSCI stocks was 6.0 days as of mid-July 2022, unchanged from the end of June and down from the index’s 6.9-day all-time high on April 30, 2022. The biggest absolute increase in DTC from late June to mid-July for a DSCI component was EXPI’s boost from 12.3 days to 13.1 days. Aggregate “days-to-cover” have approximately tripled since bottoming in mid-February 2021.
Short interest can be a difficult indicator to analyze. On the one hand, an increase in short interest can be a bearish sign in that it indicates an increased view among investors that a stock is likely to decline based on any number of factors, such as a belief that the company’s fundamentals are deteriorating, or a belief that it has run too far too fast. On the other hand, as a stock moves higher, a significant short interest can serve as extra fuel on the fire as investors scramble to “buy to cover” their short positions and mitigate losses.
Analyst Sentiment Index
Our Analyst Sentiment Index was unchanged in July 2022 from June 2022. This qualitative index is not far from its late summer 2021 levels, the peak since the DSCI’s March 2020 establishment. During July, the proportion of sell-side analysts maintaining “buy” and “hold” ratings on industry stocks was about 90%. Conversely, the percentage of stocks which analysts recommend selling equaled just 10%.
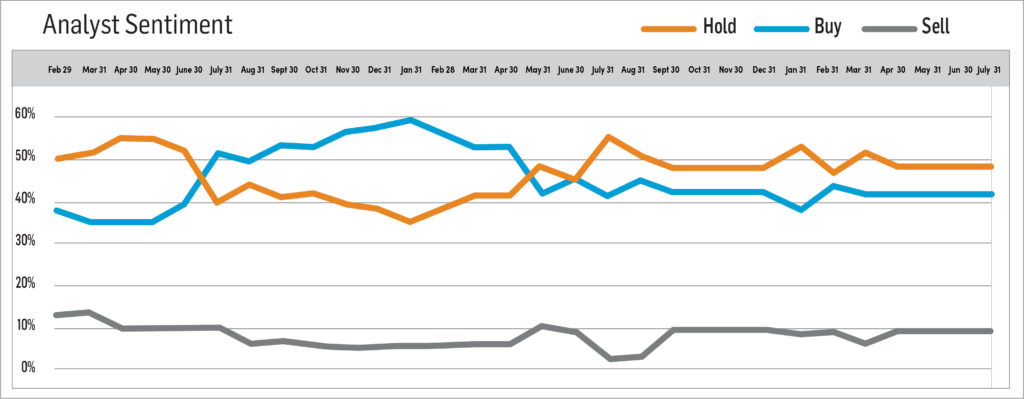
-
June 2022
Brought to you by Direct Selling Capital Advisors
Direct Selling Stocks Index Posts its Second Consecutive Slight Increase in June, Significantly Outperforms the DJIA During the Month.
In June, the Direct Selling Capital Advisors Direct Selling Index (DSCI) gained 0.2%, which nearly matched its 0.3% rise in May. The index is still down about 50% from its mid-2021 peak. By comparison, the Dow Jones Industrial Average (DJIA) fell 6.7% in June; consequently, the DSCI markedly outperformed the overall stock market during the month.
Despite the DSCI’s positive month in June, most of its individual components fell during the period. Two large cap components rose, while seven declined. Similarly, the shares of two small cap members increased in value, but six fell. There were significantly fewer double-figure percentage gainers than declining stocks during June. Only one component, micro-cap Sharing Services Global Corporation (OTC: SHRG), gained more than 10%, while eight members, three large caps and five small caps, fell by more than that percentage.
From a longer-term perspective, the DSCI fell 19.7% over the first half of 2022, compared with a 15.3% decline of the DJIA over the same period. Nevertheless, the direct selling index has gained a cumulative 37.4% since its March 1, 2020 inception, and it has outperformed the DJIA since that time. The DJIA has appreciated 21.1% since March 1, 2020.
As noted above, equities on the whole continued to struggle in June 2022. The broader S&P 500 declined around 8% during the month, bringing its 1H 2022 loss to about 21%, its worst first half performance in more than half a century. Investors focused on additional hot inflation readings that were announced during the month, particularly the 8.6% gain in the benchmark Consumer Price Index (CPI) for the twelve months ended May 2022. In turn, the Fed hiked interest rates 75 basis points (bp) in June, and a further 75-bp boost could be implemented in late July.
Other factors that have negatively affected commerce and the economy throughout much of 2022 continued to weigh on sentiment in June. These included the Russia-Ukraine conflict, high energy prices and COVID-related supply chain disruptions. A positive indicator toward the end of the month was reports that China is beginning to loosen pandemic restrictions in the key port city of Shanghai.
Looking Forward
DSCI components will begin reporting 2Q 2022 results in late July, and of course those results will significantly impact stock-by-stock trading patterns. In the lead-up to those reports, the performance of the overall stock market seems likely to dictate the performance of most DSCI components.
The broad stock market will focus on the tone of early earnings releases from S&P 500 companies. Consensus analyst projections point to the slowest rate of earnings growth since late 2020. In addition, the CPI for the twelve months ended June 2022 will be announced July 13. Any improvement in that inflation gauge would likely be warmly greeted by investors (and vice versa). Also, any change in oil and energy prices (from current uncomfortably high levels) could likewise quickly ripple through the stock market indices.
CHARTS & ANALYSIS
Direct Selling Capital Advisors Index
The DSCI is a market capitalization weighted index of all domestic public direct selling companies with a market capitalization of at least $25 million. The index is rebalanced monthly, and no single issue is permitted to represent more than 20% of its total value. In such an event, the excess weighting would be redistributed among the other index components.
The DSCI rose slightly in June and significantly outperformed the DJIA during the month. Specifically, the DSCI gained 0.2% during June, while the DJIA declined 6.7%. Over the first six months of 2022, the direct selling index and the DJIA fell 19.7% and 15.3%, respectively. DSCI data is tracked back to March 1, 2020. The index has risen 37.4% since that date versus a 21.1% gain for the DJIA. At its peak in June 2021, the index had risen 115.6% since inception.
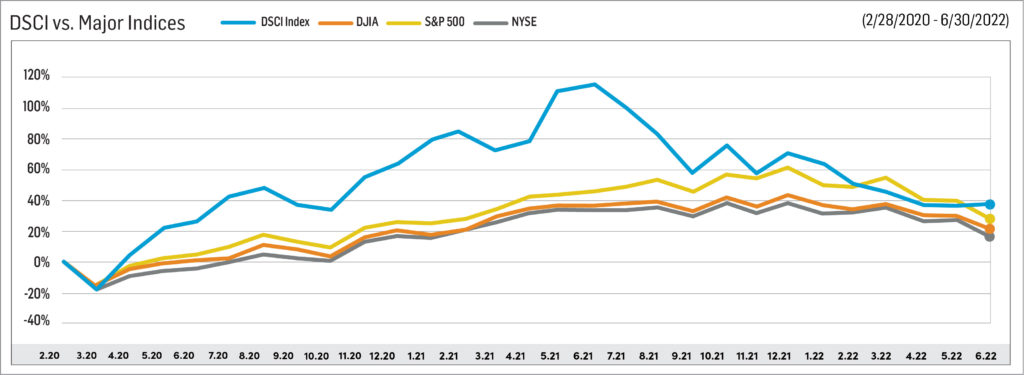
Large Cap
Betterware de Mexico (NASDAQ: BWMX) fell 38.2% in June, extending its string of consecutive down months to five. In the first half of 2022, BMWX lost 58.8% of its value. BWMX appreciated a remarkable 500+% from late March 2020 through early July 2021, but has declined more than 80% since that peak.
BWMX’s 1Q 2022 revenue and EBITDA declined 36% and 41%, respectively, versus 1Q 2021. More constructively, the company’s 1Q 2022 EBITDA margin increased more than 1,000 basis points sequentially from the weak fourth quarter of 2021.
Separately, BWMX began a share repurchase program in February 2022; so far, the company has repurchased 72,626 shares. Another positive: BWMX’s controlling shareholder, Campalier, S.A. de C.V., purchased 100,000 BWMX shares on the open market in June, which brings its ownership stake in the company to 53.6%.
BWMX began trading in March 2020 after the company’s merger with SPAC sponsor DD3 Acquisition Corp. BWMX specifically targets the Mexican market; it serves three million households through distributors and associates in approximately 800 communities throughout Mexico.
Tupperware Brands Corporation (NYSE: TUP) dropped 4.4% in June, marking its third consecutive monthly decline. The stock had soared since the March 1, 2020 inception of the DSCI but gave back much of those outsized gains in May when it fell more than 60% on a disappointing earnings report (see just below). Still, TUP has gained 122.5% over the last 28 months, making it the third best performing DSCI component over that period.
TUP’s 1Q 2022 net sales totaled $348.1 million, down 16% from the year-ago period, and adjusted diluted EPS was $0.12, an 85% decline from 1Q 2021. The Russia-Ukraine conflict, strict COVID lockdowns in China, and cost inflation dragged down 1Q 2022 results. In turn, TUP withdrew its 2022 financial guidance due to the high degree of operational uncertainty it faces.
In early June, TUP reached a deal to sell its Nutrimetics beauty business as part of its strategy of divesting non-core assets. Terms of the sale of Nutrimetics, which operates in Australia, New Zealand and France, were not disclosed.
Nu Skin Enterprises, Inc. (NYSE: NUS) fell 7.2% in June, approximately reversing a 9.4% gain in May. Since the March 2020 establishment of the DSCI, NUS has appreciated 83.5%, significantly outperforming both the direct selling stock index (+37.4%) and the Dow Jones Industrial Average (+21.1%).
NUS reported above-consensus 1Q 2022 results even though revenue and earnings per share declined 10.6% and 16.5%, respectively, from year-ago levels. For the full year 2022, NUS expects revenue to be approximately flat versus 2021. EPS in 2022 could slip 6% to 13% from 2021 adjusted profits per share of $4.14.
In mid-February, NUS increased its annual dividend rate to $1.54 from $1.52 per share. Its dividend yield is now 3.5%, about 2.5 times that of the overall stock market.
Herbalife Nutrition, Inc. (NYSE: HLF) fell 6.1% in June. While HLF dropped during the month, its performance broke a skein in which it declined by double-digit percentage points for four consecutive months. Year to date, HLF is down 50.0%. Since the March 2020 establishment of the DSCI, HLF has lost 36.8%, the worst performance of any DSCI large cap stock which has been trading continuously since index inception.
HLF’s 1Q 2022 revenue fell 11.0% on a year-over-year basis to $1.3 billion, and its adjusted diluted EPS in the quarter was $0.99, down from $1.42 in 1Q 2021. Unfavorable foreign exchange rates and geographic revenue mix significantly affected HLF’s top line during the quarter.
In turn, the company lowered its full-year 2022 revenue and adjusted diluted EPS projections. HLF now expects 2022 revenue to decline 4% to 10% versus prior growth expectations of 0% to 6%. Similarly, management cut its 2022 EPS guidance to a $3.50-$4.00 range.
Medifast, Inc. (NYSE: MED) gained 8.3% in June, making it the best performing large cap index component during the month. Over the first half of 2022, MED declined 13.8%. Since the March 1, 2020 establishment of the DSCI, the stock has gained 127.1%, the second largest appreciation of any index member. By comparison, the direct selling stock index and the Dow Jones Industrials have gained 37.4% and 21.1%, respectively, over the last two years and four months.
MED’s first-quarter 2022 revenue and diluted EPS increased 21.7% and 3.8%, respectively, compared with the year-ago period. MED management projects full-year 2022 revenue and diluted EPS will range from $1.78-$1.84 billion and $14.60-$16.05, respectively.
On June 1, MED implemented a $100 million accelerated share repurchase program. About 600,000 shares will be repurchased, equivalent to around 5% of total shares outstanding. After completion of this program, the company will still have Board authorization to buy back 1.4 million additional shares.
USANA Health Sciences, Inc. (NYSE: USNA) was one of only two DSCI large cap components to gain during June. Its 2.9% rise during the month cut its YTD losses to 28.5%. Since the March 2020 inception of the DSCI, USANA shares have gained 9.5%, which trails the returns of both the direct selling index and the DJIA.
USANA’s 1Q 2022 net sales declined 11% from 1Q 2021 levels. Diluted EPS in the quarter was $1.15, also down from the year-ago period, but up 12% sequentially. Weaker than expected net sales around the Lunar New Year holiday in a few key Asia Pacific markets impacted first quarter results. Management’s full-year 2022 net sales and diluted EPS guidance ranges are $1.1-$1.2 billion and $5.00-$5.70, respectively.
eXp World Holdings, Inc. (NASDAQ: EXPI), the DSCI’s best performer since its March 2020 establishment and the index’s fifth largest member by stock market capitalization, fell by double-figure percentage points (-15.7%) for the second time in three months (it also fell 36.8% in April). This brings EXPI’s YTD loss to 65.1%. Despite this marked loss over the first half of 2022, EXPI has rallied 146.2% since March 1, 2020.
EXPI’s net sales and real estate transaction volume in 1Q 2022 increased 73% and 69%, respectively, versus year-ago figures. The company’s Board authorized $20 million in monthly stock repurchases beginning in May 2022, up from $10 million previously.
In June, EXPI, the fastest growing real estate brokerage firm in the world, announced a deal to acquire Zoocasa, a Toronto, Canada-based real estate search portal and brokerage firm. Zoocasa’s 150 in-house real estate agents will add to EXPI’s total roster of more than 80,000 agents.
A leading provider of financial services in the U.S. and Canada and the largest market cap stock in the DSCI, Primerica, Inc. (NYSE: PRI), fell 5.0% in May, adding to its YTD loss of 21.9%. PRI has gained 9.2% since the March 2020 establishment of the DSCI.
PRI’s 1Q 2022 total revenue increased 8% from the year-ago period. However, adjusted diluted earnings per share for the quarter fell 16% versus 1Q 2021. The earnings downturn was driven by a $15 million after-tax loss in the company’s Senior Health segment.
During 1Q 2022, PRI bought back more than 710,000 shares of its stock at a cost of $99 million. The company plans to repurchase $306 million of its shares over the full year 2022.
One month after it posted the best results of any large cap member of the DSCI, The Beachbody Company, Inc. (NYSE: BODY) stock was the worst performing component in June (-46.4% in June and +36.6% in May). BODY, a leading subscription health and wellness company, and perhaps the most volatile DSCI component, has declined 49.4% YTD.
In early May, BODY released 1Q 2022 earnings. Revenue and adjusted EBITDA were $198.9 million and negative $19.1 million, respectively. Still soft at-home fitness demand affected results in the quarter. For the full-year 2022, BODY expects its combined adjusted EBITDA loss and capital expenditures (an approximation of overall cash outflow) to be noticeably lower versus 2021 levels.
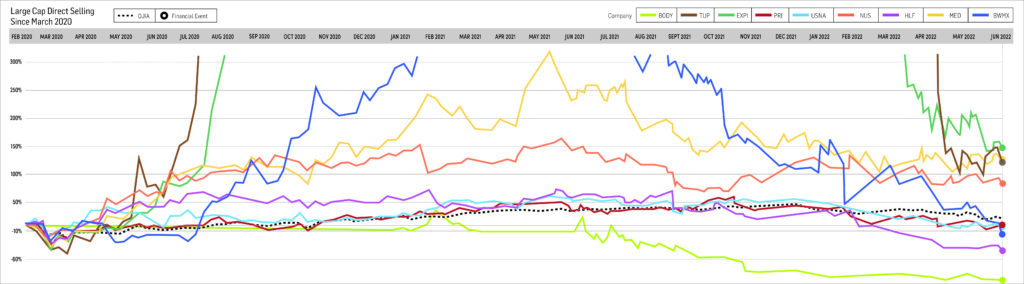
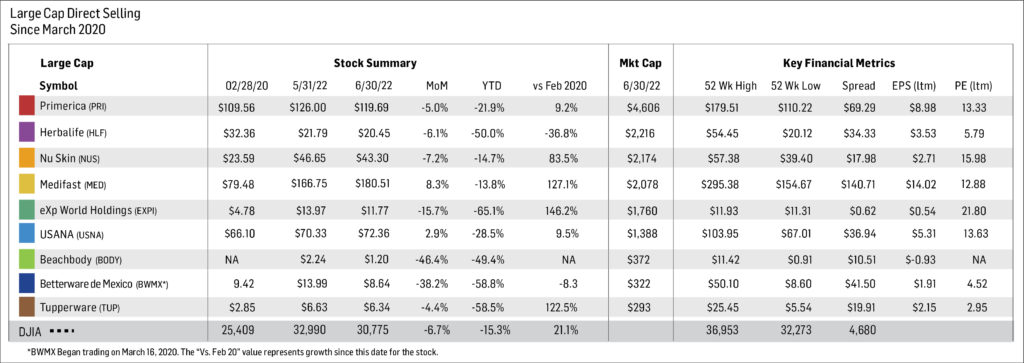
Small Cap
Our small cap tracking set generally mirrored the performance of its large cap peers in June. Two of the eight small caps advanced during the month, while six declined.
The top-performing small cap stock since index inception, Natural Health Trends Corp. (NASDAQ: NHTC), declined 22.5% during June. Since March 1, 2020, the maker of personal care and wellness products has gained 77.9%. In 1Q 2022, NHTC reported revenue of $11.5 million and a net loss of one cent per diluted share versus sales of $13.5 million and earnings of positive one cent per share in the year-ago period.
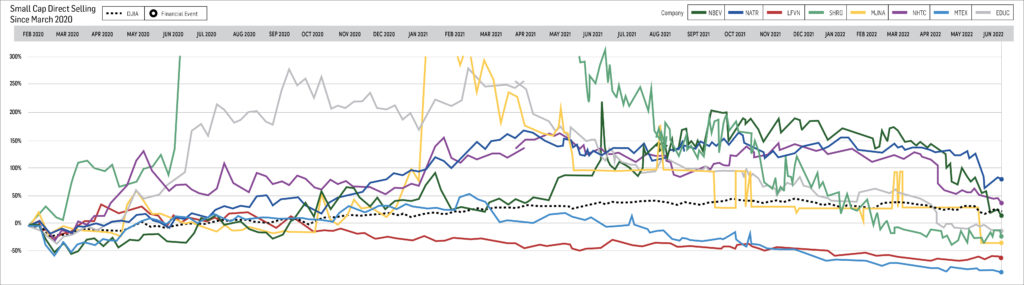
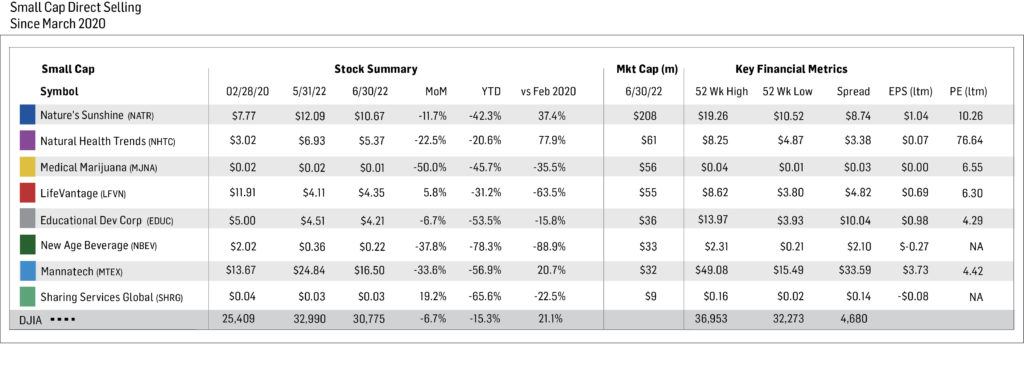
Short Interest Data & Analysis
The following chart is an aggregate index of “days to cover” among the entire tracking set. Days to cover (DTC) is a measurement determined by dividing the total outstanding short interest by average daily trading volume.
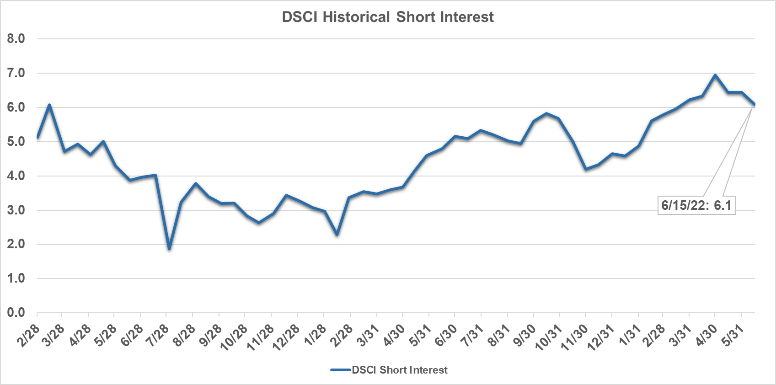
As indicated in the chart above, short interest in DSCI stocks declined to 6.1 days as of mid-June 2022, down from 6.4 days at the end of May and the index’s 6.9-day all-time high as of April 30, 2022. A reduction in USNA’s DTC to 7.1 days in mid-June from 7.6 days at May 31 was the biggest contributor to the overall decrease in the index’s DTC statistic. Aggregate “days-to-cover” have approximately tripled since bottoming in mid-February 2021.
Short interest can be a difficult indicator to analyze. On the one hand, an increase in short interest can be a bearish sign in that it indicates an increased view among investors that a stock is likely to decline based on any number of factors, such as a belief that the company’s fundamentals are deteriorating, or a belief that it has run too far too fast. On the other hand, as a stock moves higher, a significant short interest can serve as extra fuel on the fire as investors scramble to “buy to cover” their short positions and mitigate losses.
Analyst Sentiment Index
Our Analyst Sentiment Index was unchanged in June 2022 from May 2022. This qualitative index is not far from its late summer 2021 levels, the peak since the DSCI’s March 2020 establishment. During June, the proportion of sell-side analysts maintaining “buy” and “hold” ratings on industry stocks was about 90%. Conversely, the percentage of stocks which analysts recommend selling equaled just 10%.
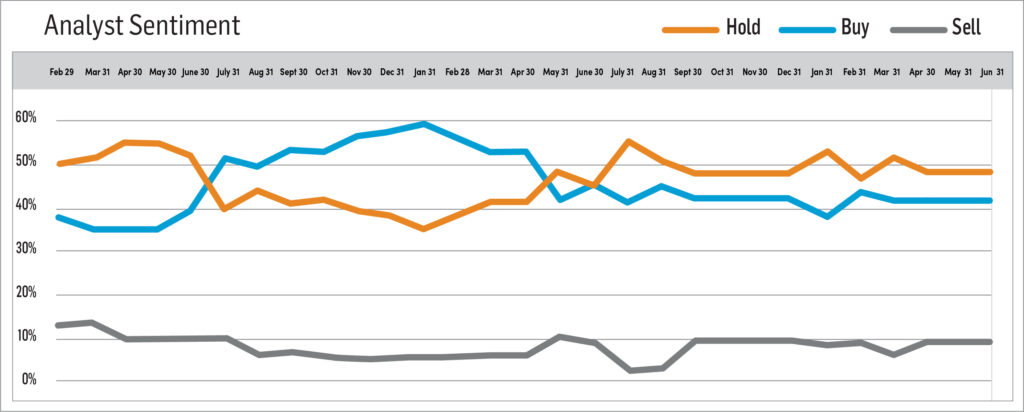
-
May 2022
Brought to you by Direct Selling Capital Advisors
Direct Selling Stocks Index Ekes Out 0.3% Gain in May, Breaking a Four-Month String of Declines
In May, the Direct Selling Capital Advisors Direct Selling Index (DSCI) inched 0.3% higher, which marked its first monthly increase of 2022. The index is down about 50% from its mid-2021 peak. By comparison, the Dow Jones Industrial Average (DJIA) was unchanged in May; consequently, the DSCI modestly outperformed the overall stock market during the month.
Despite the DSCI’s positive month in May, most of its individual components fell during the period. Three large cap components rose, while six declined. Furthermore, the shares of only one small cap member increased in value, but six of the small caps fell. One small cap was unchanged during the month. Similarly, there were significantly fewer double figure percentage gainers than declining stocks during May. Only large cap member The Beachbody Company, Inc. (NYSE: BODY) gained more than 10%, while seven members, three large caps and four small caps, fell by more than that percentage.
From a longer-term perspective, the DSCI fell 19.8% over the first five months of 2022, about double the 9.2% decline of the DJIA over the same period. Nevertheless, the direct selling index has gained a cumulative 37.1% since its March 1, 2020 inception, and it has outperformed the DJIA since that time. The DJIA has appreciated 29.8% since March 1, 2020.
May 2022 was a tumultuous month for stock market investors as sentiment shifted dramatically from quite bearish in the first half of the month to a more bullish stance in the latter half of the period. The Fed hiked interest rates 50 basis points at the start of May to begin to address far-too-hot inflation conditions. In turn, this tightening seemed to fan investors’ fears that an economic decline or even a recession could follow in fairly short order. Earnings reports released in mid-May by Walmart and Target, in which the companies noted a pullback in discretionary spending, added to these concerns.
However, in the final two weeks of May, many investors concluded that stocks had reached “oversold” conditions as the stock market flirted with a 20% decline. In addition, rumors began to spread that the Fed may consider pausing its planned series of rate increases in late summer or early fall to assess the potency of the early hikes in curbing inflation. This potential pause prompted many short sellers to cover their positions and speculative-mined investors to buy stocks. In the end, stock indices ended unchanged on the month.
Looking Forward
The performance of DSCI component stocks is likely to be closely linked to the performance of the overall stock market for much of June and July. The direct selling companies have all reported their March quarterly earnings, and little individual company news is likely to be released until 2Q 2022 results begin to be released in late July. (A constructive exception is Medifast, Inc.’s [NYSE: MED] early June announcement of an accelerated share repurchase program.)
While predicting the near-term direction of the stock market is an extremely difficult task given conflicting macroeconomic indicators and rapidly changing geopolitical considerations, a near certainty appears to be a continuing pattern of volatility in both indices and individual stock prices. Indeed, both the DJIA and the broader S&P 500 Index traded in approximate 10% ranges during the month of May. Such ranges are extremely broad for a single trading month.
CHARTS & ANALYSIS
Direct Selling Capital Advisors Index
The DSCI is a market capitalization weighted index of all domestic public direct selling companies with a market capitalization of at least $25 million. The index is rebalanced monthly, and no single issue is permitted to represent more than 20% of its total value. In such an event, the excess weighting would be redistributed among the other index components.
The DSCI rose in May and modestly outperformed the DJIA during the month. Specifically, the DSCI gained 0.3% during May, while the DJIA was little changed. Over the first five months of 2022, the direct selling index and the DJIA fell 19.8% and 9.2%, respectively. DSCI data is tracked back to March 1, 2020. The index has risen 37.1% since that date versus a 29.8% gain for the DJIA. At its peak in June 2021, the index had risen 115.6% since inception.
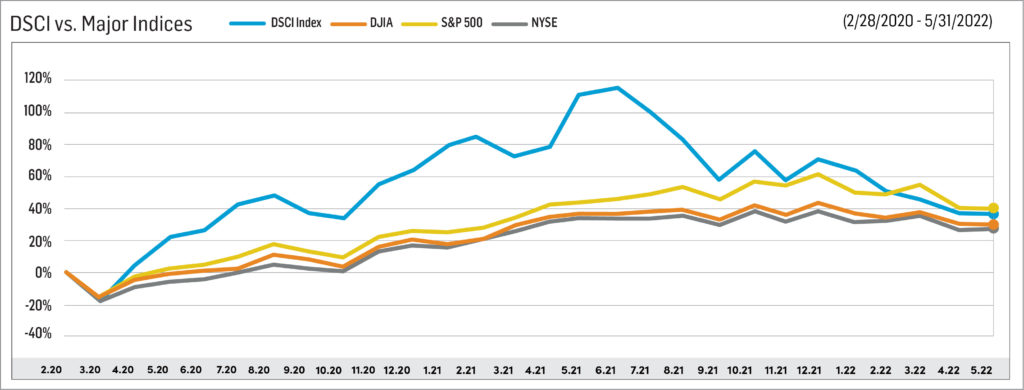
Large Cap
Betterware de Mexico (NASDAQ: BWMX) fell 12.2% in May, marking its fourth consecutive down month. Over the first five months of 2022, BMWX has lost about a third of its value. BWMX appreciated a remarkable 500+% from late March 2020 through early July 2021, but has declined nearly 75% since that peak.
In late April, BWMX reported that 1Q 2022 revenue and EBITDA declined 36% and 41%, respectively, versus 1Q 2021. More constructively, the company’s 1Q 2022 EBITDA margin increased more than 1,000 basis points sequentially from the weak fourth quarter of 2021. Separately, BWMX began a share repurchase program in February 2022; so far, the company has repurchased 72,626 shares.
BWMX began trading in March 2020 after the company’s merger with SPAC sponsor DD3 Acquisition Corp. BWMX specifically targets the Mexican market; it serves three million households through distributors and associates in approximately 800 communities throughout Mexico.
Tupperware Brands Corporation (NYSE: TUP) was, by a wide margin, the weakest component of the DSCI in May, falling 62.3%. Coupled with a near 10% decline in April, the stock has lost much of the outsized gains it registered since the March 1, 2020 inception of the index. Still, TUP has gained 132.6% over the last 2¼ years, making it the second best performing DSCI component over that period.
In early May, TUP reported disappointing 1Q 2022 earnings. Net sales were $348.1 million, down 16% from the year-ago period, and adjusted diluted EPS was $0.12, an 85% decline from 1Q 2021. The Russia-Ukraine conflict, strict COVID lockdowns in China and cost inflation dragged down 1Q 2022 results. In turn, TUP withdrew its 2022 financial guidance due to the high degree of operational uncertainty it faces.
Nu Skin Enterprises, Inc. (NYSE: NUS) rose 9.4% in May, marking the fifth month in the past six that it outperformed the DSCI benchmark. Since the March 2020 establishment of the index, NUS has appreciated 97.7%, significantly outperforming both the direct selling stock index (+37.1%) and the Dow Jones Industrial Average (+29.8%).
In early May, NUS reported above-consensus 1Q 2022 results, even though revenue and earnings per share declined 10.6% and 16.5%, respectively, from year-ago levels. For the full year 2022, NUS expects revenue to be approximately flat versus 2021. EPS in 2022 could range from $3.60 to $3.90, down from 2021 adjusted profits per share of $4.14.
In mid-February, NUS increased its annual dividend rate to $1.54 from $1.52 per share. Its dividend yield is now 3.3%, about twice that of the overall stock market.
Herbalife Nutrition, Inc. (NYSE: HLF) fell 18.0% in May. The stock has declined by double-digit percentage points for four successive months, which brings its YTD loss to 46.8%. Since the March 2020 establishment of the DSCI, HLF has lost 32.7%.
In early May, HLF announced disappointing 1Q 2022 results. Revenue fell 11.0% year-over-year during the quarter to $1.3 billion, and adjusted diluted 1Q 2022 EPS was $0.99, down from $1.42 in 1Q 2021. Unfavorable foreign exchange rates and geographic revenue mix significantly affected HLF’s top line during the quarter.
In response, the company rebased its full-year 2022 revenue and adjusted diluted EPS lower. HLF now expects 2022 revenue to decline 4% to 10% versus prior growth expectations of 0% to 6%. Similarly, management cut its 2022 EPS guidance to $3.50 to $4.00.
Medifast, Inc. (NYSE: MED) fell 6.5% in May. Over the first five months of 2022, MED has declined 20.4%. Since the March 1, 2020 establishment of the DSCI, the stock has gained 109.8%, the fourth largest appreciation of any index member. By comparison, the direct selling stock index and the Dow Jones Industrials have gained 37.1% and 29,8%, respectively over the last 2 ¼ years.
In early May, MED reported robust 1Q 2022 earnings results. Revenue and diluted EPS increased 21.7% and 3.8%, respectively, compared with the year-ago period. MED management now projects full-year 2022 revenue and diluted EPS in the ranges of $1.78 billion to $1.84 billion and $14.60 to $16.05, respectively.
On June 1, MED implemented a $100 million accelerated share repurchase program. About 600,000 shares will be repurchased, equivalent to around 5% of total shares outstanding. After completion of this program, the company will still have Board authorization to buy back 1.4 million additional shares.
USANA Health Sciences, Inc. (NYSE: USNA) lost 8.3% in May, adding to YTD losses of 30.5%. Since the March 2020 inception of the DSCI, USANA shares have gained 6.4%, which trails the returns of both the direct selling index and the DJIA.
In late April, USANA reported that 1Q 2022 net sales were $273 million, down 11% from 1Q 2021 levels. Diluted EPS in 1Q 2022 was $1.15, also down from the year-ago period, but up 12% sequentially. Weaker than expected net sales around the Lunar New Year holiday in a few key Asia Pacific markets impacted first quarter results. Management’s full-year 2022 net sales and diluted EPS guidance ranges are now $1.1 billion-$1.2 billion and $5.00-$5.70, respectively.
eXp World Holdings, Inc. (NASDAQ: EXPI), the DSCI’s best performer since its March 2020 establishment and the index’s fourth largest member by stock market capitalization, partially rebounded in May (+4.3%) from a sharp drop in April (-36.8%). EXPI’s YTD loss is now 58.5%. Despite this performance over the last five months, EXPI has rallied 192.3% since March 1, 2020.
In early May, EXPI, the fastest growing real estate brokerage in the world, reported strong 1Q 2022 results; net sales and real estate transaction volume increased 73% and 69%, respectively, versus 1Q 2021 figures. EXPI’s Board authorized $20 million in monthly stock repurchases beginning in May 2022, up from $10 million previously.
Last month, EXPI opened a real estate brokerage in New Zealand, marking the 21st country in which it has established operations. The company’s real estate agent roster now exceeds 80,000.
The largest market cap stock in the DSCI, Primerica, Inc. (NYSE: PRI), declined 2.7% in May, bringing its YTD loss to 17.8%. PRI has gained 15.0% since the March 2020 establishment of the DSCI.
In early May, PRI, a leading provider of financial services in the U.S. and Canada, reported mixed 1Q 2022 results. Total revenue increased 8% from 1Q 2021. However, adjusted diluted earnings per share in 1Q 2022 fell 16% from the year-ago period. The earnings downturn was driven by a $15 million after-tax loss in the company’s Senior Health segment.
During 1Q 2022, PRI bought back more than 710,000 shares of its stock at a cost of $99 million. The company plans to repurchase $306 million of its shares during the full-year 2022.
The Beachbody Company, Inc. (NYSE: BODY) stock soared 36.6% in May, making it the top performing DSCI component during the month and more than reversing a 27.8% decline in April. BODY, a leading subscription health and wellness company, has declined 5.5% YTD.
On May 9, BODY released 1Q 2022 earnings. Revenue and adjusted EBITDA were $198.9 million and negative $19.1 million, versus $226.2 million and a loss of $11.7 million, respectively, in 1Q 2021. Continued soft at-home fitness demand affected 1Q 2022 results. For the full-year 2022, BODY expects its combined adjusted EBITDA loss and capital expenditures (an approximation of overall cash outflow) to be noticeably lower versus 2021 levels.
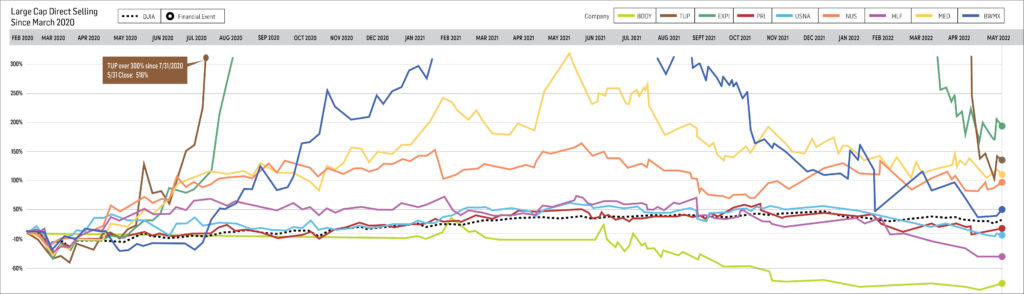
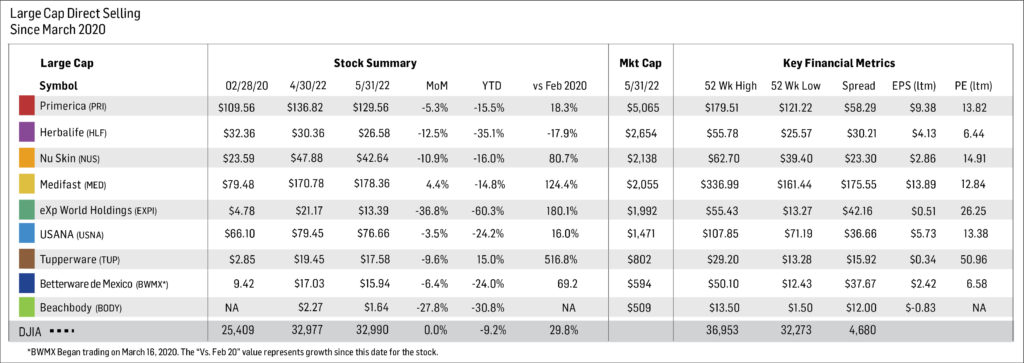
Small Cap
Our small cap tracking set generally trailed the performance of its large cap peers in May. Six of the eight small caps declined during the month, and one member was unchanged. The lone small cap to rise during the month (+5.4%) was LifeVantage Corporation (NASDAQ: LFVN), a pioneering company in the study of how nutrition and naturally occurring compounds affect human genes to support good health. In the quarter ended March 31, 2022, LFVN recorded $50.0 million of revenue and $0.09 of diluted EPS versus $51.5 million and $0.12, respectively, in the year-ago period. LFVN stock is down 35.0% YTD.
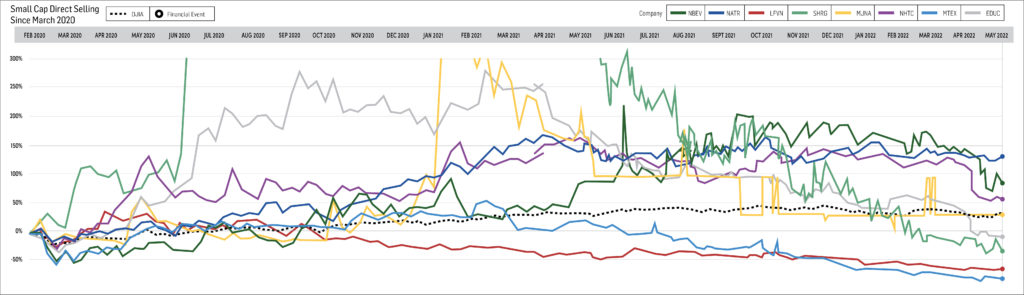
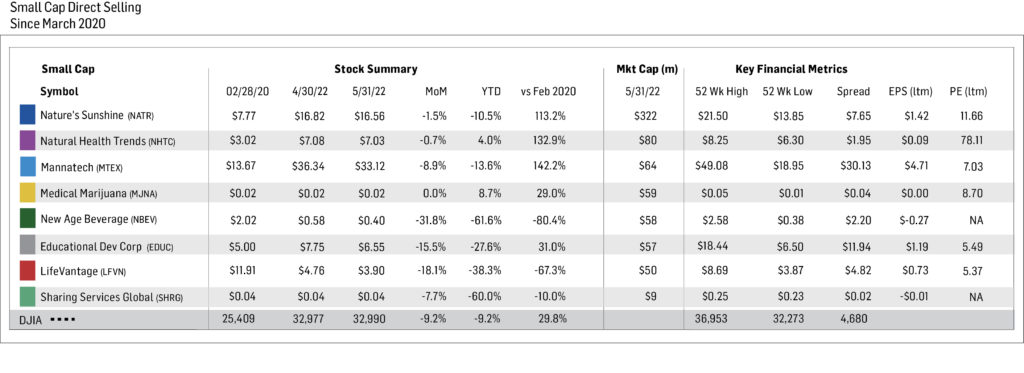
Short Interest Data & Analysis
The following chart is an aggregate index of “days to cover” among the entire tracking set. Days to cover (DTC) is a measurement determined by dividing the total outstanding short interest by average daily trading volume.
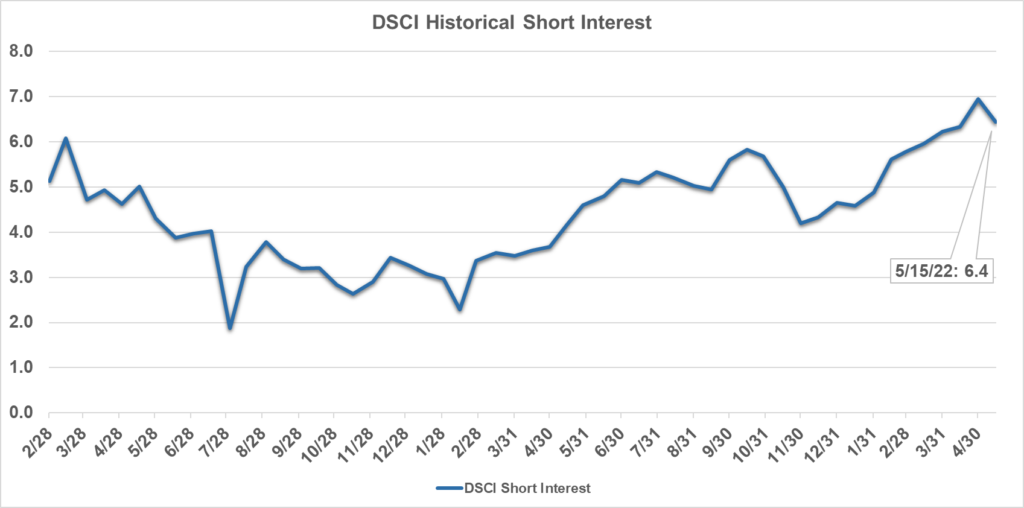
As indicated in the chart above, short interest in DSCI stocks reached 6.4 days as of mid-May 2022, besting the index’s previous all-time high of 6.9 days set just two weeks earlier. A boost in NUS’s DTC to 7.4 days in mid-May from 4.1 days in mid-April was the biggest contributor to the overall increase in the index’s DTC statistic. Aggregate “days-to-cover” have nearly tripled since bottoming in mid-February 2021.
Short interest can be a difficult indicator to analyze. On one hand, an increase in short interest can be a bearish sign in that it indicates an increased view among investors that a stock is likely to decline based on any number of factors, such as a belief that the company’s fundamentals are deteriorating, or a belief that it has run too far too fast. On the other hand, as a stock moves higher, a significant short interest can serve as extra fuel on the fire as investors scramble to “buy to cover” their short positions and mitigate losses.
Analyst Sentiment Index
Our Analyst Sentiment Index retreated slightly in May 2022 from April 2022. Nevertheless, this qualitative index is not far from its late summer 2021 levels, the peak since the DSCI’s March 2020 establishment. During May, the proportion of sell-side analysts maintaining “buy” and “hold” ratings on industry stocks was about 90%. Conversely, the percentage of stocks which analysts recommend selling equaled just 10%.
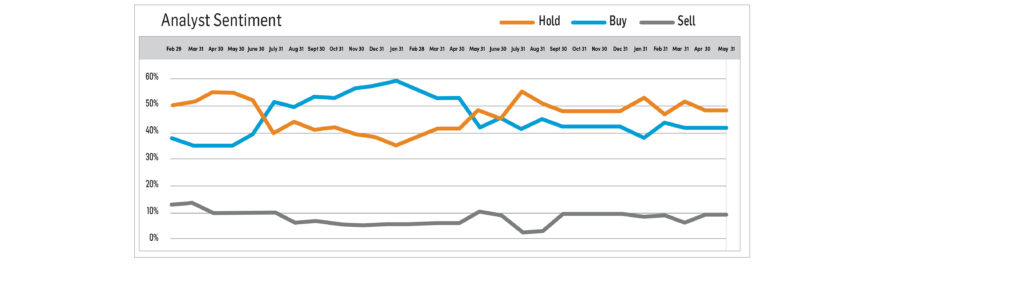
-
April 2022
Brought to you by Direct Selling Capital Advisors
Direct Selling Stocks Index Drops 5.4% in April, its Fourth Successive Monthly Decline
The Direct Selling Capital Advisors Direct Selling Index (DSCI) declined 5.4% in April. The index has lost value every month thus far in 2022, and it is down about 50% from its peak in mid-2021. The Dow Jones Industrial Average (DJIA) fell by a roughly similar percentage, 4.9%, in March, marking its third down month in four in 2022. Consequently, the DSCI modestly underperformed the overall stock market during April.
The DSCI decline was broad-based in April. Only one of its 17 components, large cap Medifast, Inc. (NYSE: MED), notched a gain in the month, while seven members (four large caps and three small caps) recorded double-figure percentage point losses.
From a longer-term perspective, the DSCI fell 20.1% over the first four months of 2022, about double the 9.2% decline of the DJIA over the same period. Nevertheless, the direct selling index has gained a cumulative 36.6% since its March 1, 2020 inception, and it has outperformed the DJIA since that time. The DJIA has appreciated 29.8% since March 1, 2020.
April 2022 constituted the worst month for stock market indices since the March 2020 panic sell-off over the initial reports of COVID-19. The broader S&P 500 Index lost 8.8% during the month, considerably more than the DJIA.
The culprit for all this: in a word, inflation. Fears regarding the fastest pace of CPI growth in 40 years, as well as the coming medicine to brake the pace of price increases—a series of Fed rate increases over an indeterminate period—are spooking investors. Contributing to all this are China’s decision to impose severe COVID lockdowns, including in the major port city of Shanghai and Russia’s invasion of Ukraine. Both are causing/worsening supply chain disruptions in energy and food, which in turn feed inflationary pressures and cut into corporate profits. It is unclear when either situation, particularly the Russia-Ukraine war, will take a constructive turn.
Looking Forward
The DSCI could turn higher if the overall stock market can begin to perform better than it has over the first four months of 2022. After all, DSCI components are generally considered to have higher risk-reward characteristics than the broad market.
The direction of the stock market will likely be dictated in the near and intermediate terms by whether investors believe that the Federal Reserve can raise short-term interest rates sufficiently to quell inflationary pressures, but not too much as to cause an economic slowdown. The central bank boosted the federal funds rate by 50 basis points on May 4, its largest rate hike in more than 20 years, and outlined plans to reduce its giant bond holdings (quantitative tightening). Investors’ initial reaction was quite positive; the DJIA and the S&P 500 Index each rose nearly 3% on the news. If the stock market can build on these gains over the next few weeks, investors’ sentiments could shift toward a more constructive stance and away from the fairly pessimistic view that has prevailed for much of the first four months of 2022.
DSCI member companies began reporting 1Q 2022 earnings about a week ago, and the results have been mixed. Most concerning are the weaker than expected results of index bellwethers Tupperware Brands Corporation (NYSE: TUP) and Herbalife Nutrition, Inc. (NYSE: HLF). Increased operating uncertainties prompted TUP to withdraw its previously issued 2022 financial guidance and HLF to markedly reduce its 2022 sales and earnings projections.
CHARTS & ANALYSIS
Direct Selling Capital Advisors Index
The DSCI is a market capitalization weighted index of all domestic public direct selling companies with a market capitalization of at least $25 million. The index is rebalanced monthly, and no single issue is permitted to represent more than 20% of its total value. In such an event, the excess weighting would be redistributed among the other index components.
The DSCI fell in April and slightly underperformed the DJIA during the month. Specifically, the DSCI lost 5.4% during April, while the DJIA declined 4.9%. For the first four months of 2022, the direct selling index and the DJIA fell 20.1% and 9.2%, respectively. DSCI data is tracked back to March 1, 2020. The index has risen 36.6% since that date versus a 29.8% gain for the DJIA. At its peak in June 2021, the index had risen 115.6% since inception.
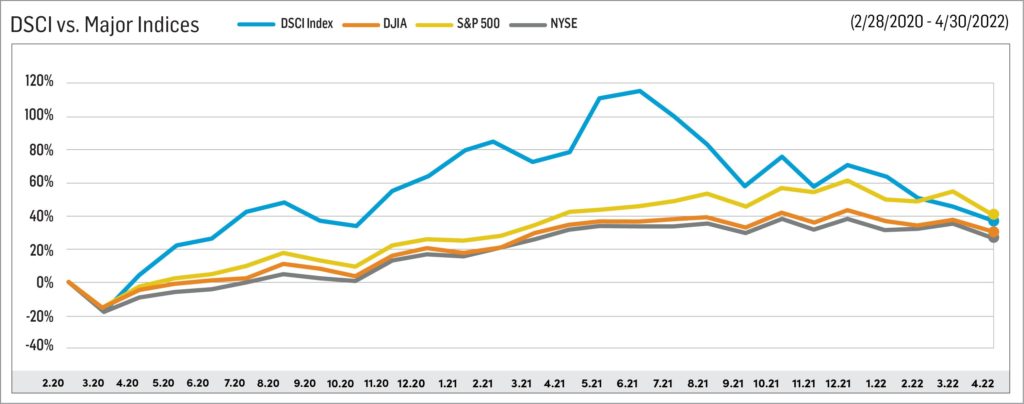
Large Cap
Betterware de Mexico (NASDAQ: BWMX) fell for a third successive month in April. The 6.4% monthly decline brings its YTD loss to 24.0%. BWMX appreciated a remarkable 500+% from late March 2020 through early July 2021, but it has declined nearly 70% since that peak.
On April 28, BWMX reported mixed 1Q 2022 results. On one hand, revenue and EBITDA declined 36% and 41%, respectively, versus 1Q 2021 which was the strongest quarter in the company’s history. On the other hand, BWMX’s 1Q 2022 EBITDA margin increased more than 1,000 basis points sequentially from the weak fourth quarter of 2021. BWMX management expects full year 2022 revenue and EBITDA to roughly match 2021 levels, which implies an acceleration of business in 2H 2022. Separately, BWMX began a share repurchase program in February 2022; so far, the company has repurchased 72,626 shares.
BWMX began trading in March 2020 after the company’s merger with SPAC sponsor DD3 Acquisition Corp. BWMX specifically targets the Mexican market; it serves three million households through distributors and associates in approximately 800 communities throughout Mexico.
Tupperware Brands Corporation (NYSE: TUP) fell 9.6% in April, breaking a two-month streak of impressive monthly gains in February and March. Since March 1, 2020, TUP shares have appreciated 516.8%, the highest return among all DSCI components over that period.
On May 4, TUP reported disappointing 1Q 2022 earnings. Net sales were $348.1 million, down 16% from the year-ago period, and adjusted diluted EPS was $0.12 versus $0.81 in 1Q 2021. The Russia-Ukraine conflict, strict COVID lockdowns in China, and cost inflation dragged down 1Q 2022 results. Even more noteworthy, TUP withdrew its 2022 financial guidance due to the high degree of operational uncertainty it faces.
In late February, TUP announced a $75 million accelerated share repurchase program. This accelerated buyback program is part of an overall $250 million share repurchase authorization approved by the company’s Board in June 2021.
Nu Skin Enterprises, Inc. (NYSE: NUS) fell 10.9% in April, breaking a streak during which it outperformed the DSCI average for four consecutive months. Since the March 2020 establishment of the index, NUS has appreciated 80.7%, significantly outperforming both the direct selling stock index (+36.6%) and the Dow Jones Industrial Average (+29.8%).
On May 4, NUS reported 1Q 2022 results; revenue and earnings per share declined 10.6% and 16.5%, respectively, from year-ago levels. For the full year 2022, NUS expects revenue to be $2.51 billion – $2.62 billion, about flat versus 2021. EPS in 2022 could range from $3.60 to $3.90, which would be down 6% to 13% from adjusted 2021 profits per share.
In mid-February, NUS increased its annual dividend rate to $1.54 from $1.52. Its dividend yield is now 3.55%, about twice that of the overall stock market.
Herbalife Nutrition, Inc. (NYSE: HLF) declined 12.5% in April, marking the third consecutive month it fell by double-figure percentage points. Since the March 2020 establishment of the DSCI, HLF has lost 17.9%.
On May 3, HLF announced disappointing 1Q 2022 results. Revenue fell 11.0% year-over-year during the quarter to $1.3 billion, and adjusted diluted 1Q 2022 EPS was $0.99, down from $1.42 in 1Q 2021. Unfavorable foreign exchange rates and geographic revenue mix negatively impacted the quarter.
In response, the company rebased its full-year 2022 revenue and adjusted diluted EPS significantly lower. Now, HLF expects 2022 revenue to decline 4% to 10% versus prior growth expectations of 0% to 6%. Similarly, management cut its 2022 EPS guidance to $3.50 to $4.00 from the previous range of $4.25 to $4.75.
Medifast, Inc. (NYSE: MED) was the lone DSCI member which rose in April. MED’s 4.4% gain during the month cut its YTD decline to 14.8%. Since the March 1, 2020 establishment of the DSCI, the stock has appreciated an impressive 124.4%, which represents notable outperformance versus both the direct selling stock index benchmark (+36.6%) and the Dow Jones Industrials (+29.8%) over the last 26 months.
On May 2, MED reported robust 1Q 2022 earnings results. Revenue and diluted EPS increased 21.7% and 3.8%, respectively, compared with the year-ago period. These results prompted MED management to raise both its 2022 revenue and diluted EPS guidance ranges slightly to $1.78 billion to $1.84 billion and $14.60 to $16.05, respectively.
USANA Health Sciences, Inc. (NYSE: USNA) fell 3.5% in April, but this fairly modest decline in a difficult stock market month made USANA the second best performing large cap component of the DSCI. Year to date, USANA is down 24.2%. Since the March 2020 inception of the DSCI, USANA shares have gained 16.0%, which trails the returns of both the direct selling index and the DJIA.
On April 26, USNA reported that 1Q 2022 net sales were $273 million, down 11% from $308 million in 1Q 2021. Diluted EPS in 1Q 2022 was $1.15, also down from the year-ago period, but up 12% sequentially. Weaker than expected net sales around the Lunar New Year holiday in a few key Asia Pacific markets impacted first quarter results. In turn, USANA cut its full-year 2022 net sales and diluted EPS guidance slightly to $1.1 billion-$1.2 billion and $5.00-$5.70, respectively.
Investors continued to take profits in April in eXp World Holdings, Inc. (NASDAQ: EXPI), the DSCI’s second best performer since its March 2020 establishment and the index’s fifth largest member by stock market capitalization. EXPI dropped 36.8% in April, bringing its YTD loss to 60.3%. Even after factoring in this retrenchment, EXPI has rallied 180.1% since March 1, 2020.
On May 4, EXPI, the fastest growing real estate brokerage in the world, reported strong 1Q 2022 results; net sales and real estate transaction volume increased 73% and 69%, respectively, versus year-ago figures. EXPI’s real estate agent roster reached 78,196 on March 31, 2022, up 55% from the year-ago period. EXPI’s Board authorized $20 million in monthly stock repurchases beginning in May 2022, up from $10 million previously.
The largest market cap stock in the DSCI, Primerica, Inc. (NYSE: PRI), fell 5.3% in April, which represents the third best relative performance of the large cap DSCI stocks during the month. PRI has gained 18.3% since the March 2020 establishment of the DSCI.
On May 5, PRI, a leading provider of financial services in the U.S. and Canada, reported mixed 1Q 2022 results. Total revenue was $691.2 million, up 8% versus the year-ago period. However, adjusted diluted earnings per share in 1Q 2022 totaled $2.06, down 16% from 1Q 2021. The earnings downturn was driven by a $15 million after-tax loss in the company’s Senior Health segment.
During 1Q 2022, PRI bought back more than 710,000 shares of its stock at a cost of $99 million. The company plans to repurchase $306 million of its shares during the full-year 2022.
The Beachbody Company, Inc. (NYSE: BODY) stock fell 27.8% in April, approximately reversing 13.5% and 9.9% gains in March and February, respectively. BODY, a leading subscription health and wellness company, has declined 30.8% YTD.
BODY plans to release 1Q 2022 earnings on May 9. In early March, the company reported that 4Q 2021 revenue was down 4% from 4Q 2020 attributable to continuing soft at-home fitness demand. Adjusted EBITDA in the fourth quarter was a loss of $26.6 million compared with a gain in 4Q 2020. In 2022, BODY expects a meaningful reduction in its EBITDA losses.
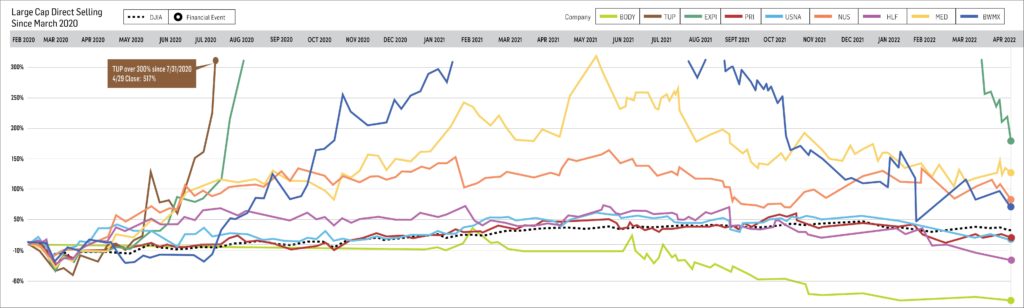
Small Cap
Our small cap tracking set generally followed the trend of its large cap peers and moved lower in April. Seven of the eight small caps declined during the month; one member was unchanged. The second largest member of the small cap group, Natural Health Trends Corp. (NASDAQ: NHTC), which markets personal care, wellness and “quality of life” products, announced on May 4 that its 1Q 2022 revenue declined 14% year over year and its 1Q 2022 operating income flipped to a small negative from a small positive in the year-ago period. The stock fell a modest 0.7% in April. More positively, the stock has gained 132.9% since DSCI inception, markedly outperforming both the index and the DJIA.
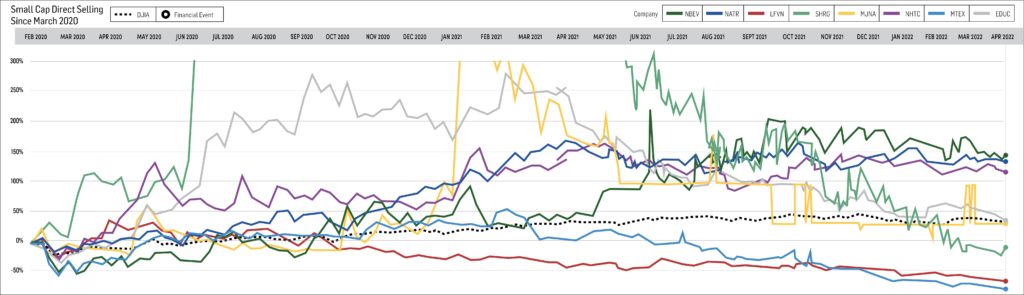
Short Interest Data & Analysis
The following chart is an aggregate index of “days to cover” among the entire tracking set. Days to cover (DTC) is a measurement determined by dividing the total outstanding short interest by average daily trading volume.
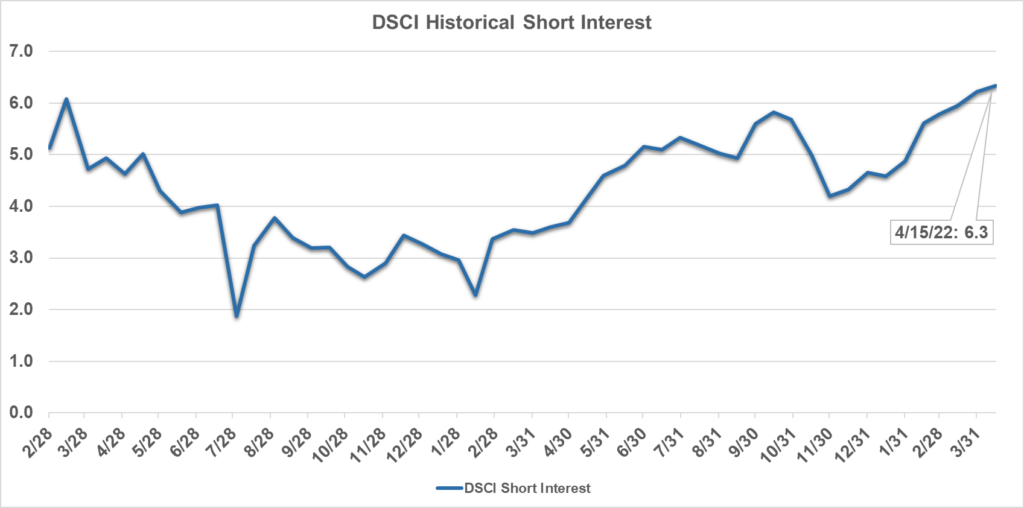
As indicated in the chart above, short interest in DSCI stocks reached 6.3 days as of mid-April 2022, besting the index’s previous all-time high set just over two years ago. A boost in EXPI’s DTC to 10.4 days in mid-April from 8.3 days at the end of March was the biggest contributor to the overall increase in the index’s DTC statistic. Aggregate days to cover have nearly tripled since bottoming in mid-February 2021.
Short interest can be a difficult indicator to analyze. On the one hand, an increase in short interest can be a bearish sign in that it indicates an increased view among investors that a stock is likely to decline based on any number of factors, such as a belief that the company’s fundamentals are deteriorating, or a belief that it has run too far too fast. On the other hand, as a stock moves higher, a significant short interest can serve as extra fuel on the fire as investors scramble to “buy to cover” their short positions and mitigate losses.
Analyst Sentiment Index
Our Analyst Sentiment Index retreated slightly in April 2022 from March 2022. Nevertheless, this qualitative index is not far from its late summer 2021 levels, the peak since the DSCI’s March 2020 establishment. During April, the proportion of sell-side analysts maintaining “buy” and “hold” ratings on industry stocks was about 90%. Conversely, the percentage of stocks which analysts recommend selling equaled just 10%.
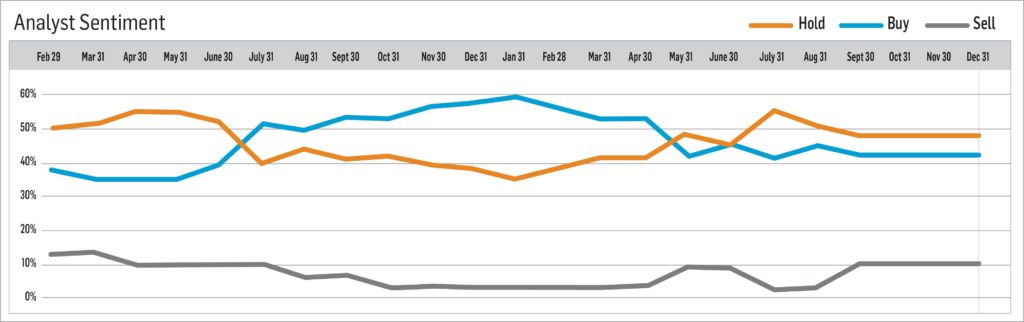
Methodology: The DSCA Analyst Sentiment Index is a consensus tracking tool that aggregates and averages the recommendations of all covering analysts across all public direct selling companies.
-
March 2022
Brought to you by Direct Selling Capital Advisors
Direct Selling Stocks Index Falls 3.5% in March
The Direct Selling Capital Advisors Direct Selling Index (DSCI) fell 3.5% in March, its third successive monthly drop. The index is down more than 40% from its peak in mid-2021. In comparison, the Dow Jones Industrial Average (DJIA) gained 2.3% in March, marking its only positive month of the first quarter. Consequently, the DSCI noticeably underperformed the overall stock market during March.
The returns of the individual DSCI components were fairly evenly distributed in March. Four large cap members rose, while five declined. Furthermore, one large company, The Beachbody Company, Inc. (NYSE: BODY), rose more than 10%, and two, eXp World Holdings, Inc. (NASDAQ: EXPI) and Herbalife Nutrition, Inc. (NYSE: HLF), fell by double figure percentage points.
Similarly, three small cap direct selling index components recorded gains in March, and five lost ground. One small company, Medical Marijuana, Inc. (OTC: MJNA), posted the largest percentage increase (+19%) of any DSCI member company during the month, while three other small caps fell in excess of 10%.
From a longer-term perspective, the DSCI fell 15.5% during 1Q 2022 compared with a 4.6% decline in the DJIA over the same period. Nevertheless, the direct selling index has gained a cumulative 44.5% since its March 1, 2020 inception, and it has notably outperformed the DJIA over this 25-month span. The DJIA has appreciated 36.5% since March 1, 2020.
In the first half of March, investors continued to reduce their overall exposure to stocks, just as they had during the first two months of 2022. Fears about a potential economic slowdown and the fastest pace of inflation in 40 years caused the DJIA to decline about 3% in the first two weeks of the month, which brought its YTD decline to around 10%.
However, when the Federal Reserve formally announced fairly aggressive rate hike plans in mid-March and news from the Russia-Ukraine war seemed to grow more constructive, investors’ attitudes became more sanguine. In turn, the DJIA rallied about 3% over the last half of March. The stock market now seems to believe the Fed’s future actions will cause inflation to turn lower and that larger companies in particular have the pricing power to show increased profits even in the face of inflationary pressures. Time will tell if this optimistic slant proves to be correct.
The stock market’s gains over the last few weeks of March were concentrated in large cap stocks with perceived pricing power, including many mega-cap technology shares. Smaller cap stocks, including many of the direct selling stocks, generally did not participate to the same degree in this recent upturn.
Looking Forward
If and as the stock market’s recent rally broadens and deepens, the direct selling stocks would likely participate in the upturn—really for the first time this year. The group is considered to carry higher risks and rewards than a typical stock, and the DSCI would probably outperform in a rising stock market.
As most DSCI members will not begin reporting their 1Q 2022 results until early May, the trading pattern of the DSCI stocks in April will probably be closely linked to the overall performance of similarly-positioned small and mid-cap stocks. When the direct selling companies begin to report 1Q 2022 earnings and clarify full year 2022 guidance in May, investors then seem likely to refocus their attention on the individual fundamentals of each company.
CHARTS & ANALYSIS
Direct Selling Capital Advisors Index
The DSCI is a market capitalization weighted index of all domestic public direct selling companies with a market capitalization of at least $25 million. The index is rebalanced monthly, and no single issue is permitted to represent more than 20% of its total value. In such an event, the excess weighting would be redistributed among the other index components.
The DSCI fell in March and underperformed the DJIA during the month. Specifically, the DSCI lost 3.5% during March, while the DJIA appreciated 2.3%. For the first quarter of 2022, the direct selling index and the DJIA fell 15.5% and 4.6%, respectively. DSCI data is tracked back to March 1, 2020. The index has risen 44.5% since that date versus a 36.5% gain for the DJIA. At its peak in June 2021, the index had risen 115.6% since inception.
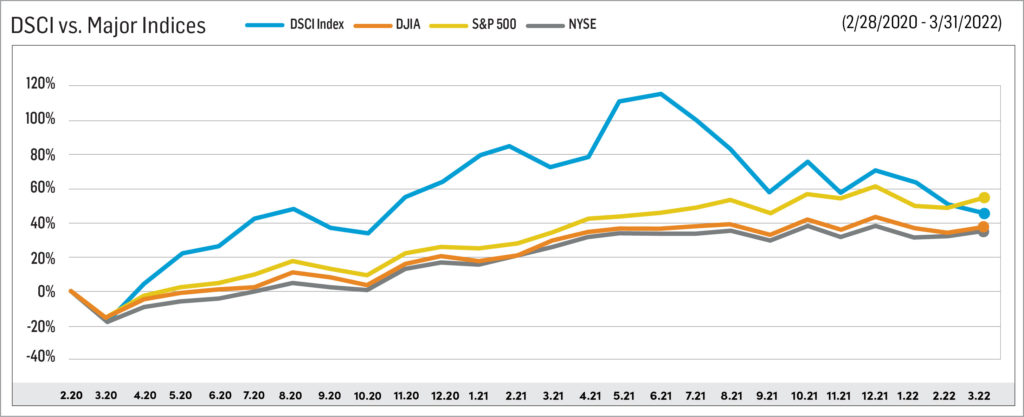
Large Cap
Betterware de Mexico (NASDAQ: BWMX) is among the most volatile of all large-cap DSCI components. The stock declined 4.6% in March. This performance followed an 18.1% decline in February, and a 16.5% gain in January. The February loss was the largest of any large cap index member, and the increase in January represented the biggest gain of any large-cap DSCI component. All told, the stock declined 18.8% in the first quarter of 2022. BWMX appreciated a remarkable 500+% from late March 2020 through early July 2021, but it has declined nearly 70% since that peak.
In mid-February, BWMX reported disappointing 4Q 2021 results. Revenue and EBITDA declined 11% and 43%, respectively, versus the year-ago period. BWMX management expects full year 2022 revenue and EBITDA to roughly match 2021 levels which implies an acceleration of business in 2H 2022.
BWMX began trading in March 2020 after the company’s merger with SPAC sponsor DD3 Acquisition Corp. BWMX specifically targets the Mexican market; it serves three million households through distributors and associates in approximately 800 communities throughout Mexico.
Tupperware Brands Corporation (NYSE: TUP) rose 6.7% in March, making it the third best performer of all DSCI member companies in the month. In February, the stock soared a DSCI-leading 18.2%. Since March 1, 2020, TUP shares have appreciated an extraordinary 582.5%, the highest return among all DSCI components over that period.
On February 28, TUP announced a $75 million accelerated share repurchase program, equivalent to about 4.6 million shares, or 8.7% of total shares outstanding. This buyback program is part of an overall $250 million share repurchase authorization approved by the company’s Board in June 2021.
Five days earlier, TUP reported mixed 4Q 2021 earnings. Net revenue was $394.9 million in the quarter, down 10% on a constant currency basis. On the other hand, adjusted diluted earnings were $0.38 per share in 4Q 2021, up from $0.22 in 4Q 2020. For the full year 2022, TUP expects adjusted diluted EPS to range from $2.60 to $3.20. At the midpoint of that range, and even after reflecting the stock’s strong performance in February and March, TUP trades at a P/E ratio of only 6.9x.
Nu Skin Enterprises, Inc. (NYSE: NUS) gained 3.2% in March, outperforming the DSCI average for the fourth consecutive month. Since the March 2020 establishment of the index, NUS has appreciated 103.0%, significantly outperforming the direct selling stock index (+44.5%) and the Dow Jones Industrial Average (+36.5%).
In mid-February, NUS reported 4Q 2021 results; revenue and recurring earnings per share declined 10% and 21%, respectively, from 4Q 2020 levels. For the full year 2022, NUS expects revenue to be about flat and for EPS to grow modestly versus 2021.
On February 16, NUS increased its annual dividend rate to $1.54 from $1.52. Its dividend yield is now 3.1%, about 1.5 times that of the overall stock market.
Herbalife Nutrition, Inc. (NYSE: HLF) was the second worst performing large cap DSCI component in March, losing 14.7%. This decline followed a 16.3% fall in February. Since the March 2020 establishment of the DSCI, HLF has lost 6.2%.
In late February, HLF reported moderate declines in 4Q 2021 revenue and adjusted diluted EPS versus the year-ago period. The company expects full year 2022 revenue growth of 0%-6% and adjusted diluted EPS of $4.25-$4.75, down from $4.79 in 2021.
Medifast, Inc. (NYSE: MED) shares fell for the third successive month in March (-8.2%), bringing its YTD decline to 18.5%. Nevertheless, since the March 1, 2020 establishment of the DSCI, the stock has appreciated an impressive 114.9%, which represents marked outperformance versus both the direct selling stock index benchmark and the Dow Jones Industrials over the last 25 months.
MED’s underperformance so far in 2022 is puzzling as the company reported strong 4Q 2021 earnings results in late February. Revenue and diluted EPS increased 43% and 23%, respectively, compared with the year-ago period. According to MED management, sales in 2022 should range from $1.72 to $1.79 billion, up from $1.526 billion in 2021, and 2022 diluted EPS is expected to be $14.50 to $16.00 versus $13.89 last year.
USANA Health Sciences, Inc. (NYSE: USNA) lost ground (-9.7%) for the second consecutive month in March. This decline brings its YTD loss to 21.5%. Since the March 2020 inception of the DSCI, USANA shares have gained 20.2%, which trails the returns of both the direct selling index and the DJIA since that date.
In early February, USANA reported that 4Q 2021 net sales totaled $267.3 million, down 14% from the year-ago period due to weaker than expected sales in Asia Pacific markets. Diluted EPS was $1.03 in 4Q 2021, about 45% lower than 4Q 2020 levels.
Investors took profits in March in eXp World Holdings, Inc. (NASDAQ: EXPI), the DSCI’s second best performer since its March 2020 establishment, and the index’s second largest member as measured by stock market capitalization. EXPI plummeted 20.8% in March, bringing its YTD loss to 37.2%. Even after factoring in this retrenchment, EXPI has rallied an astounding 342.9% since March 1, 2020.
In late February, EXPI, the fastest growing real estate brokerage in the world, reported impressive 4Q 2021 results; net sales and residential transaction volume increased 77% and 52%, respectively, versus year-ago figures. EXPI’s real estate agent roster exceeded 77,000 in mid-March 2022, up 86% from 41,313 at December 31, 2020. EXPI now has agents working in 20 countries across the globe.
The largest market cap stock in the DSCI, Primerica, Inc. (NYSE: PRI), rose 5.3% in March, partially reversing a 15.5% slide in February. The stock is 24.9% higher since the March 2020 establishment of the DSCI.
In mid-February, PRI, a leading provider of financial services in the U.S. and Canada, reported solid 4Q 2021 results. Adjusted operating revenue totaled $723.0 million, up 22% versus the year-ago period. Diluted adjusted earnings per share in 4Q 2021 was $2.94, up 20% versus 4Q 2020.
The Beachbody Company, Inc. (NYSE: BODY) stock appreciated markedly for the second consecutive month in March. BODY, a leading subscription health and wellness company, rose 13.5% in March, making it the best performing large cap DSCI component. In February, the stock was the second best performing large cap member, gaining 9.9%.
In early March, BODY reported that 4Q 2021 revenue was down 4% from 4Q 2020, as at-home fitness demand continued to soften. Adjusted EBITDA in the fourth quarter was a loss of $26.6 million compared with a gain in 4Q 2020. In 2022, BODY expects a meaningful reduction in its EBITDA losses.
Note: For the purposes of this report, Direct Selling Capital considers companies with a market capitalization in excess of $1 billion “Large Cap.”
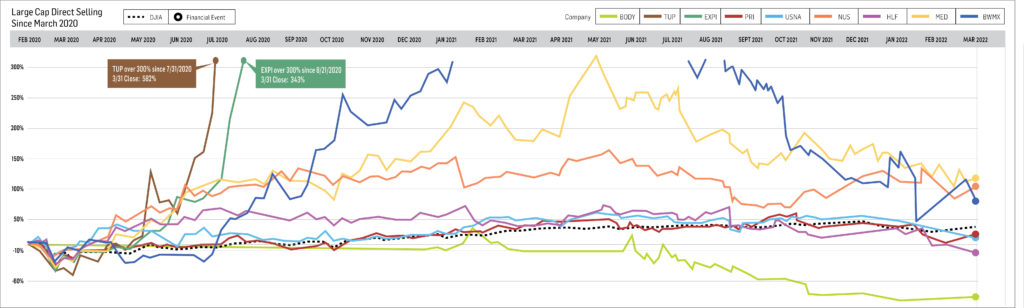
Small Cap
Our small cap tracking set generally followed the trend of its large cap peers and moved modestly lower in February. Five of the eight small caps declined during the month. The largest member of the small cap group, Nature’s Sunshine Products, Inc. (NASDAQ: NATR), announced that its 4Q 2021 net sales increased 15.9% and its adjusted EPS more than doubled versus the year-ago period. However, the stock still fell 4.1% in March. On a more positive note, the stock has gained 116.6% since DSCI inception, markedly outperforming both the index and the DJIA.
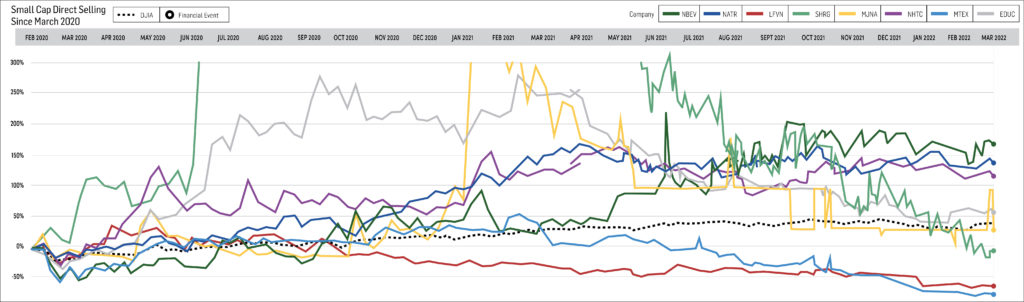
Short Interest Data & Analysis
The following chart is an aggregate index of “days to cover” among the entire tracking set. Days to cover is a measurement determined by dividing the total outstanding short interest by average daily trading volume.
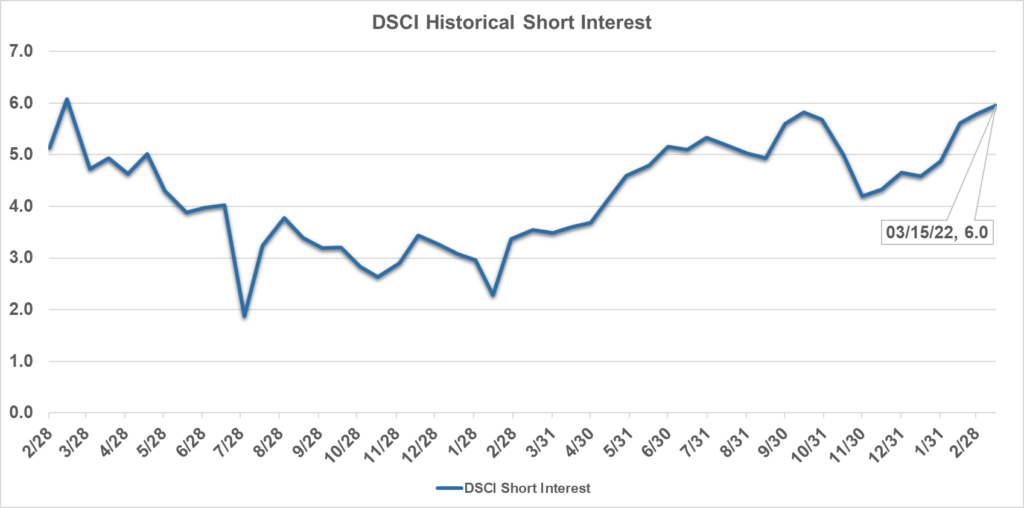
As indicated in the chart above, short interest in DSCI stocks reached 6.0 days as of mid-March 2022, near the index’s all-time high set two years ago. Aggregate “days-to-cover” have nearly tripled since bottoming in mid-February 2021.
Short interest can be a difficult indicator to analyze. On the one hand, an increase in short interest can be a bearish sign in that it indicates an increased view among investors that a stock is likely to decline based on any number of factors, such as a belief that the company’s fundamentals are deteriorating, or a belief that it has run too far too fast. Conversely, as a stock moves higher, a significant short interest can serve as extra fuel on the fire as investors scramble to “buy to cover” their short positions and mitigate losses.
Analyst Sentiment Index
Our Analyst Sentiment Index improved in March 2022 from February 2022. This qualitative index is approaching its late summer 2021 levels, the peak since the DSCI’s March 2020 establishment. During March, the proportion of sell-side analysts maintaining “buy” and “hold” ratings on industry stocks was about 93%. In turn, the percentage of stocks which analysts recommend selling equaled just 7%.
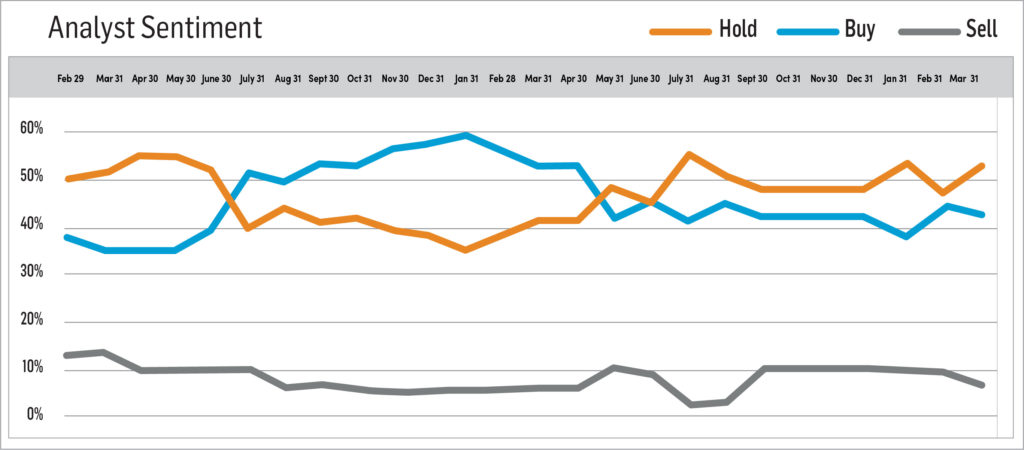
-
February 2022
Brought to you by Direct Selling Capital Advisors
Direct Selling Stocks Index Drops 10.1% in February, Underperforms Dow Jones Industrial Average
The Direct Selling Capital Advisors Direct Selling Index (DSCI) fell 10.1% in February, its second consecutive monthly decline. The index is now down about 40% from its peak in mid-2021. The Dow Jones Industrial Average (DJIA) also lost ground in February, surrendering 3.5%. Consequently, the DSCI underperformed the overall stock market during the month.
As was the case in January, just four of the seventeen DSCI components (two large caps and two small caps) posted gains in February, while the stocks of the other 13 members declined. However, and somewhat surprisingly given the magnitude of the DSCI’s decline, as well as the more than 3-to-1 ratio of declining to advancing stocks during the month, nearly as many DSCI components gained 10% or more as declined by that percentage. Counting The Beachbody Company, Inc.’s (NYSE: BODY) 9.9% gain during the month, two large caps—Tupperware Brands Corporation (NYSE: TUP) was other—and one small cap, Educational Development Corporation (NASDAQ: EDUC), showed double-digit gains, while five components, three large caps and two small caps, declined by at least 10%.
From a longer-term perspective, the DSCI has gained a cumulative 49.6% since the March 1, 2020 index inception compared with a 33.4% increase for the DJIA over the same period. The DSCI’s performance over the last two years represents an impressive compounded annualized return of more than 22%.
In February, the stock market was buffeted first by fears of, and then the reality of, the Russia-Ukraine war, as well as continuing inflation concerns, the impact of coming Fed rate hikes and a possible economic slowdown. As a result, the S&P 500 registered a 12% decline at its low in late February from its all-time high at the end of 2021. This decline represented the broad index’s first correction in two years.
Surprisingly, this poor overall stock market performance occurred while S&P 500 companies continued to report extremely strong earnings. According to FactSet, the blended earnings year-over-year growth rate for the S&P 500 was nearly 31% in 4Q 2021, the fourth consecutive quarter where such growth exceeded 30%.
Stocks continued to trade with a high degree of volatility into early March, as investors attempted to factor in each incremental piece of positive and negative news from the Russia-Ukraine conflict. Given the great uncertainties associated with the war, including sharp increases in worldwide oil and energy prices and deteriorating investor sentiment, which has turned much more cautious compared with a predominantly constructive attitude through most of 2021, the overall stock market seems likely to trend in a flat to down direction through the end of the first quarter.
Looking Forward
The direct selling stocks as a group are viewed to have higher risks—and higher rewards—than the broad stock market. This characteristic explains much of the group’s poor performance in February against the backdrop of a declining stock market.
In order to buck that trend, a direct selling company needed to report significant constructive news during February. Tupperware Brands Corporation (NYSE: TUP) was able to do so, as its 4Q 2021 earnings release, coupled with a reasonable valuation, triggered a sharp rally in the stock. In contrast, investors judged that the 4Q 2021 earnings releases of most other DSCI components did not contain sufficient incremental information to drive the stocks higher.
With the majority of 4Q 2021 earnings reporting now concluded for DSCI companies, the stocks seem likely to trade in line with overall stock market patterns in March. And since the stock market faces considerable headwinds (see above), DSCI components may likewise have difficulty sustaining upward momentum this month.
CHARTS & ANALYSIS
The DSCI is a market capitalization weighted index of all domestic public direct selling companies with a market capitalization of at least $25 million. The index is rebalanced monthly, and no single issue is permitted to represent more than 20% of its total value. In such an event, the excess weighting would be redistributed among the other index components.
The DSCI fell in February and underperformed the DJIA during the month. Specifically, the DSCI lost 10.1% during February, while the DJIA fell 3.5%. DSCI data is tracked back to March 1, 2020. The index has risen 49.6% since that date versus a 33.4% gain for the DJIA. At its peak in June 2021, the index had risen 115.6% since inception.
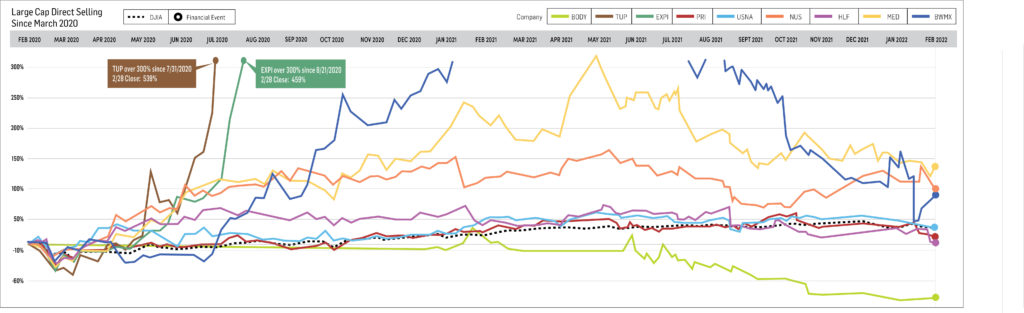
Large Cap
Betterware de Mexico (NASDAQ: BWMX) continues to be the most volatile large-cap DSCI component. The stock was the worst-performing index member during February, declining 18.1% and reversing its 16.5% January gain when it led all DSCI large-cap performers. BWMX appreciated a remarkable 500+% from late March 2020 through early July 2021, but has declined about 65% since that peak.
On February 10, BWMX reported disappointing 4Q 2021 results. Revenue and EBITDA declined 11% and 43%, respectively, versus the year-ago period. Loss of sales due to China factory closures negatively affected both categories, and increased required promotional activity had a pronounced impact on EBITDA. BWMX management expects full year 2022 revenue and EBITDA to roughly match 2021 levels, which implies an acceleration of business in 2H 2022.
BWMX began trading in March 2020 after the company’s merger with SPAC sponsor DD3 Acquisition Corp. BWMX specifically targets the Mexican market; it serves three million households through distributors and associates in approximately 800 communities throughout Mexico.
Tupperware Brands Corporation (NYSE: TUP) soared 18.2% in February, making it the top performer of all DSCI components, large or small cap. Since March 1, 2020, TUP shares have appreciated an extraordinary 539.6%, the highest return among all DSCI components over that period.
On February 23, TUP reported mixed 4Q 2021 earnings. Net revenue was $394.9 million in the quarter, down 10% on a constant currency basis from 4Q 2020. On the other hand, adjusted diluted earnings were $0.38 per share in 4Q 2021, up from $0.22 in 4Q 2020.
For the full year 2022, TUP expects adjusted diluted EPS to range from $2.60 to $3.20. At the midpoint of that range TUP trades at a P/E ratio of only 6.7x.
Nu Skin Enterprises, Inc. (NYSE: NUS) declined 2.9% in February, outperforming the DSCI average for the third consecutive month. Since the March 2020 establishment of the index, NUS has appreciated 96.6%, significantly outperforming the direct selling stock index (+49.6%) and the Dow Jones Industrial Average (+33.4%).
On February 16, NUS reported 4Q 2021 results; revenue and recurring earnings per share declined 10% and 21%, respectively, from 4Q 2020 levels. For the full year 2022, NUS expects revenue to reach $2.66-$2.77 billion, about flat versus 2021, and EPS to range from $4.05-$4.45, higher at the midpoint versus $4.14 in 2021.
Herbalife Nutrition, Inc. (NYSE: HLF) was the second worst performing DSCI component in February, declining 16.3%. The decline approximately erased its gains in December and January. Since the March 2020 establishment of the DSCI, HLF has appreciated 10.0%.
On February 23, HLF reported 4Q 2021 revenue of $1.3 billion, down 6.6% versus 4Q 2020 and adjusted diluted EPS of $0.59 versus $0.71 in the year-ago period. The company expects full year 2022 revenue growth of 0%-6% and full year 2022 adjusted diluted EPS of $4.25-$4.75, down from $4.79 in 2021.
Medifast, Inc. (NYSE: MED) shares fell for the second successive month in February (-6.4%), bringing its YTD decline to 11.2%. Since the March 1, 2020 establishment of the DSCI, the stock has appreciated an impressive 134.0%, which represents marked outperformance versus both the direct selling stock index benchmark and the Dow Jones Industrials over the last two years.
On February 23, MED reported strong 4Q 2021 earnings results. Revenue and diluted EPS increased 43% and 23%, respectively, compared with the year-ago period. In addition, the company introduced constructive 2022 revenue and diluted EPS guidance. Sales in 2022 should range from $1.72 to $1.79 billion, up from $1.526 billion in 2021; and 2022 diluted EPS is expected to be $14.50 to $16.00 versus $13.89 last year.
USANA Health Sciences, Inc. (NYSE: USNA) retreated 7.9% in February. Since the March 2020 inception of the DSCI, USANA shares have gained 33.1%, in line with the Dow’s 33.4% cumulative price increase.
On February 6, USANA announced 4Q 2021 earnings results. Net sales totaled $267.3 million during the quarter, down 14% from the year-ago period due to weaker than expected sales in Asia Pacific markets. Diluted EPS was $1.03 in 4Q 2021, about 45% lower than 4Q 2020 levels. USANA introduced 2022 revenue guidance of $1.125-$1.225 billion versus $1.186 billion in 2021, and a 2022 EPS forecast of $5.25-$6.00 compared with $5.73 in 2021.
The DSCI’s second best performer since its March 2020 establishment and the index’s second largest member as measured by stock market capitalization, eXp World Holdings, Inc. (NASDAQ: EXPI) lost 1.5% of its value during February, but significantly outperformed the DSCI (-10.1%) and the Dow Jones Industrials Index (-3.5%) during the month. Even after factoring in the slight pullback, EXPI has rallied an impressive 459.4% since March 1, 2020.
On February 24, EXPI, the fastest growing real estate brokerage in the world, reported impressive 4Q 2021 results; net sales and residential transaction volume increased 77% and 52%, respectively, versus year-ago figures. EXPI’s real estate agent roster reached 71,137 as of December 31, 2021, up 72% from 41,313 at December 31, 2020.
The largest market cap stock in the DSCI, Primerica, Inc. (NYSE: PRI), slid 15.5% in February and thereby noticeably underperformed both the DSCI and the broad stock market during the month. The stock is 18.6% higher since the March 2020 establishment of the DSCI.
On February 14, PRI, a leading provider of financial services in the U.S. and Canada, reported solid 4Q 2021 results. Adjusted operating revenue totaled $723.0 million, up 22% versus the year-ago period. The company benefitted from strong performances in its life insurance and investment businesses in the quarter ended December 31, 2021. Diluted adjusted earnings per share in 4Q 2021 was $2.94, up 20% versus 4Q 2020.
PRI’s Board increased its share repurchase program through December 31, 2022 to $325 million from $275 million. About $19 million of shares were bought back in 4Q 2021.
The Beachbody Company, Inc. (NYSE: BODY) stock was one of just two large cap DSCI components that rose in February; the stock gained 9.9% during the month. Still, BODY is down 15.6% YTD.
On March 1, BODY, a leading subscription health and wellness company, reported that 4Q 2021 revenue was $216.3 million, down 4% from 4Q 2020, as at-home fitness demand continued to soften. Adjusted EBITDA in the fourth quarter was a loss of $26.6 million compared with a gain of $16.5 million in 4Q 2020. In 2022, BODY expects a meaningful reduction in its EBITDA losses.
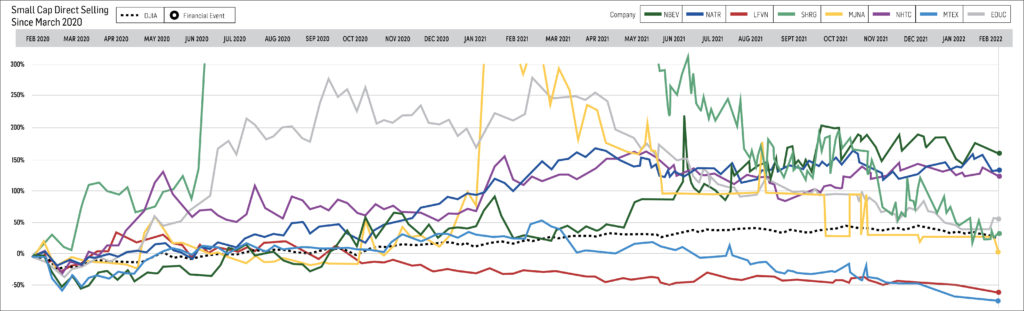
Small Cap
Our small cap tracking set generally followed the trend of its large cap peers and trended lower in February. Six of the eight small caps declined during the month. The best performing small cap stock during the month was Educational Development Corporation (NASDAQ: EDUC), a publishing company specializing in books for children. EDUC rose 12.9% in February. The stock has gained 57.6% since DSCI inception, notably outperforming both the index and the DJIA.

Short Interest Data & Analysis
The following chart is an aggregate index of “days to cover” among the entire tracking set. Days to cover is a measurement determined by dividing the total outstanding short interest by average daily trading volume.
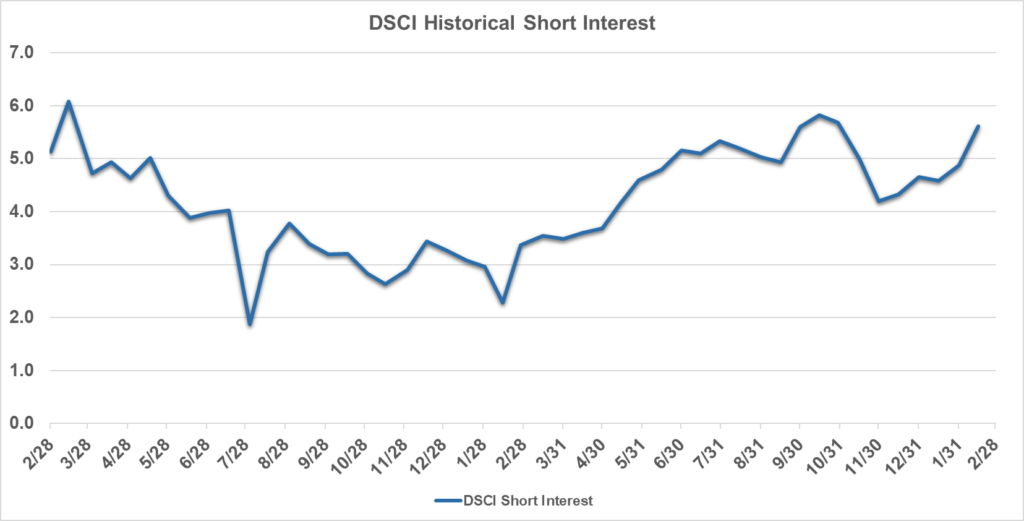 As indicated in the chart above, short interest in industry stocks moved higher during the period, from 4.6 days as of January 15, 2022 to 5.6 days in mid-February 2022. Aggregate “days-to-cover” have more than doubled since bottoming in mid-February 2021.
Short interest can be a difficult indicator to analyze. On the one hand, an increase in short interest can be a bearish sign in that it indicates an increased view among investors that a stock is likely to decline based on any number of factors, such as a belief that the company’s fundamentals are deteriorating, or a belief that it has run too far too fast. Conversely, as a stock moves higher, a significant short interest can serve as extra fuel on the fire as investors scramble to “buy to cover” their short positions and mitigate losses.
Analyst Sentiment Index
Our Analyst Sentiment Index was approximately unchanged in February 2022 from January 2022 and remains near the peak level since its March 2020 establishment. During February, the proportion of sell-side analysts maintaining “buy” and “hold” ratings on industry stocks was about 91%. In turn, the percentage of stocks which analysts recommend selling equaled just 9%.
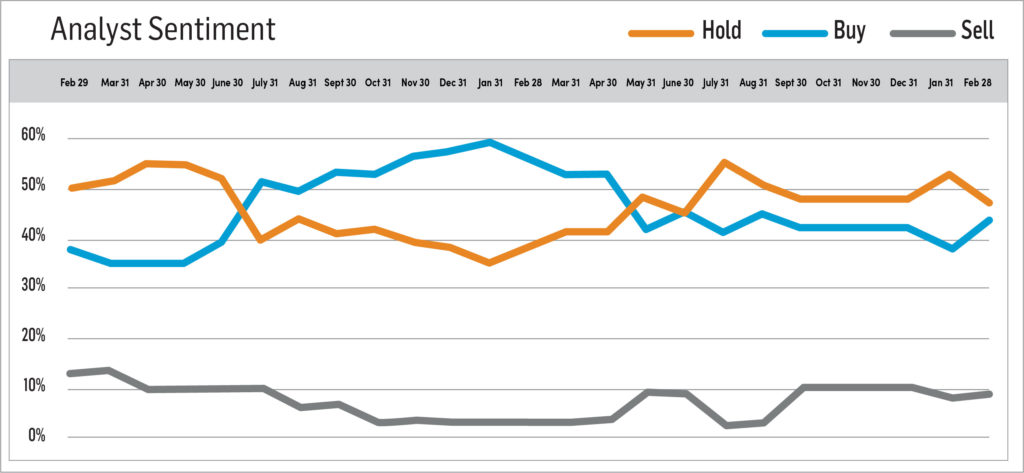
-
January 2022
Brought to you by Direct Selling Capital Advisors
Direct Selling Stocks Index Declines 4.1% in January, Narrowly Outperforms Dow Jones Industrial Average
The Direct Selling Capital Advisors Direct Selling Index (DSCI) fell 4.1% in January, reversing a gain of the same magnitude in December and continuing its now four-month pattern of alternating up and down months. The compilation of direct selling stocks is down just over 30% from its peak in mid-2021. The Dow Jones Industrial Average (DJIA) also declined in January, losing 4.4%. As a result, the DSCI slightly outperformed the overall stock market during the month.
Only four of the seventeen components (two large caps and two small caps) posted gains in January, while 13 stocks declined. This negative skewing is more noticeable when one compares the number of large percentage gainers versus decliners during the month. Only one member, large cap Betterware de Mexico (NASDAQ: BWMX), gained more than 10% during January, while six components (two large caps and four small caps) fell by double-digit percentage points over the course of the month.
Based on all this, the large cap subgroup of the DSCI modestly outperformed their small cap peers. This relative outperformance marked the third successive month that the larger stocks as a group posted better results than the shares of the smaller companies.
From a longer-term perspective, the DSCI has gained a cumulative 63.9% since the March 1, 2020 index inception, compared with a 36.7% increase for the DJIA over the same period. The DSCI’s performance over the last 23 months represents an impressive compounded annualized return of nearly 30%.
The stock market, as measured by the Dow Jones Industrials, the S&P 500 or the NASDAQ, posted its worst monthly performance in January 2022 since March 2020, when the world began to grapple with the COVID-19 pandemic. Shares of high-valuation, growth stocks have performed poorly for the last few months as investors fear that the Federal Reserve’s plans to raise interest rates and cease its bond-buying programs this year, along with the stopping of unprecedented pandemic-related fiscal stimulus initiatives, may end the period where many risky stocks were widely embraced by retail and institutional investors.
More constructively, corporate earnings continue to grow. Profits for the S&P 500 likely grew 24% year-over-over in 4Q 2021 according to the market data service FactSet, and earnings for the broad market index could jump about 7% in the full year 2022. Furthermore, the stock market, as measured by its P/E ratio based on consensus forward year earnings estimates, does not seem expensive, particularly given the low level of interest rates. The market’s valuation has changed little since early 2020. Back then the market traded at around 20x consensus 2020 earnings; today it trades at about the same multiple based on consensus 2022 projections.
Finally, the investing axiom that “as goes January, so goes the year” seems not to hold as rigidly now as it did in the past. Indeed, the market dropped noticeably for stretches in both January 2020 and January 2021, yet the broad market posted substantial gains in both full years. As a consequence, the decline in the just completed month of January may not be an early harbinger of a difficult stock market year in 2022.
Looking Forward
While the direct selling stocks as a group declined in January, they outperformed the Dow Jones Industrials during the month. This relative outperformance could augur well for the group in the near to intermediate term because higher beta direct selling stocks generally perform worse—sometimes much worse—than the overall stock market during times of market stress. Their positive relative performance during a difficult market stretch could suggest they are poised for strong gains when the market rebounds.
In this regard, the degree of constructiveness of company-specific news expected in February could represent an early gauge of the direct selling stocks’ potential in 2022. Specifically, most of the group will report 4Q 2021 earnings this month, and many of the large-cap members will provide revenue and earnings projections for the full year 2022. USANA Health Sciences, Inc. (NYSE: USNA) and Primerica, Inc. (NYSE: PRI) will be among the first DSCI stocks to report 4Q 2021 earnings and issue forward guidance.
CHARTS & ANALYSIS
The DSCI is a market capitalization weighted index of all domestic public direct selling companies with a market capitalization of at least $25 million. The index is rebalanced monthly, and no single issue is permitted to represent more than 20% of its total value. In such an event, the excess weighting would be redistributed among the other index components.
The DSCI fell in January but still slightly outperformed the DJIA during the month. Specifically, the DSCI lost 4.1% during January, while the DJIA fell 4.4%. DSCI data is tracked back to March 1, 2020. The index has risen 63.9% since that date versus a 36.7% gain in the DJIA. At its peak in June 2021, the index had risen 115.6% since inception.

Large Cap
Betterware de Mexico (NASDAQ: BWMX) was the best performing DSCI component, large cap or small cap, in January, as it soared 16.5% during the month. This price action underscored BWMX’s volatility; in December 2021, the stock declined 19.6%, making it the worst-performing large cap direct selling stock that month. Furthermore, BWMX appreciated a remarkable 500+% from late March 2020 through early July 2021 but has declined about 50% since that peak.
In late October, BWMX announced that its 3Q 2021 revenue and EBITDA increased 4% and decreased 3%, respectively, versus the year-ago period. Both measures represented substantially slower growth than during prior periods. The company plans to report 4Q 2021 results on February 10, 2022.
BWMX began trading in March 2020 after the company’s merger with SPAC sponsor DD3 Acquisition Corp. BWMX specifically targets the Mexican market; it serves three million households through distributors and associates in approximately 800 communities throughout Mexico.
Tupperware Brands Corporation (NYSE: TUP) fell 3.4% in January but still outperformed the DSCI and the Dow Jones Industrials over this period. Since March 1, 2020, TUP shares have appreciated an extraordinary 418.2%, the second highest return among all DSCI components over that period. (Only eXp World Holdings, Inc. has gained more: 421.5%.). In early November, TUP reported that 3Q 2021 sales declined 11.0% versus the year-ago period, as the lingering effects of COVID-19 affected its business. The company will report 4Q 2021 results on February 23, 2022.
In late November, TUP reported that it had raised $880 million in a new secured credit facility. The new facility lowers the company’s interest rate on term loans by more than 600 basis points, refinances the company’s existing credit facilities, and increases its liquidity by around $100 million.
Nu Skin Enterprises, Inc. (NYSE: NUS) declined 1.5% in January, outperforming the DSCI average for the second consecutive month. Since the March 2020 establishment of the index, NUS has appreciated 111.9%, significantly outperforming the direct selling stock index (+63.9%) and the Dow Jones Industrial Average (+36.7%).
In early November, NUS reported 3Q 2021 results in which revenue and earnings per share declined 9% and 10%, respectively, from 3Q 2020 levels. Nevertheless, both measures exceeded analysts’ consensus estimates. NUS will report its 4Q 2021 results on February 16, 2022. On that day, NUS will host a virtual investor day and provide 2022 financial guidance.
Herbalife Nutrition, Inc. (NYSE: HLF) was the second best performing large cap DSCI component in January, rising 6.7%. This gain followed an impressive 9.6% monthly increase in December. Since the March 2020 establishment of the DSCI, the stock has appreciated 34.9%.
In early November, HLF reported mixed 3Q 2021 results. Its net sales were $1.4 billion, down 6% from 3Q 2020 levels due primarily to lingering effects of the pandemic, but the company’s EPS totaled $1.21, up from $1.15 in the year-ago period. HLF will report 4Q 2021 financial results on February 23, 2022.
Medifast, Inc. (NYSE: MED) shares fell 8.4% in January, breaking a string of three successive monthly gains. Since the March 1, 2020 establishment of the DSCI, the stock has appreciated an impressive 141.3%, which represents marked outperformance versus both the direct selling stock index benchmark and the Dow Jones Industrials over the last 23 months.
In early November, MED reported impressive 3Q 2021 earnings results. Revenue and diluted EPS increased 52% and 22%, respectively, compared with the year-ago period. In addition, the company slightly boosted its full-year 2021 guidance ranges on both measures.
USANA Health Sciences, Inc. (NYSE: USNA) declined 5.6% in January. Since the March 2020 inception of the DSCI, USANA shares have gained 44.6%, beating the Dow’s 36.7% cumulative price increase.
In late October, USANA reported 3Q 2021 sales and EPS that declined 8.1% and 5.6%, respectively, from 3Q 2020. COVID-19-related disruptions impacted the company’s operations and ability to ship sufficient product to customers in 3Q 2021. On February 8, 2022, USANA will be the first direct selling stock to report its 4Q 2021 results.
The DSCI’s best performer since its March 2020 establishment, eXp World Holdings, Inc. (NASDAQ: EXPI) reversed some of its gains in January as it declined 26.0% during the month. Even after factoring in the pullback, EXPI has rallied an impressive 421.5% since March 1, 2020. The company plans to expand its global real estate brokerage business in 1Q 2022 by opening offices in the Dominican Republic, Greece and New Zealand.
In early November, EXPI, the fastest growing real estate brokerage in the world, reported solid 3Q 2021 results; net sales and residential transaction volume nearly doubled versus 3Q 2020 figures as the total number of its real estate agents rose 82% versus the tally twelve months ago. The company now has more 72,000 agents globally, up dramatically from 41,313 at December 31, 2020.
The largest market cap stock in the DSCI, Primerica, Inc. (NYSE: PRI), declined 1.6% in January and thereby noticeably outperformed the DSCI (-4.1%) during the month. The stock is 37.6% higher since the March 2020 establishment of the DSCI.
In early November 2021, PRI, a leading provider of financial services in the U.S. and Canada, reported solid 3Q 2021 results. Revenue totaled $693.2 million, up 22% versus the year-ago period. The company benefitted from continued strong momentum in investment and product sales in the period ended September 30, 2021. Earnings per share in 3Q 2021 was $2.82, flat versus 3Q 2020. PRI plans to release its full-year 2021 earnings on February 14, 2022.
On November 17, PRI’s Board authorized a $275 million share repurchase program through December 31, 2022. This program replaces a $300 million initiative that was approved in February 2021 and was due to expire on June 30, 2022.
The Beachbody Company, Inc. (NYSE: BODY) stock was the weakest large cap component in the DSCI in January, declining 30.8%. In mid-November, Beachbody, a leading subscription health and wellness company, reported that 3Q 2021 revenue was $208.1 million, down 17% from 3Q 2020, as at-home fitness demand softened. In addition, the company recorded a 3Q 2021 adjusted EBITDA loss of $43.4 million compared with a gain in the year-ago period.

Small Cap
Our small cap tracking set generally trended lower in January as six of the eight components declined. The small cap stock with the largest capitalization, Nature’s Sunshine Products, Inc. (NASDAQ: NATR), a leading natural health and wellness company, declined 4.9% in January. The stock has gained 126.5% since DSCI inception, handily outperforming the DSCI.

Short Interest Data & Analysis
The following chart is an aggregate index of “days to cover” among the entire tracking set. Days to cover is a measurement determined by dividing the total outstanding short interest by average daily trading volume.
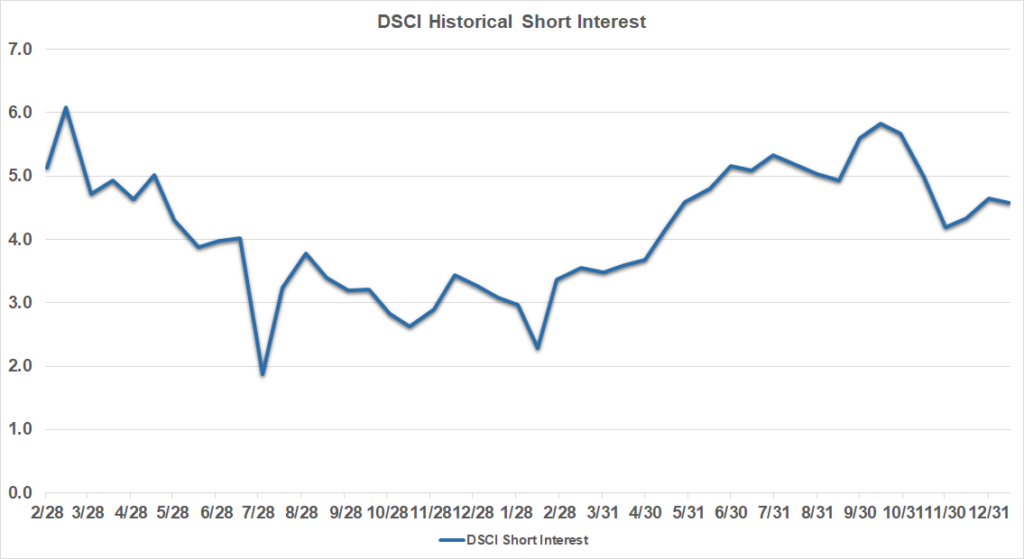
As indicated in the chart above, short interest in industry stocks moved higher during the period, from 4.3 days to cover at 12/15/21 to 4.6 as of 1/15/22. An increase in Herbalife Nutrition days to cover to 7.4 from 6.0 was a key reason for the increase in this measure for the overall direct selling stocks index. Aggregate “days-to-cover” have approximately doubled since bottoming in mid-February 2021.
Short interest can be a difficult indicator to analyze. On the one hand, an increase in short interest can be a bearish sign in that it indicates an increased view among investors that a stock is likely to decline based on any number of factors, such as a belief that the company’s fundamentals are deteriorating or a belief that it has run too far too fast. Conversely, as a stock moves higher, a significant short interest can serve as extra fuel on the fire as investors scramble to “buy to cover” their short positions and mitigate losses.
Analyst Sentiment Index
Our Analyst Sentiment Index inched up in January 2022 from December 2021 and remains near the peak level since its March 2020 establishment. During January, the number of sell-side analysts maintaining “buy” and “hold” ratings on industry stocks rose to 91%. In turn, the percentage of stocks which analysts recommend selling equaled just 9%.
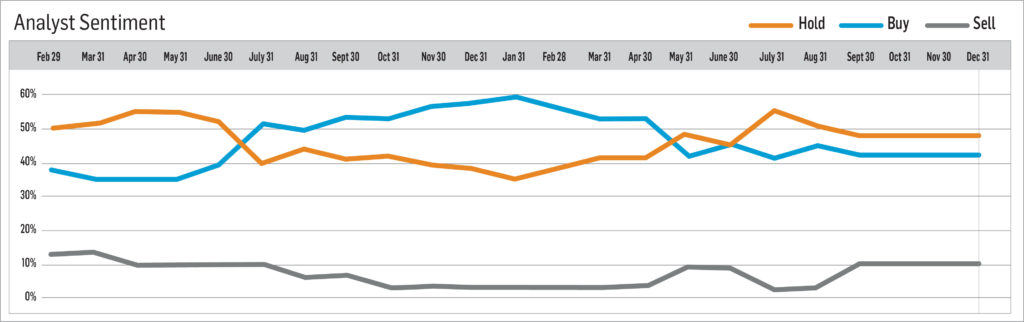
-
December 2021
Brought to you by Direct Selling Capital Advisors
Direct Selling Stocks Index Rallies in December
The Direct Selling Capital Advisors Direct Selling Index (DSCI) rose 4.1% in December, partially reversing an 8.5% decline in November. The positive performance in December marked the second up month in the last three. For the full year 2021, the DSCI increased 1.9%. At its peak in mid-2021, the compilation of direct selling stocks was up around 30% on the year. The Dow Jones Industrial Average (DJIA) moderately outperformed the DSCI in December, rising 5.4%. The Dow rallied 20.2% over the full year 2021.
A somewhat surprising aspect of the DSCI’s solid 4.1% increase in December was that the performance of the individual components of the index showed significant dispersion. Seven members rose; nine fell; and one was unchanged. Only one index component, large cap NuSkin Enterprises, Inc. (NYSE: NUS), posted a double-digit percentage increase (+15.7%), while large cap Betterware de Mexico (NASDAQ: BWMX) and small cap Medical Marijuana, Inc. (OTC: MJNA) posted declines of more than 10%.
The large cap subgroup of the DSCI significantly outperformed the small cap components. Five of the nine largest stocks posted gains during December, while only two of the eight small caps rose. One small cap stock was unchanged. In November, the performance of the two subgroups was quite similar.
From a longer-term perspective, the DSCI has gained a cumulative 61.1% since the March 1, 2020 index inception, compared with a 43.0% increase for the DJIA over the same period. In 2021, the DSCI inched 1.9% higher. The DJIA, on the other hand, rose 20.2% last calendar year.
The broad stock market has performed extremely well since the COVID-19 pandemic hit in early March 2020. Indeed, the total return of the S&P 500 Index was nearly 29% in 2021 as it outperformed the Dow Jones Industrials Index. Furthermore, the stock market is now more than 40% higher than before the pandemic hit and has more than doubled since the March 2020 pandemic lows. Despite the rally, the stock market, as measured by its P/E ratio based on consensus forward year earnings estimates, is valued quite similarly now to what it was in early 2020. Back then, the market traded at around 20x consensus 2020 earnings; today it trades at about 21x consensus 2022 projections. Both solid revenue increases and cost controls implemented during the crisis have boosted the underlying earnings of the typical company.
In sum, this represents a reasonably positive backdrop for the overall stock market in 2022. The U.S. Federal Reserve is likely to raise short-term interest rates several times this year, but, bowing to likely political pressure in a mid-term election year, the magnitude of the increases should be fairly modest. The central bank will probably decide to tolerate a higher level of inflation in the economy than it would have in the past.
Looking Forward
Direct selling stocks, as a group, underperformed in the stock market in 2021, reversing some of the group’s dramatic outperformance over the last ten months of 2020 (after the DSCI was established). Looking forward, two factors suggest that the DSCI could post improved results in 2022, particularly early in the year. First, the stock market seems reasonably valued (as noted above), and if it does move higher this year, the direct selling stocks, which generally are considered to carry higher risks—and rewards—than the overall market, seem poised to outperform.
Second, it appears that a number of DSCI components were the targets of tax loss selling in the late stages of 2021. As the calendar turns to 2022, that selling pressure will end. Two prime examples of this may be the large caps Tupperware Brands Corporations (NYSE: TUP) and Medifast, Inc. (NYSE: MED). After both stocks notably underperformed the overall stock market in 2021, they rose 5.6% and 2.2%, respectively in just the first two trading days of 2022.
More tangible data points for DSCI members will likely not be available until February when the companies begin to report 4Q 2021 earnings and provide 2022 guidance. These earnings results and managements’ revenue and earnings guidance will likely be major factors in the companies’ share price trajectories in 2022.
CHARTS & ANALYSIS
The DSCI is a market capitalization weighted index of all domestic public direct selling companies with a market capitalization of at least $25 million. The index is rebalanced monthly, and no single issue is permitted to represent more than 20% of its total value. In such an event, the excess weighting would be redistributed among the other index components.
The DSCI rose in December but still slightly underperformed the DJIA during the month. Specifically, the DSCI increased 4.1% during December, while the DJIA gained 5.4%. DSCI data is tracked back to March 1, 2020. The index has risen 61.1% since that date versus a 43.0% gain in the DJIA. At its peak in June 2021, the index had risen 115.6% since inception. For the full year 2021, the DSCI rose 1.9% versus a 20.2% gain for the DJIA.
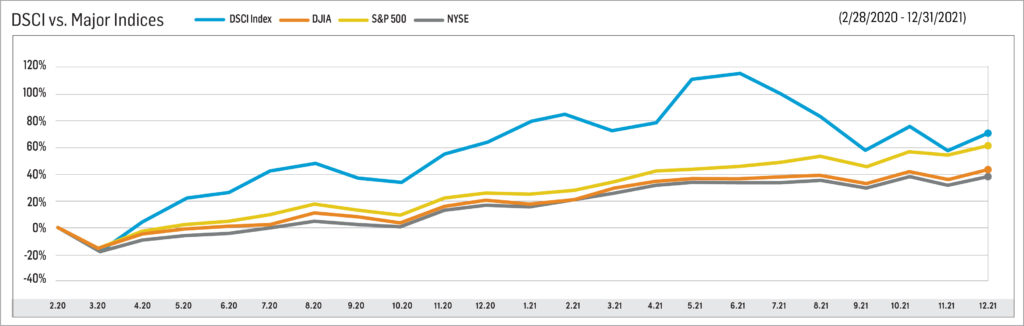
Large Cap
Betterware de Mexico (NASDAQ: BWMX) was the worst performer among the large cap direct selling stocks in December as it declined 19.6%. The DSCI, on the other hand, gained 4.1% during the month. Over the full year 2021, BWMX fell 36.7%. After a stellar performance from March 2020 through early July 2021, the stock has lost around 60% of its value over the last six months. In late October 2021, BWMX announced that its 3Q 2021 revenue and EBITDA increased 4% and decreased 3%, respectively, versus the year-ago period. Both measures represented substantially slower growth than during prior periods.
BWMX began trading in March 2020 after the Company’s merger with SPAC sponsor DD3 Acquisition Corp. BMWX specifically targets the Mexican market; it serves three million households through distributors and associates in approximately 800 communities throughout Mexico.
Tupperware Brands Corporation (NYSE: TUP) fell 2.2%in December, bringing its full year 2021 loss to 52.2%. Nonetheless, since March 1, 2020, TUP shares have appreciated a resounding 436.5%, the second highest return among all DSCI components over that period. (Only eXp World Holdings, Inc. has gained more: 604.8%.). In early November, TUP reported that 3Q 2021 sales declined 11.0% versus the year-ago period, as the lingering effects of COVID-19 affected its business.
In late November, TUP reported that it had raised $880 million in a new secured credit facility. The new facility lowers the company’s interest rate on term loans by more than 600 basis points; refinances the company’s existing credit facilities; and increases its liquidity by around $100 million.
For the second successive month, Nu Skin Enterprises, Inc. (NYSE: NUS) was the best performing large cap member of the DSCI. NUS rose 15.7% in December. (Indeed, NUS recorded the biggest percentage gain among all index members, large or small cap, during December.) For the full year 2021, NUS shares fell 7.0%. Since the March 2020 establishment of the index, NUS has increased 115.1%.
In early November, NUS reported 3Q 2021 results in which revenue and earnings per share declined 9% and 10%, respectively, from 3Q 2020 levels. Nevertheless, both measures exceeded analysts’ consensus estimates. NUS will report its 4Q 2021 results on February 16, 2022. On that day, NUS will host an investor day at its Provo, Utah headquarters and provide 2022 guidance.
Herbalife Nutrition, Inc. (NYSE: HLF) was the second best performing DSCI component in December, rising 9.6%. For the full year 2021, HLF lost 18.0%. Since the March 2020 establishment of the DSCI, the stock has appreciated 26.5%.
In early November, HLF reported mixed 3Q 2021 results. Its net sales were $1.4 billion, down 6% from 3Q 2020 levels due primarily to lingering effects of the pandemic, but the company’s EPS totaled $1.21, up $0.06 from $1.15 in the year-ago period.
Medifast, Inc. (NYSE: MED) shares gained 1.8% in December, marking its third consecutive monthly gain. In 2021, MED increased 9.4%, and since the March 1, 2020 establishment of the DSCI, the stock has risen 163.5%. As a result, MED has markedly outperformed the direct selling stock index benchmarks both for the full year 2021 and since DSCI inception.
In early November, MED reported impressive 3Q 2021 earnings results. Revenue and diluted EPS increased 52% and 22%, respectively, compared with the year-ago period. In addition, the company slightly boosted its full-year 2021 guidance ranges on both measures.
USANA Health Sciences, Inc. (NYSE: USNA) rose 1.5% in December, which lifted its full year 2021 gain to 29.8%. Since the March 2020 inception of the DSCI, USANA shares have appreciated 53.1%, beating the Dow’s 43.0% cumulative price increase.
In late October, USANA reported 3Q 2021 sales and EPS that declined 8.1% and 5.6%, respectively, from 3Q 2020. COVID-19-related disruptions impacted the company’s operations and ability to ship sufficient product to customers in 3Q 2021.
The DSCI’s best performer since its March 2020 establishment, eXp World Holdings, Inc. (NASDAQ: EXPI) declined 8.2% in December, cutting its full year 2021 gains to 9.8%. Since March 1, 2020, EXPI has rallied an astonishing 604.8%.
In early November, EXPI, the fastest growing real estate brokerage in the world, reported solid 3Q 2021 results; net sales and residential transaction volume nearly doubled versus 3Q 2020 figures, as the total number of its real estate agents rose 82% versus the tally twelve months ago. In mid-December, the company reported that its agent total exceeded 70,000, up dramatically from 41,313 at December 31, 2020.
The largest market cap stock in the DSCI, Primerica, Inc. (NYSE: PRI), rose 4.2% in December, approximately in line with the 4.1% increase in the DSCI for the month. The stock appreciated 18.7% in 2021 and is 39.9% higher since the March 2020 establishment of the DSCI.
On November 8, PRI, a leading provider of financial services in the U.S. and Canada, reported solid 3Q 2021 results. Revenue totaled $693.2 million, up 22% versus the year-ago period. The company benefitted from continued strong momentum in investment and product sales in the period ended September 30, 2021. Indeed, PRI has now put into force more than $900 billion of term life insurance coverage for its customers. Earnings per share in 3Q 2021 was $2.82, flat versus 3Q 2020.
On November 17, PRI’s Board authorized a $275 million share repurchase program through December 31, 2022. This program replaces a $300 million initiative that was approved in February 2021 and was due to expire on June 30, 2022.
The Beachbody Company, Inc. (NYSE: BODY) stock was the second weakest large cap component in the DSCI in December, declining 8.8%. In mid-November, Beachbody, a leading subscription health and wellness com0pany, reported that 3Q 2021 revenue was $208.1 million, down 17% from 3Q 2020, as at-home fitness demand softened. In addition, the company recorded a 3Q 2021 adjusted EBITDA loss of $43.4 million compared with a gain of $31.4 million in the year-ago period.
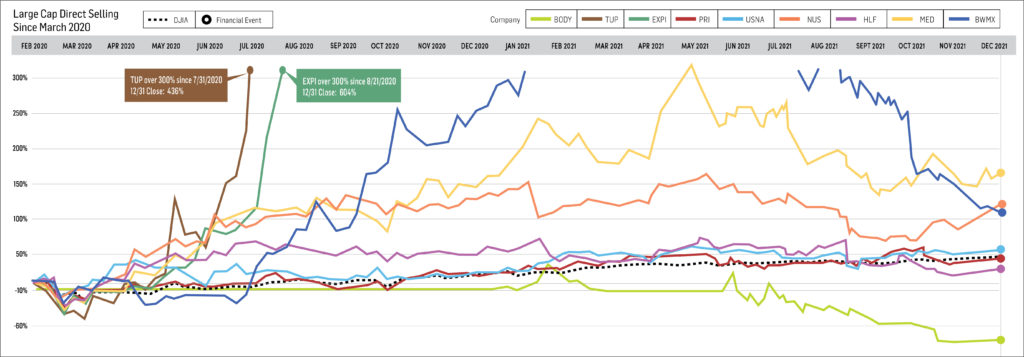
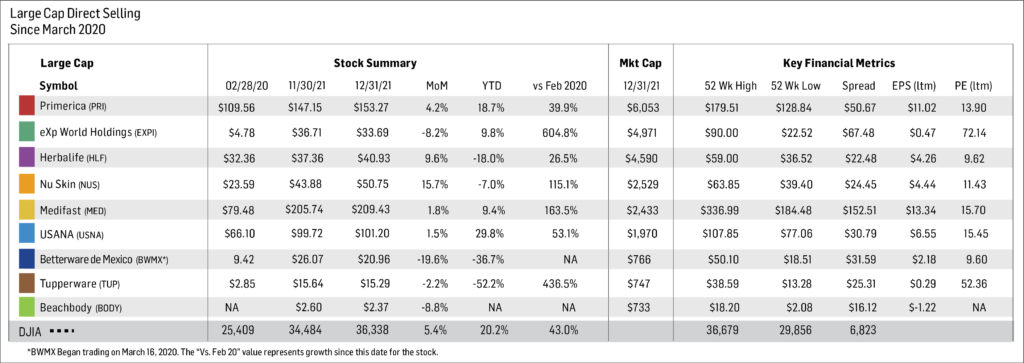
Small Cap
Our small cap tracking set generally trended lower in December as five of the eight components declined and one was unchanged. The strongest performer among the small caps was Nature’s Sunshine Products, Inc. (NASDAQ: NATR), a leading natural health and wellness company. NATR rose 8.8% in December. The stock gained 35.0% in 2021 and 138.2% since DSCI inception. Over all three periods, NATR handily outperformed the DSCI.
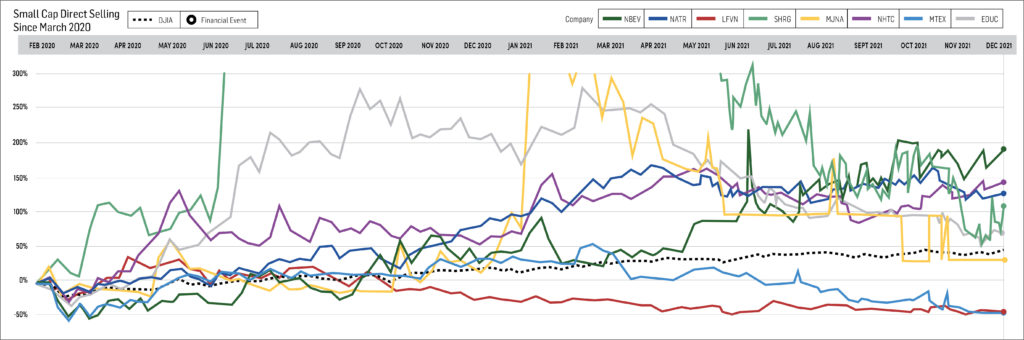
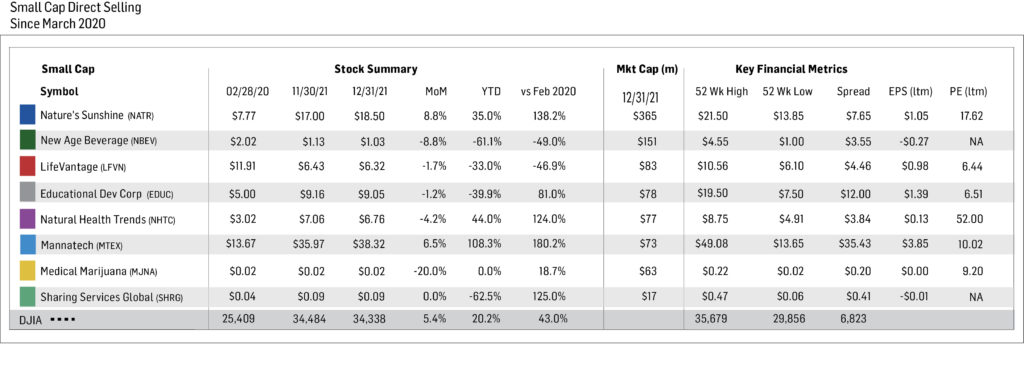
Short Interest Data & Analysis
The following chart is an aggregate index of “days to cover” among the entire tracking set. Days to cover is a measurement determined by dividing the total outstanding short interest by average daily trading volume.
As indicated in the chart above, short interest in industry stocks declined during the period, from 5.0 days to cover at 11/15 to 4.3 as of 12/15. The decline was primarily attributable to a significant decline in short interest in TUP, from 8.4 days to cover at 11/15 to 4.3 as of 12/15. Aggregate days-to-cover have increased about 125% since bottoming in mid-February.
Short interest can be a difficult indicator to analyze. On the one hand, an increase in short interest can be a bearish sign in that it indicates an increased view among investors that a stock is likely to decline based on any number of factors, such as a belief that the company’s fundamentals are deteriorating or a belief that it has run too far too fast. Conversely, as a stock moves higher, a significant short interest can serve as extra fuel on the fire as investors scramble to “buy to cover” their short positions and mitigate losses.

Analyst Sentiment Index
Our Analyst Sentiment Index was unchanged in December from November and remains near the peak level since its March 2020 establishment. During December, the number of sell-side analysts maintaining “buy” and “hold” ratings on industry stocks was 90%. In turn, the percentage of stocks which analysts recommend selling equaled just 10%.

-
November 2021
Brought to you by Direct Selling Capital Advisors
Direct Selling Stocks Index Falls 8.5% in November
In November 2021, the Direct Selling Capital Advisors Direct Selling Index (DSCI) fell 8.5%, reversing a 10.0% rally in October. The DSCI is now down slightly YTD (-0.6%). At its peak in mid-2021, the compilation of direct selling stocks was up around 30% on the year. The Dow Jones Industrial Average (DJIA) also fell in November (-3.7%), but that still represented significant outperformance versus the DSCI.
The weakness among the DSCI components in November was broad based, but not as uniform as in previous down index months during 2021. More specifically, twelve of the 17 DSCI members retreated during November: Eight by 10% or more, but five member stocks rose during the month.
The largest decliner of DSCI members was large cap The Beach Body, Inc. (NYSE: BODY), which lost roughly half its value in November. The company reported a significant year-over-year revenue decline in 3Q 2021 and made marked cuts in its full-year 2021 sales and adjusted EBITDA guidance.
Interestingly, the performance of the large and small cap subgroups of the DSCI were quite similar. For example, three of the nine large cap and two of the eight small cap stocks rose in November. In addition, just over half the large caps declined by more than 10% during the month, while just under half of smaller cap names incurred similar declines. Typically, larger cap stocks outperform smaller caps during times of maximum market stress.
Gauging performance from a longer-term perspective, the DSCI has gained a cumulative 57.1% since the March 1, 2020 index inception, compared with a smaller 35.7% increase for the DJIA over the same period. Year to date, the DSCI has incurred a slight 0.6% loss—a fairly impressive figure given that the index has lost an aggregate 30% since June 30, 2021. The DJIA has advanced 14.1% since year-end 2020.
The broad stock market corrected in November, particularly late in the month, as the Omicron COVID variant surfaced in southern Africa, and Jerome Powell, Chairman of the Fed, told Congress it could begin to taper its bond buying program even faster than he suggested in early November. The direct selling stocks, generally considered a higher risk group, reacted poorly to these uncertainties. These factors, which are unlikely to be resolved for some time, along with fears about the effects of rising inflation, are likely to dominate stock market sentiment over the intermediate term.
Looking Forward
Investors are grappling with conflicting data points. On the one hand, the U.S. economy is recovering strongly, and employment opportunities are growing across almost all industries. Such a backdrop should be good for stocks. On the other hand, the stock market performed well over the first eleven months of 2021, and some investors are fearful that the uncertainties outlined above will prompt further selling before year end.
These macro questions are weighing on the direct selling stocks. A further complication is that a number of DSCI names, including Betterware de Mexico (NASDAQ: BWMX), Tupperware Brands Corporation (NYSE: TUP) and BODY, announced somewhat disappointing 3Q 2021 revenue and earnings results. Given all this, and noting that the next major data point for most DSCI companies—4Q 2021 earnings—will not be released until late January or February of 2022, DSCI stocks as a group seem unlikely to stage a significant reflex rally in December and may trade in a fairly narrow range during the month.
CHARTS & ANALYSIS
The DSCI is a market capitalization weighted index of all domestic public direct selling companies with a market capitalization of at least $25 million. The index is rebalanced monthly, and no single issue is permitted to represent more than 20% of its total value. In such an event, the excess weighting would be redistributed among the other index components.
The DSCI declined sharply in November and underperformed the DJIA during the month. Specifically, the DSCI fell 8.5% during the month, while the DJIA declined 3.7%. DSCI data is tracked back to March 1, 2020, and the index has risen 57.1% since that date versus a 35.7% gain in the DJIA. At its peak in June 2021, the index had risen 115.6% since inception. On a year-to-date basis, the DSCI has recorded a slight loss of 0.6%, versus a 14.1% gain for the DJIA.
Large Cap
- Betterware de Mexico (NASDAQ: BWMX) outperformed the DSCI in November, declining 4.1% versus an 8.5% fall for the DSCI. BWMX is down 21.2% YTD. After a stellar performance from March 2020 through early July 2021, the stock has lost about half its value over the past five months. In late October 2021, BWMX announced disappointing 3Q 2021 earnings. Its 3Q 2021 revenue and EBITDA increased 4% and decreased 3%, respectively, versus the year-ago period. Both measures represented substantially slower growth than during prior periods. BWMX began trading in March 2020 after the Company’s merger with the SPAC DD3 Acquisition Corp. BMWX specifically targets the Mexican market; it serves three million households through distributors and associates in approximately 800 communities throughout Mexico.
- Tupperware Brands Corporation (NYSE: TUP) plunged 29.7% in November, pushing its YTD losses to 51.1%. Nevertheless, since March 1, 2020, TUP shares have appreciated a resounding 448.8%. In early November, the company reported that 3Q 2021 sales declined 11.0% versus the year-ago period as the lingering effects of COVID-19 affected TUP’s business. In late November, TUP reported that it had raised $880 million in a new secured credit facility. The new facility, which lowers the company’s interest rate on term loans by more than 600 basis points, refinances the company’s existing credit facilities and increases its liquidity by around $100 million.
- Nu Skin Enterprises, Inc. (NYSE: NUS) stock rose 9.3% in November, making it the best performing large cap member of the DSCI. This monthly gain cut its YTD losses to 19.6%. Since the March 2020 establishment of the index, NUS has increased 86.0%. In early November, NUS reported 3Q 2021 results in which revenue and earnings per share declined 9% and 10%, respectively, from 3Q 2020 levels. Nonetheless, both measures exceeded analysts’ consensus estimates.
- Herbalife Nutrition, Inc. (NYSE: HLF) fell 19.5% in November, which brought its full year 2021 loss to 25.1%. Since the March 2020 establishment of the DSCI, the stock has gained 15.5%. In early November, HLF reported mixed 3Q 2021 results. Its net sales were $1.4 billion, down 6% from 3Q 2020 levels due primarily to lingering effects of the pandemic, but the company’s EPS totaled $1.21, up $0.06 from $1.15 in the year-ago period.
- Medifast, Inc. (NYSE: MED) shares rose 4.8% in November marking its second consecutive monthly gain. For the eleven months ended November, MED has appreciated 7.5%. Since the March 1, 2020 establishment of the DSCI, the stock has risen 158.9%. On all three return measures, MED has handily outperformed the direct selling stock index benchmarks. In early November, MED reported impressive earnings results. Revenue and diluted EPS increased 52% and 22%, respectively, compared with the year-ago period. In addition, the company slightly boosted its full-year guidance ranges on both measures. The stock trades at a P/E multiple of about 14.6x, an approximate 30% discount to the overall stock market’s valuation—despite its much faster projected revenue growth.
- USANA Health Sciences, Inc. (NYSE: USNA) joined MED and PRI as the only three large cap members of the DSCI to post gains in November. USANA shares increased 2.7% in the month which boosted its YTD gain to 27.9%. Since the March 2020 inception of the DSCI, USANA shares have appreciated 50.9%, beating the Dow’s 35.7% cumulative price increase. In late October, USANA reported 3Q 2021 sales and EPS that declined 8.1% and 5.6%, respectively, from 3Q 2020. COVID-19-related disruptions impacted the company’s operations and ability to ship sufficient product to customers in 3Q 2021.
- The DSCI’s best performer since its March 2020 establishment, eXp World Holdings, Inc. (NASDAQ: EXPI) reversed some of those gains in November. During the month, it fell 28.9%. Nevertheless, EXPI is up 19.6% over the eleven months ended November. Since March 1, 2020, EXPI has rallied an astonishing 668.0%. In early November, EXPI reported solid 3Q 2021 results; net sales and residential transaction volume nearly doubled versus 3Q 2020 figures, as the total number of its agents rose 82% versus the tally twelve months ago.
- The biggest market cap stock in the DSCI, Primerica, Inc. (NYSE: PRI), declined 12.5% in November. The stock is 14.0% higher over the first eleven months of 2021 and 34.3% higher since the March 2020 inception of the DSCI. On November 8, PRI reported solid 3Q 2021 results. Revenue totaled $693.2 million, up 22% versus the year-ago period. The company benefitted from continued strong momentum in investment and product sales in the period ended September 30, 2021. Earnings per share in the quarter was $2.82, flat versus 3Q 2020. On November 17, PRI’s Board authorized a $275 million share repurchase program through December 31, 2022. This program replaces a $300 million initiative that was approved in February 2021 and was due to expire on June 30, 2022.
- As previously noted, The Beachbody Company, Inc. (NYSE: BODY) stock was the weakest component in the DSCI in November, declining 50.6%. On November 15, Beachbody, a leading subscription health and wellness company, reported disappointing 3Q 2021 results. Revenue was $208.1 million, down 17% from 3Q 2020, as at-home fitness demand softened. In addition, the company recorded an adjusted EBITDA loss of $43.4 million compared with a gain of $31.4 million in the year-ago period.
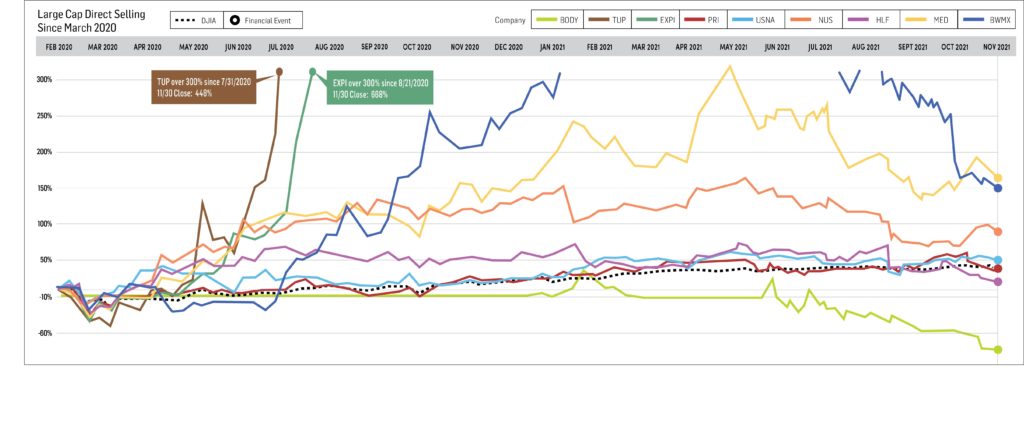
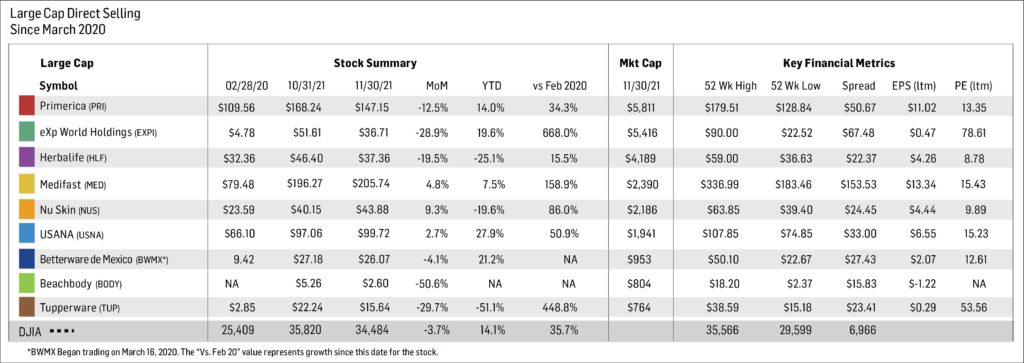
Small Cap
Our small cap tracking set generally trended lower in November, as six of the eight components declined, including three by more than 10%. The standout positive performer among the small caps was Medical Marijuana, Inc. (OTC: MJNA), a cannabis company with three businesses in the non-psychoactive cannabinoid space. MJNA increased 15.0% in November. The stock has appreciated 25.0% over the first eleven months of 2021 and 48.4% since DSCI inception.
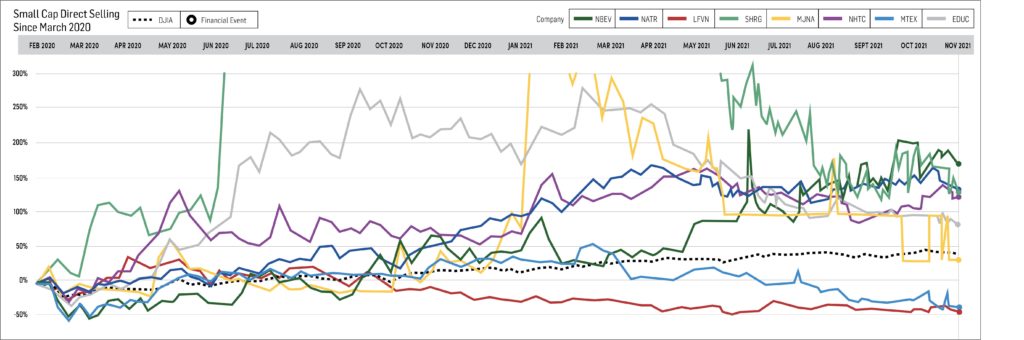
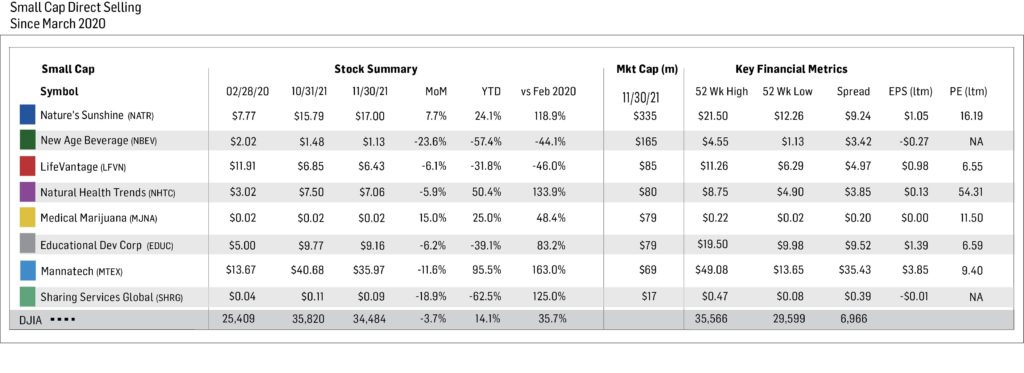
Short Interest Data & Analysis
The following chart is an aggregate index of “days to cover” among the entire tracking set. Days to cover is a measurement determined by dividing the total outstanding short interest by average daily trading volume.
As indicated in the chart above, short interest in industry stocks moved slightly lower in mid-November. Aggregate “days-to-cover” have increased about 150% since bottoming in mid-February.
Short interest can be a difficult indicator to analyze. On the one hand, an increase in short interest can be a bearish sign in that it indicates an increased view among investors that a stock is likely to decline based on any number of factors, such as a belief that the company’s fundamentals are deteriorating or a belief that it has run too far too fast. Conversely, as a stock moves higher, a significant short interest can serve as extra fuel on the fire as investors scramble to “buy to cover” their short positions and mitigate losses.
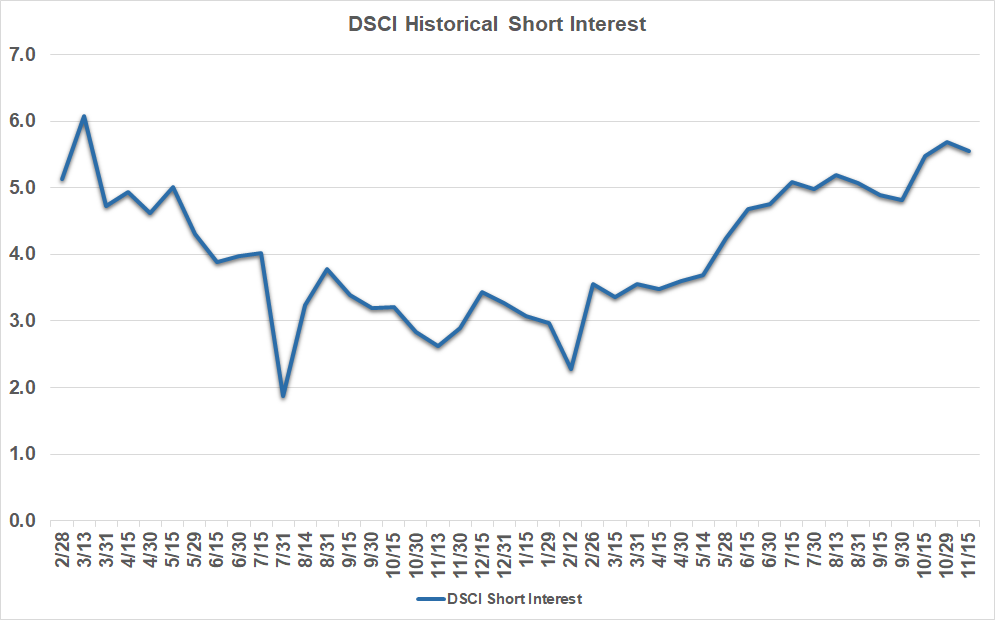
Analyst Sentiment Index
Our Analyst Sentiment Index was unchanged in November from October and remains near the peak level since its March 2020 establishment. During November, the number of sell-side analysts maintaining “buy” and “hold” ratings on industry stocks was 90%. In turn, the percentage of stocks which analysts recommend selling equaled just 10%.
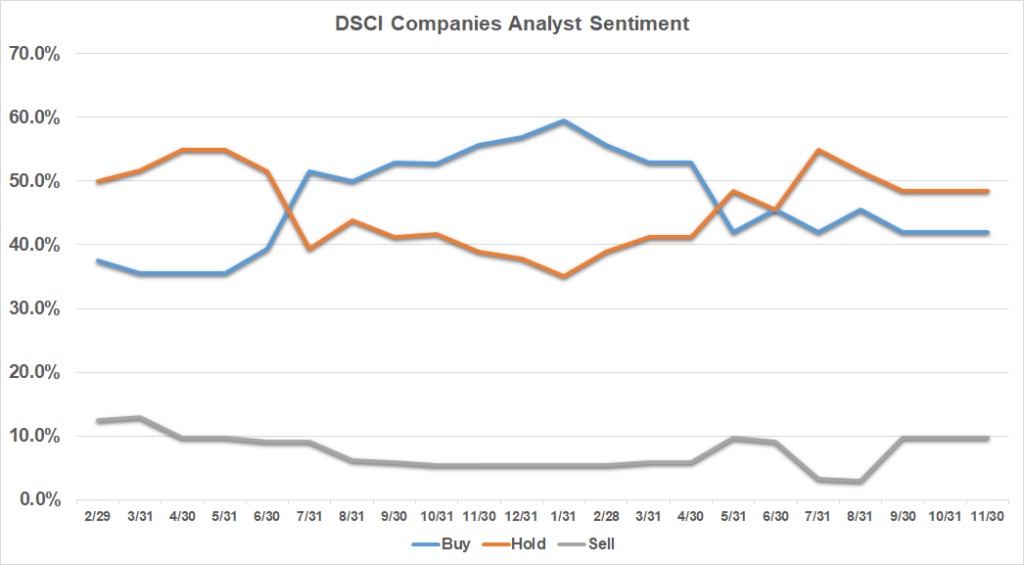
-
October 2021
Brought to you by Direct Selling Capital Advisors
Direct Selling Stocks Index Rebounds Nicely in October
The Direct Selling Capital Advisors Direct Selling Index (DSCI) rose 10% in October, partially reversing a three-month decline that had cut the index’s value by a cumulative 30%. This strengthening was fairly consistent among the index members, with six of the nine large cap stocks and seven of the eight small cap stocks improving. With this rise, the DSCI outperformed the Dow Jones Industrial Average (DJIA), which gained 5.8% during October.
Since March 1, 2020, when the index tracking set began, the DSCI has gained a cumulative 74.5%, while the DJIA has gained 41% during the same period. Year to date, the DSCI has appreciated 10.4%, while the DJIA has gained 18.5%.
The earnings reporting season has gotten off to a mixed start for DSCI component companies. eXp World Holdings, Inc. and Medifast, Inc. (NYSE: MED) each reported robust third quarter revenue growth. On the other hand, BWMX, Tupperware Brands Corporation (NYSE: TUP) and Nu Skin Enterprises, Inc. (NYSE: NUS) announced somewhat disappointing results. Lingering effects of the COVID-19 pandemic impacted sales at all three companies. In addition, exceptionally strong year-ago comparable periods impacted results on a relative basis.
Large Cap Stocks
- Betterware de Mexico (NASDAQ: BWMX) fell 23.6% in October, causing it to lag behind other large cap DSCI components. The company’s third quarter results showed sluggish growth compared to its reports from 2020 and the first half of 2021. Like many of the other stocks, year-over-year comparisons to its outstanding performance in the same quarter of 2020 have caused a significant impact on perceived performance. BWMX’s stock price is down 17.9% since the start of 2021.
- Tupperware Brands Corporation (NYSE: TUP) gained 5.3% in October, cutting its year-to-date losses to 30.4%. Since the beginning of the tracking set, TUP shares have gained an astonishing 680.4%. While the company reported mixed third quarter results, the company’s EPS was $1.19, and well above consensus analysts’ estimates of $0.71 per share. Sales did decline 11% in the third quarter versus last year, due in part to persistent negative effects of the COVID-19 pandemic.
- Nu Skin Enterprises, Inc. (NYSE: NUS) was the highest dividend yielding stock in the DSCI (3.73%), but underperformed the DSCI in October, declining 0.8%. Shares are down 26.4% in the first ten months of 2021 but are still up 70.2% since the March 2020 establishment of the DSCI. The company’s third quarter results reduced its full-year 2021 EPS guidance to $3.93-$4.03 from $4.30-$4.50, and third quarter revenue was down 9% from same quarter last year, shifts that are attributed in part to pandemic disruptions of selling and promotional activities in several markets, most importantly Mainland China and Southeast Asia.
- Herbalife Nutrition, Inc. (NYSE: HLF) reported third quarter results in line with the quarterly guidance it issued on September 13. Net sales were down 6% from the same quarter in 2020 to $1.4 billion and lingering effects of the pandemic impacted activity among its independent distributors. Adjusted diluted EPS was $1.21 in the quarter, up from $1.15 in the year-ago period, allowing Herbalife to maintain its full year 2021 adjusted diluted EPS guidance of $4.55-$4.95 per share. HLF shares increased 9.5% in October, which cut its year-to-date loss to 7%, and have appreciated 43.4% overall since March 2020.
- Medifast, Inc. (NYSE: MED) shares improved modestly (+1.9%) in October, reversing a small portion of its approximate 35% decline in August and September combined. Year to date, MED has gained 2.6% and 146.9% since March 1, 2020. The company’s third quarter financial report was strong, showing increases in revenue (52%) and diluted EPS (22%) over the third quarter of 2020. As a result, the company has increased the midpoint of its full year 2021 revenue and EPS guidance by 3.1% and 1.3%, respectively. MED stock was up approximately 13% on a November month-to-date basis as of its November 5th closing price.
- USANA Health Sciences, Inc. (NYSE: USNA) beat analysts’ expectations with its third quarter revenues and earnings, even though both measures declined when compared to last year’s results. Sales in the quarter were down 8.1% ($274.4 million) and EPS was $1.36 versus $1.44 from the third quarter of 2020, as COVID-19-related disruptions and lockdowns in several key markets affected the company’s ability to operate and ship products. The company’s shares rose 5.3% in October and have gained 24.5% since January 1, 2021, creating an overall appreciation of 46.8% since the tracking set began and beating the Dow’s 41% cumulative increase.
- eXp World Holdings, Inc. (NASDAQ: EXPI) increased 29.7% in October, bringing its year-to-date gain to 68.1%. Since the tracking set began on March 1, 2020, EXPI has rallied an unparalleled 979.5%. The company’s third quarter results were also robust, with net sales and residential transaction volume during the quarter nearly doubling the previous year’s third quarter totals. The key driver for EXPI appears to be that the total number of EXPI agents increased 82% in the third quarter of 2021 from third quarter 2020 levels. Adjusted EBITDA for the company was $23.1 million in the quarter, up 6% from the second quarter of 2021.
- Primerica, Inc. (NYSE: PRI) is the largest market cap stock in the DSCI and performed approximately in line with the index in October, rising 9.5%. Year to date, the stock has appreciated 30.3%, and is 53.6% higher than its March 2020 levels. The company’s second quarter results, reported in early August, showed that revenue and earnings per diluted share increased 25% and 28%, respectively, versus the same quarter of 2020.
- The Beachbody Company, Inc. (NYSE: BODY) was one of the three large cap constituents of the DSCI to decline in October (-5.1%). On November 1, Beachbody announced that Jean-Michel Fournier, the former CEO of a well-known media company, will lead its global partnership and international development efforts.
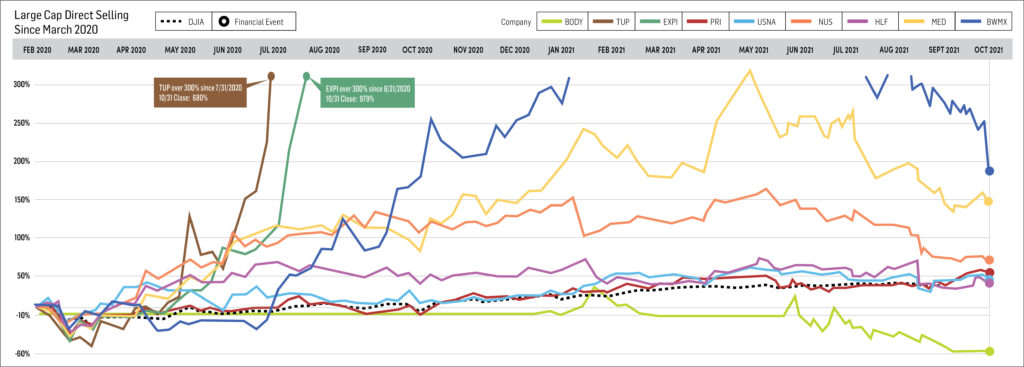
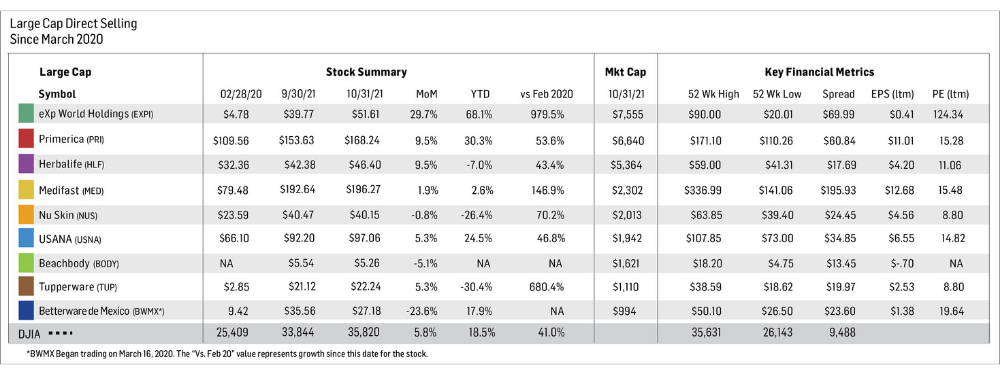
Small Cap Stocks
The small cap tracking set saw a solid October, as seven of the eight component stock prices rose.
- Mannatech, Incorporated (NASDAQ: MTEX) was the best small cap performer in October with a 24.5% increase. The stock appreciated 121.1% in the first ten months of 2021, and 197.5% since the DSCI’s inception.
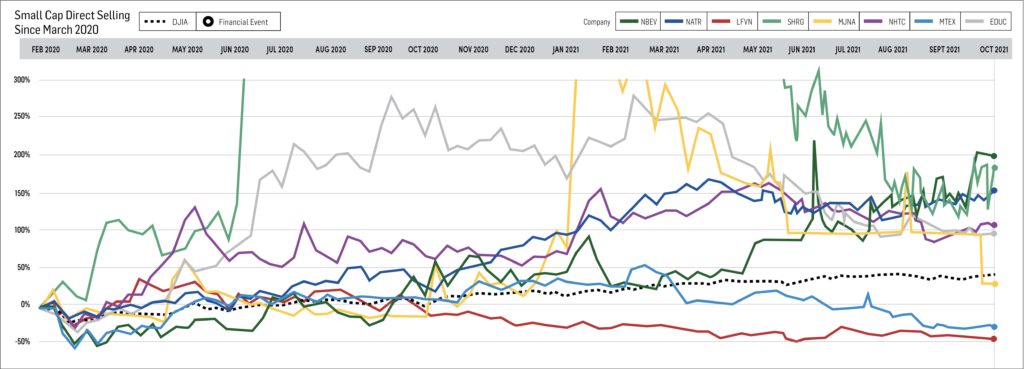
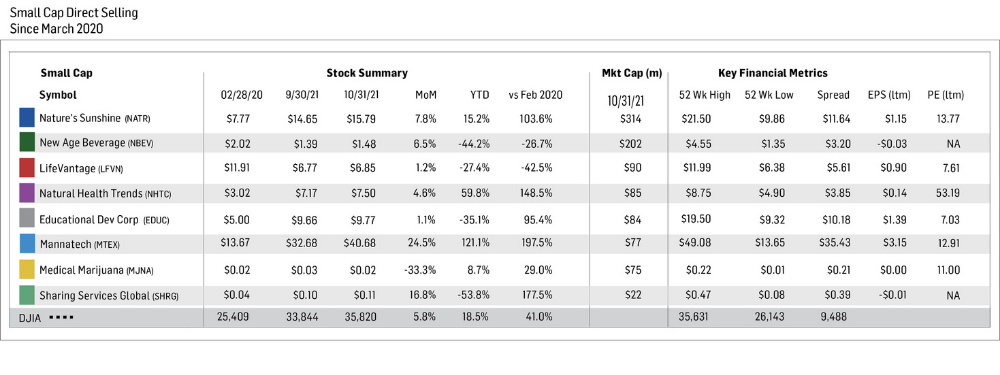
Short Interest Data and Analysis
Short Interest in industry stocks moved higher in October after a slight downturn in September. Aggregate “days-to-cover” have increased around 150% since bottoming in mid-February and is at its highest level since the index tracking set began in March 2020. This statistic does mean more investors are betting DSCI stocks will decline, but it also provides significant buying power that can accelerate any move higher.
During October, the number of sell-side analysts maintaining “buy” and “hold” ratings on industry stocks was 90%. The percentage of stocks which analysts recommend selling totaled 10%.
“The markets face some important challenges in November,” Johnson said. “The Federal Reserve plans to begin tapering its bond buying program this month. Moreover, supply chain issues continue to impact the economy, and the U.S. Administration is struggling to pass extensive social spending and infrastructure bills.”
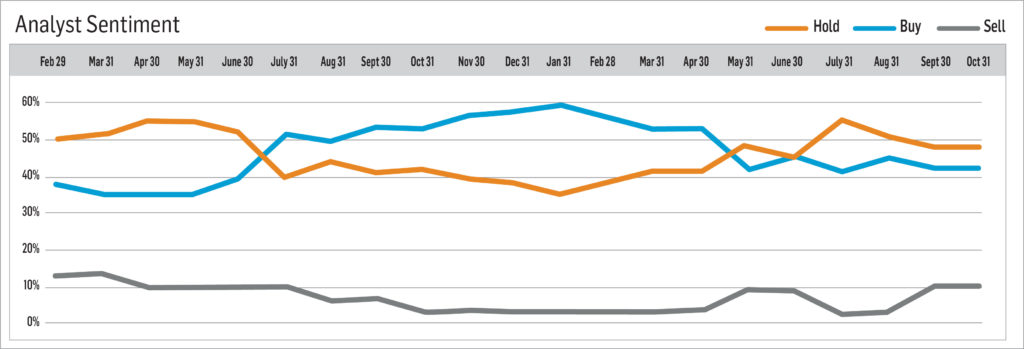
-
September 2021
Brought to you by Direct Selling Capital Advisors
Direct Selling Stocks Experience Difficult Third Quarter
The Direct Selling Capital Advisors Direct Selling Index (DSCI) declined 17.8 percent in September, marking its third successive monthly decline, following a dip of 8.4 percent in August and 7.4 percent in July. The Dow Jones Industrial Average (DJIA) also sharply declined in September (-4.3 percent).
This decline was experienced by the majority of the DSCI members, with 10 losing more than 10 percent and six losing more than 15 percent of their value during the month. The exceptions were large cap stock Primerica, Inc. (NYSE: PRI) and small cap stock Natural Health Trends Corp. (NASDAQ: NHTC), which both posted gains.
The DSCI has gained a cumulative 58.6 percent since the tracking set began on March 1, 2020, while the DJIA gained a more muted 33.2 percent. At its peak in June 2021, the DSCI had risen 115.6 percent since March 2020. Year-to-date, the DSCI gained 0.3 percent, which is actually impressive given its performance the last three months. By comparison, the DJIA has advanced 12 percent year-to-date.
Investors have had to grapple with a long list of uncertainties, including rising inflation fears, signs of slowing economic growth, ten-year U.S. government bond yields, and almost daily announcements of global supply chain bottlenecks. When some of these issues are resolved, or at least stop worsening, the stock market could improve, which could in turn make for a better environment for direct selling stocks.
Large Cap Stocks
- Betterware de Mexico (NASDAQ: BWMX) fell 15.9 percent in September despite announcing a $50 million share repurchase program. The company reported strong second quarter earnings in early August, and revenue, EBITDA and net income increased 81 percent, 92 percent and 72 percent, respectively, compared to the prior year. BWMX shares are up 7.4 percent since the start of 2021.
- Tupperware Brands Corporation (NYSE: TUP) declined 11.5 percent in September, bringing its year-to-date losses to 33.9percent. Even so, since March 1, 2020, TUP shares have gained a remarkable 641.1 percent. The company reported second quarter results that easily surpassed Wall Street’s expectations, and quarterly net sales and adjusted EBITDA each increased 17 percent versus the year-ago period.
- Nu Skin Enterprises, Inc. (NYSE: NUS) had the highest dividend yield (3.76 percent) in the DSCI, but its stock declined 20.1percent in August. The company’s shares are down 25.9 percent for the first nine months of 2021, but are still up 71.5 percent since the March 2020 establishment of the DSCI. In early August, NUS reported positive second quarter earnings results and boosted its full-year 2021 EPS guidance to $4.30-$4.50, about a 5 percent increase from the guidance it issued just three months before.
- Herbalife Nutrition, Inc. (NYSE: HLF) declined 17.5 percent in September, primarily because the company cut its third quarter and full-year 2021 earnings projections to $1.00-$1.20 per share and $4.55-$4.95 a share, respectively, from the $1.05-$1.25 and $4.70-$5.10 guidance it issued in early August. The pandemic’s lingering effects resulted in what the company described as “lower than expected levels of activity” among its independent distributors. Year to date, HLF shares have declined 15.1 percent, but appreciated 31 percent since March 2020.
- Medifast, Inc. (NYSE: MED) shares declined 15.5 percent in September after falling 20.2 percent in August. Year-to-date, MED has gained 0.7 percent, and risen 142.4 percent since the March 1, 2020 establishment of the DSCI. The company reported robust second quarter results, with revenues and diluted EPS increasing 79 percent and 113 percent, respectively, compared to the prior year period.
- USANA Health Sciences, Inc. (NYSE: USNA) announced that its third quarter sales are expected to be about 10 percent lower than the same period last year. EPS is now expected to be in the $1.28-$1.33 range, down from $1.44 in the third quarter of 2020, citing COVID-19-related disruptions and lockdowns in several key markets that affected the company’s ability to operate and ship products. USANA did perform better in September than most DSCI components, declining only 5 percent and, year-to-date, the stock has gained 18.3 percent. Since the March 2020 inception of the DSCI, USANA shares have appreciated 39.5 percent, beating the Dow’s 33.2 percent cumulative price increase.
- eXp World Holdings, Inc. (NASDAQ: EXPI) shares declined 13.3 percent in September, cutting its year-to-date gain to 29.6 percent. Since March 1, 2020, EXPI has rallied an astonishing 732 percent. The company’s second quarter results were strong, posting a net sales increase of 183 percent compared with the third quarter of 2020. Equally important, EXPI declared a $0.04 per share quarterly cash dividend to shareholders, its first-ever dividend.
- Primerica, Inc. (NYSE: PRI) is the biggest market cap stock in the DSCI and was a standout performer in September, rising 0.5 percent. The stock is 19 percent higher over the first three quarters of 2021, and 40.2 percent higher since the March 2020 inception of the DSCI. The company’s second quarter earnings included a 25 percent increase in revenue and an earnings per diluted share increase of 28 percent.
- The Beachbody Company, Inc. (NYSE: BODY) stock was the weakest component in the DSCI in September, declining 28.3 percent. Beachbody’s second quarter results showed a 2 percent increase in revenue. Most notably, digital revenue rose 20 percent.
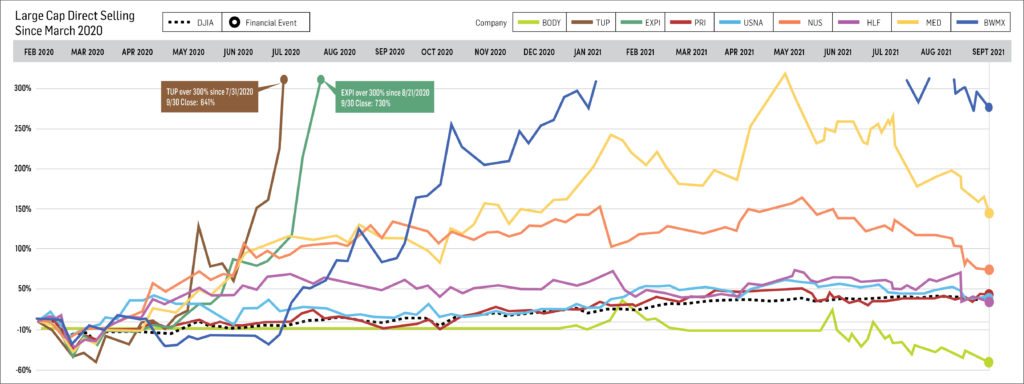
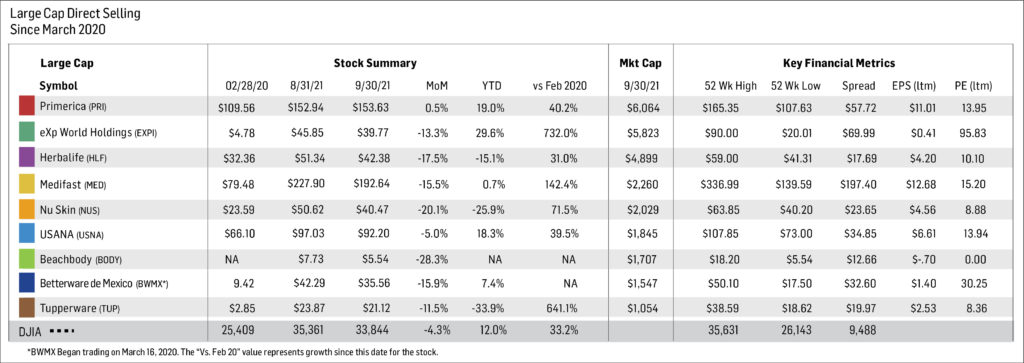
Small Cap Stocks
In spite of a difficult month, the small cap tracking set outperformed its large cap peers.
“Somewhat surprisingly, the small-cap members of the DSCI generally performed better than their large-cap peers in September,” said Stuart Johnson, Direct Selling Capital Advisors CEO. “While seven of the nine large caps declined by double figure percentages in the month, only three of the eight small caps fell by 10% or more. Typically, large cap stocks outperform small caps during times of maximum stress in the market.”
- Natural Health Trends Corp. (NASDAQ: NHTC) was the only small cap to gain in September (+7.3 percent). The stock has appreciated 52.7 percent over the first nine months of 2021 and 137.6 percent since DSCI inception. Natural Health Trends was notified on September 30, 2021 that a non-public investigation by the SEC, which began in August of 2016, was concluded and that the commission did not recommend enforcement action.
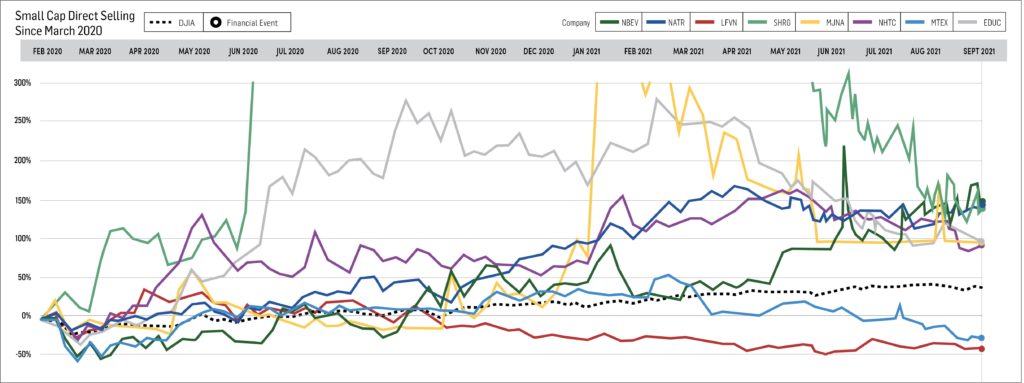
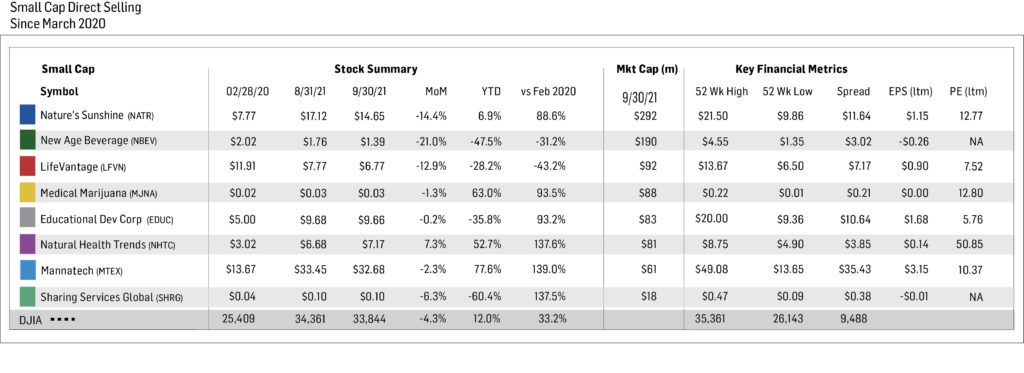
Short Interest Data and Analysis
Short interest in industry stocks peaked in mid-August and moved slightly lower through September. Aggregate “days-to-cover” have more than doubled since bottoming in mid-February.
During September, the number of sell-side analysts maintaining “buy” and “hold” ratings on industry stocks declined to around 90 percent from 97 percent in August. The percentage of stocks which analysts recommend selling also rose to 10 percent from just 3 percent in August.
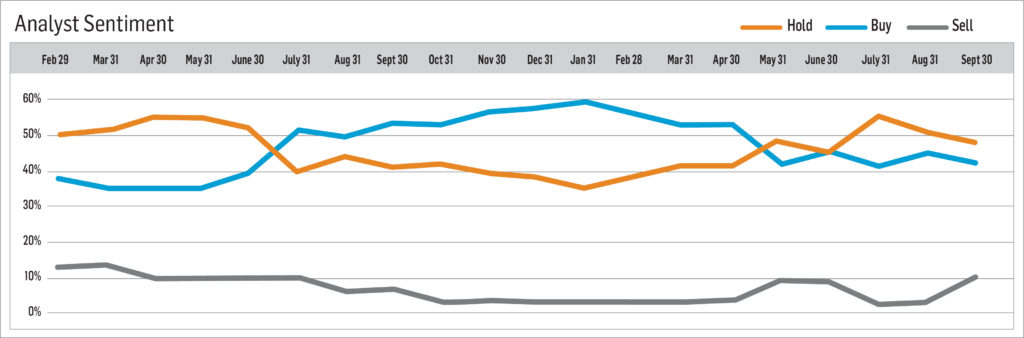
-
August 2021
Brought to you by Direct Selling Capital Advisors
Direct Selling Stocks Significantly Decline in August
The Direct Selling Index (DSCI) fell 8.4 percent in August, the second consecutive noticeable decline and the index’s weakest monthly performance since March 1, 2020. The Dow Jones Industrial Average (DJIA), by contrast, rose over the last two months, increasing 1.9 percent in August and 1.3 percent in July.
In August, three members of the DSCI fell by double-digit percentage points—Medifast, Inc. (NYSE: MED); The Beachbody Company, Inc. (NYSE: BODY); and Sharing Services Global Corporation (OTC: SHRG)—and an equal number increased by more than 10 percent–eXp World Holdings, Inc. (NASDAQ: EXPI); Tupperware Brands Corporation (NYSE: TUP); and Mannatech, Inc. (NASDAQ: MTEX). Surprisingly, BODY and SHRG were among the stocks that also declined by more than 10 percent in July.
In total, 11 of the 17 stocks in the DSCI lost value during August, including seven of the eight small-cap stocks.
Since the DSCI tracking period began in March 2020, the DSCI has gained a cumulative 82.8 percent, compared to the DJIA’s gain of 35.9 percent. Year-to-date, the DSCI has increased 15.7 percent, while the DJIA has gained 14.2 percent.
The DSCI’s disappointing performance over the last two months essentially erases the outsized gains realized over the previous two months, particularly the 18.4 percent increase in May.
“An issue facing the direct selling stocks, and likely a principal reason for the pronounced declines in the DSCI over the last two months, has been investors’ increasing focus on large cap stocks, particularly mega-cap technology stocks, and the resultant narrowing of the group of advancing stocks,” said Stuart Johnson, Direct Selling Capital Advisors CEO. “These giant stocks are heavily represented in the DJIA and account for a continuation of that index’s rise over recent months. Conversely, many direct selling stocks are small to mid-caps and have been a source of funds for investors recently. As an illustration of this current preference for larger cap stocks, it is likely no coincidence that five of the nine large cap components of the DSCI increased in August, while only one of the eight small cap members gained.”
It seems possible that the significant declines experienced in July and August will be at least partially reversed in September and, factoring in strong earnings reports and the declines in share prices of many of the stocks over the last 60 days, many direct selling stocks currently trade at substantial P/E discounts to the overall stock market. HLF stock, for instance, already increased 3 percent in the first three days of September, without any company-specific news.
With this in mind, however, September is historically a difficult month for overall stock market performance. It is also when investors will be grappling with the delicate issues of the timing of the U.S. Fed’s potential tapering of its bond buying program, and the details of any tax increase plan to fund increased federal spending.
Large Cap Stocks
- Betterware de Mexico (NASDAQ: BWMX) fell 0.5 percent in August despite reporting healthy second quarter earnings on August 5. Revenue, EBITDA and net income increased 81 percent, 92 percent and 72 percent, respectively, over the previous year. Shares are up 27.2 percent since the start of the year and a remarkable 349 percent since BWMX began trading in March 2020 after the company’s merger with the SPAC DD3 Acquisition Corp.
- Tupperware Brands Corporation (NYSE: TUP) reversed its downward pattern that has lasted several months, increasing 14.3 percent in August, and cutting its year-to-date losses to 25.3 percent. Since March 1, 2020, TUP shares have gained an astounding 737.5 percent. On August 4, the company reported second quarter results that easily surpassed Wall Street’s expectations. Quarterly net sales and adjusted EBITDA each increased 17 percent compared to the previous year. In late June 2021, TUP’s Board of Directors authorized a $250 million stock repurchase plan, equivalent to 20-25 percent of shares outstanding, reasoning that the company’s Turnaround Plan had successfully improved its liquidity position.
- Nu Skin Enterprises, Inc. (NYSE: NUS) shares declined 5.7 percent in August, leading shares to be down by 7.3 percent in the first eight months of 2021, but up 114.6 percent since March 2020, when tracking began. Second quarter earnings included an increase in revenue by 15 percent over the previous year’s period, and EPS growth of 42 percent. NUS boosted its full-year 2021 EPS guidance to $4.30-$4.50, about a 5 percent increase from the guidance it issued just three months before.
- Herbalife Nutrition, Inc. (NYSE: HLF) gained 0.8 percent in August, boosting the stock’s year-to-date performance to 2.9 percent, and a gain of 58.7 percent since March 2020. Second quarter net sales reached $1.6 billion, up 15 percent from a year ago, and adjusted EBITDA rose even more rapidly, reaching $262 million, 18 percent higher than the second quarter of 2020.
- Medifast, Inc. (NYSE: MED) stock was the victim of significant profit taking in August. The company’s second quarter revenues increased 79 percent from the same period last year, and diluted EPS grew even faster, reaching $3.96 in 2Q 2021, up 113 percent. In turn, MED boosted its full-year 2021 revenue guidance slightly to $1.425-$1.475 billion. However, despite these robust numbers, MED’s shares declined a remarkable 20.2 percent in the month, cutting its gains since March 1, 2020 to 186.7 percent. Based on the $13.44 per share midpoint of MED’s annual earnings guidance, the stock trades at a P/E multiple of about 17.5x, an approximate 20 percent discount to the overall stock market’s valuation, despite its much faster projected revenue growth.
- USANA Health Sciences, Inc. (NYSE: USNA) shares rose 1.8 percent in August, leading to a year-to-date gain of 24.5 percent. Since the March 2020 inception of the DSCI, USANA shares have increased 46.8 percent, beating the Dow’s 35.9% cumulative price increase. USANA reported robust second quarter results, with net sales and diluted earnings per share jumping 30.1 percent and 41.7 percent, respectively, from year ago levels.
- eXp World Holdings, Inc. (NASDAQ: EXPI) shares posted the strongest performance of all DSCI members in August, rising 27.6 percent. So far in 2021, the stock has climbed 49.4 percent, and an astonishing 859.2 percent since March 2020. Second quarter financial results reported 87 percent more agents than in the year-ago period. Equally important, EXPI declared a $0.04 per share quarterly cash dividend to shareholders, its first-ever dividend. Its cash balance increased $44 million in the quarter, even after repurchasing $55 million of stock during this period. The company announced on August 31 that it has expanded into Germany, bringing the total number of countries and territories in which its real estate agents operate to 18. EXPI now employs more than 62,000 agents across the globe.
- Primerica, Inc. (NYSE: PRI) was the fourth-best performer among all stocks in the DSCI in August, rising 4.6 percent, and is now 18.5 percent higher over the first eight months of 2021, and 39.6 percent higher since the March 2020 inception of the DSCI. The company’s second quarter revenue and earnings per diluted share increased 25 percent and 28 percent, respectively. PRI’s ROE is an impressive 26.3 percent.
- The Beachbody Company, Inc. (NYSE: BODY) stock declined 13.9 percent in August. Second quarter revenue increased 2 percent versus over the same period in 2020, and digital revenue rose 20 percent. Adjusted EBITDA was negative $4.4 million in the second quarter versus positive $0.9 million in the second quarter of 2020.
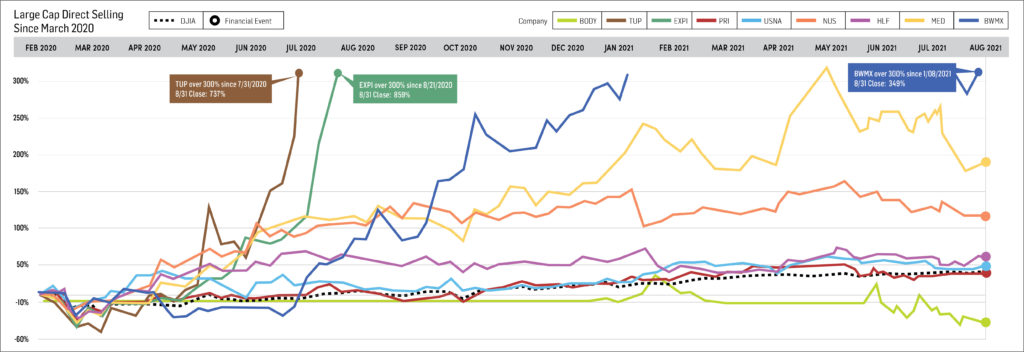
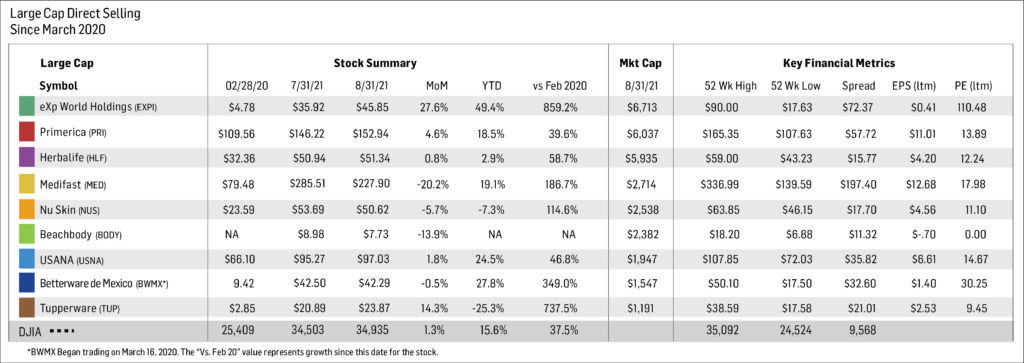
Small Cap Stocks
The small cap stocks tracking set lagged noticeably behind the performance of their large cap peers in August, with seven of the eight stocks falling during the month. Mannatech, Incorporated (NASDAQ: MTEX) was the second-best performer of all DSCI components in August, rising 27.1 percent. The stock has appreciated 81.8 percent over the first eight months of 2021 and reported solid second quarter financial results, including a 12.9 percent increase in revenues over the second quarter of the previous year. Diluted EPS reached $0.99 in the quarter, a 111 percent increase from $0.47 in 2020.
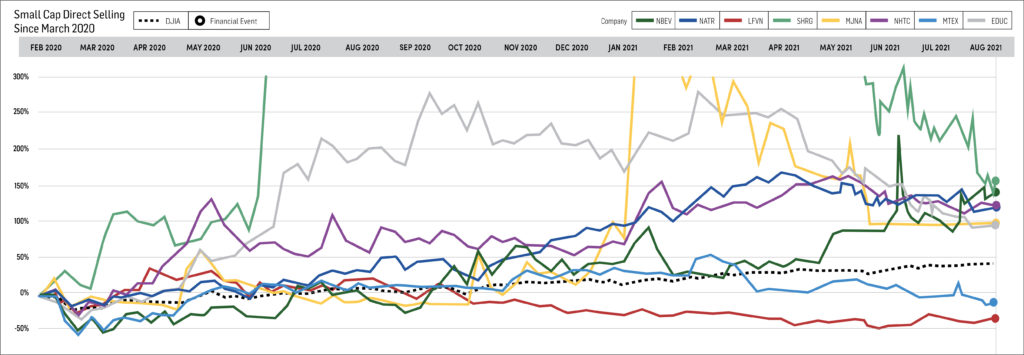
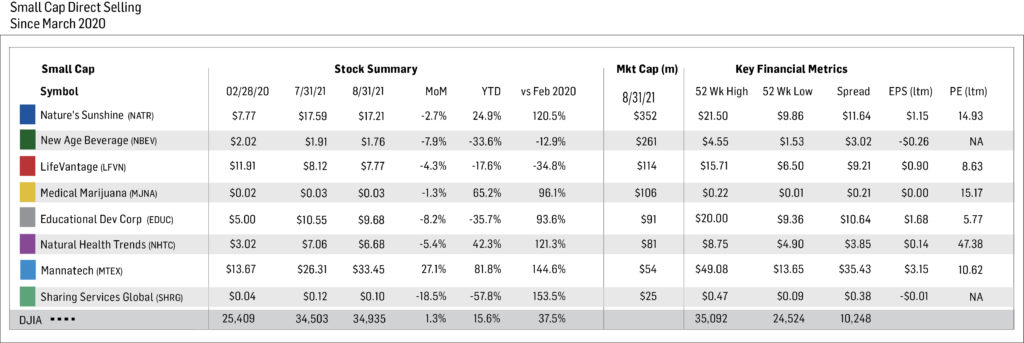
Short Interest and Data Analysis
Short interest in industry stocks continued to move higher through mid-August, and “days to cover” has increased about 150 percent since bottoming in mid-February. The number of sell-side analysts maintaining “buy” and “hold” ratings on industry stocks was around 97%. The percentage of stocks which analysts recommended selling was only 3 percent.
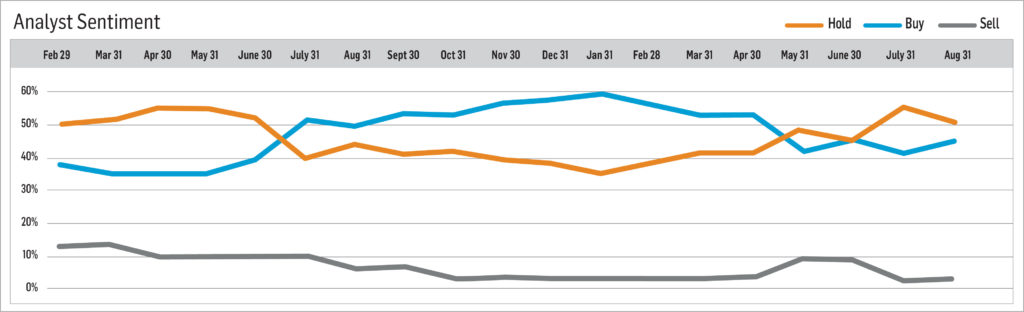
-
July 2021
Brought to you by Direct Selling Capital Advisors
Direct Selling Stocks Index Declines 7.4 Percent After Months of Impressive Gains
The Direct Selling Capital Advisors Direct Selling Index (DSCI) declined 7.4 percent in July 2021, underperforming the Dow Jones Industrial Average (DJIA), which gained 1.3 percent during the month. Declining performance was spread across the index, with six members—The Beachbody Company, Inc. (NYSE: BODY); Betterware de Mexico, S.A.B. de C.V.’s (NASDAQ: BWMX); Tupperware Brands Corporation (NYSE: TUP); NewAge, Inc. (NASDAQ: NBEV); Educational Development Corporation (NASDAQ: EDUC); and Sharing Services Global Corporation (OTC: SHRG)—each declining more than 10 percent in July. LifeVantage Corporation (NASDAQ: LFVN) was the only direct selling stock within the index to post a double figure percentage gain. In total, 12 of the 17 stocks in the DSCI lost value during the month.
Even taking these losses into consideration, the DSCI has gained a cumulative 99.6 percent since the index began tracking stocks on March 1, 2020. The DJIA gained only 35.9 percent during the same period. Year to date, the DSCI has grown 26.3 percent, outpacing the DJIA’s gain of 14.2 percent.
This recent decline corrects some of the outsized gains that occurred during May, which saw an 18.4 percent increase, and June, which saw an additional 2.2 percent growth.
Many of the tracking set’s Large Cap stocks have posted their second quarter results and reported impressive gains. Of the seven large cap companies, the year-over-year revenue growth reached 42.3 percent. EXPI led the group with 183 percent growth and Medifast was also a standout, with a 79 percent increase.
The third and fourth quarters of 2020 set an exceptionally high bar for year-over-year results within this tracking set. The DSCA forecast still anticipates impressive performance for these companies, but investors are adopting a “sell the news” mentality and maintaining a more cautious approach, which has led to the recent decline.
Given these data points, August appears to be a potentially challenging month for performance in spite of impressive financial results.
“Looking at the remainder of the year, the outlook is somewhat murky,” said Stuart Johnson, Direct Selling Capital Advisors CEO. “The resurgence of COVID-19 has made things difficult to predict. While we believe the industry is now well equipped and prepared to handle any resulting business disruptions based on performance over the last 17 months, we don’t know if the impact on consumer behavior will be similar. Regardless, we continue to expect record domestic direct selling revenue in 2021 and our long-term outlook for the industry remains decidedly bullish.”
Large Cap Stocks
- Betterware de Mexico (NASDAQ: BWMX) fell 15 percent in July, reversing a 15.2 percent gain in June. Shares continue to be up by 26.4 percent since the beginning of the year and 351.2 percent since it began trading in March 2020 after merging with SPAC DD3 Acquisitions Corp. BWMX serves three million households through distributors and associates in approximately 800 communities in Mexico. The company’s year-over-year revenue grew 82 percent in the second quarter of this year, with an EPS growth of 61 percent.
- Tupperware Brands Corporation (NYSE: TUP) declined 12 percent in July to bring its year-to-date losses to 34.6 percent. Even so, the decline only slightly offsets the company’s approximately 800 percent gain in 2020. In late June 2021, TUP’s Board of Directors authorized a $250 million stock repurchase plan, equivalent to 20-25 percent of shares outstanding, reasoning that the company’s turnaround plan had successfully improved its liquidity position. TUP also announced a $58 million prepayment of its term loan, continuing the transformation of the Company’s balance sheet.
- Nu Skin Enterprises, Inc. (NYSE: NUS) shares declined 5.2 percent in July. Shares are down a total of 1.6 percent for the year, but up 127.6 percent since March 2020. Revenue increased 15 percent year-over-year and EPS grew 42 percent. As a result, NUS boosted its full-year 2021 EPS guidance to $4.30-$4.50, a 5 percent increase from the guidance it issued just three months before.
- Herbalife Nutrition, Inc. (NYSE: HLF) declined 3.4 percent in July, but overall the shares have gained 57.4 percent since March 2020. Net sales in the second quarter reached $1.6 billion, up 15 percent from a year ago. Adjusted EBITDA also rose significantly, reaching $262 million, 18 percent higher than in the same quarter of the previous year.
- Medifast, Inc. (NYSE: MED) stock was the only large cap direct selling stock to increase in July, rising 0.9 percent. Revenues during the second quarter increased 79 percent from the previous year’s period. Diluted EPS also grew, reaching $3.96, a 113 percent spike from the previous year. MED is now boosting its full-year 2021 revenue guidance to $1.425-$1.475 billion. MED shares have increased 49.2 percent since year-end 2020 and 259 percent since March 2020.
- USANA Health Sciences, Inc. (NYSE: USNA) shares fell 7% in July. The company’s year-to-date gains now stand at 22 percent. Second quarter net sales and diluted earnings per share jumped 30.1 percent and 41.7 percent, respectively, from the same period during 2020. The stock declined about 5 percent following the financial report but DSCA analysts expect the stock to reverse higher. Since March 2020, USANA shares have increased about 44 percent, beating the Dow’s 36 percent cumulative price increase.
- eXp World Holdings, Inc. (NASDAQ: EXPI) declined 7.4 percent in July. However, since March 2020, the shares have risen 651.5 percent. The company’s second quarter revenue increased 183 percent year-over-year to a record $1 billion, and its real estate agent roster expanded 83 percent. EXPI also declared a $0.04 per share quarterly cash dividend to shareholders, its first-ever dividend. Even after repurchasing $55 million of stock in the second quarter, the company’s cash balance increased $44 million. With these announcements, the stock saw a 36 percent increase in price on August 4 and the stock has remained in a general upward trend since that time.
- Primerica, Inc. (NYSE: PRI) was the third-best performer among the large cap stocks in the DSCI in July, declining by 4.5 percent. and standing 33 percent higher than its March 2020 levels. The company’s second quarter financial results surpassed analyst expectations with year-over-year revenue of 24.3 percent and EPS growth of 32.4 percent.
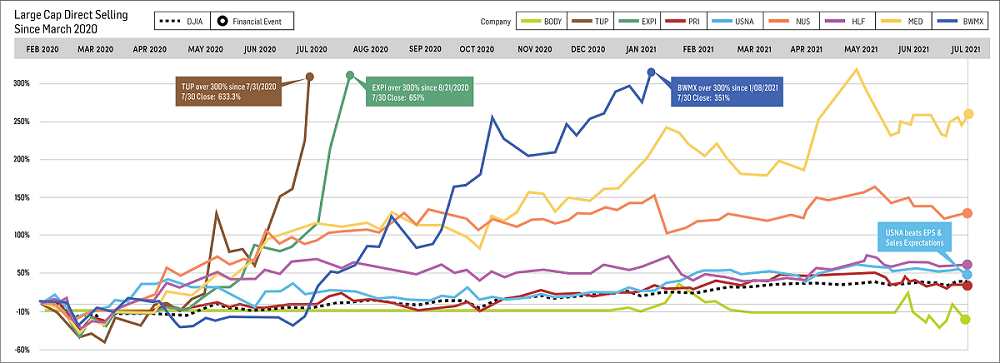
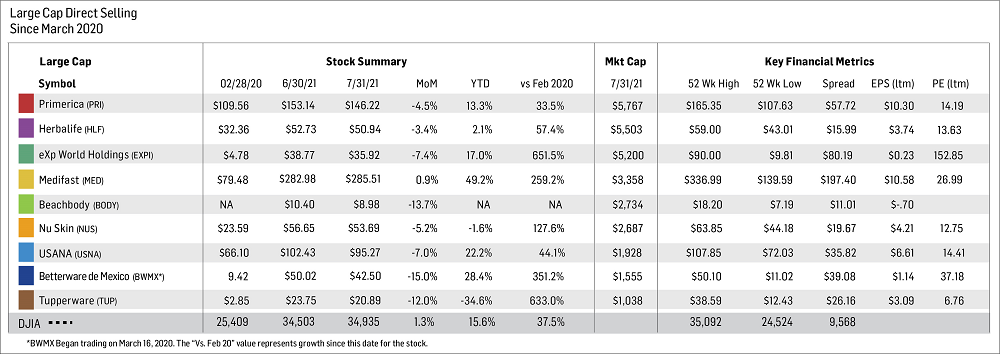
Small Cap Stocks
- LifeVantage Corporation (NASDAQ: LFVN) was by far the best performing small cap in July, with a 10.5 percent growth rate. The stock is now down an aggregate 13.9 percent over the first seven months of 2021.
- Educational Development Corporation (NASDAQ: EDUC) fell 15 percent during July in spite of solid second quarter earnings. This decline brought the stock’s year-to-date loss to 29.9 percent. Net revenues increased $2.5 million, or 6.5 percent, in the quarter, and nearly all of these incremental revenues fell to the bottom line, as pretax earnings rose $1.9 million, or just over 80 percent.
- NewAge, Inc. (NASDAQ: NBEV) has a year-to-date decline of nearly 28 percent and has continued a downward trend with a loss of 14.3 percent in July. The company’s second quarter results included record revenue, however, of $124 million and improved operating results. Since the release of these earnings, NBEV traded generally higher, before pulling back some over the last several sessions.
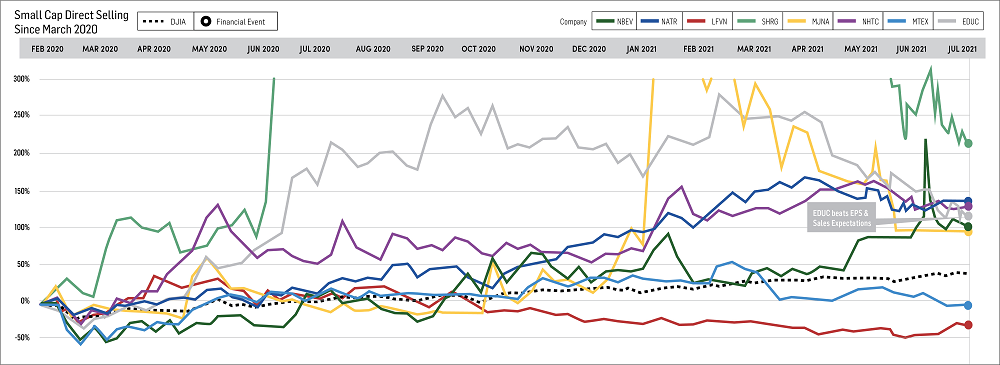
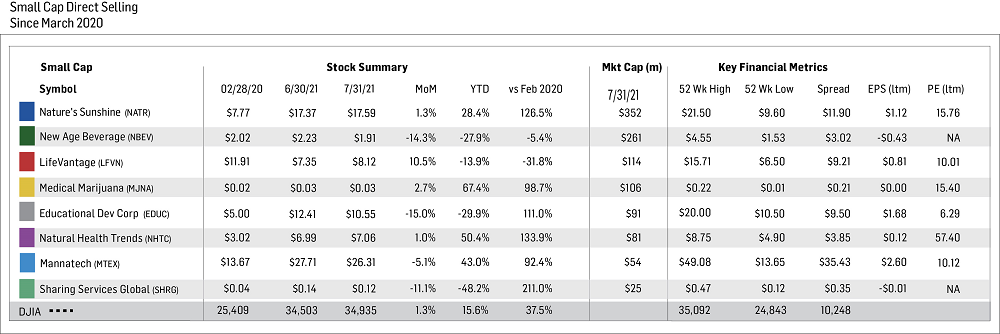
Short Data & Analysis
Short interest in industry stocks continued to increase through mid-July. Days to cover have increased 150 percent after bottoming in February and now stands at its highest level since May of 2020. A larger number of investors have begun betting against direct selling stocks, but any more movement toward an increase in short interest could result in a bullish short squeeze.
The number of sell-side analysts maintaining buy and hold ratings on industry stocks jumped to around 97 percent, from a dip to 90 percent in June. The number of hold recommendations increased as related to the number of buy recommendations. The percentage of stocks that analysts recommend selling fell to 3 percent, versus about 10 percent in June.
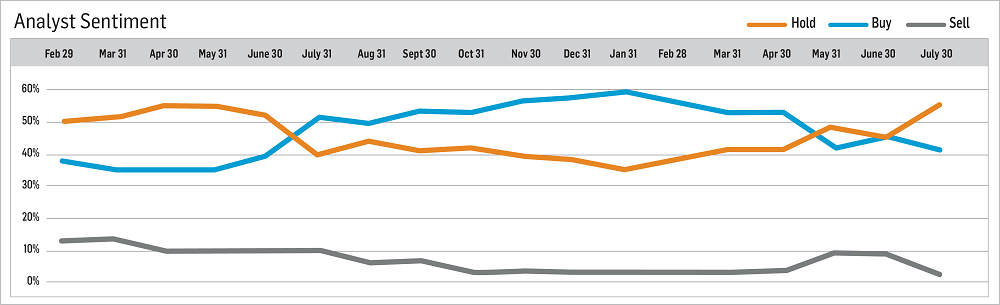
-
June 2021
Brought to you by Direct Selling Capital Advisors
Direct Selling Stocks Continue to Outperform Broader Markets
May brought an incredible rush of growth for direct selling stocks (+18.4 percent), and the Direct Selling Capital Advisors Direct Selling Index (DSCI) added 2.2 percent more in June. This increase is slightly above the Dow Jones Industrial Average (DJIA), which grew by 1.9 percent.
eXp World Holdings, Inc. (NASDAQ: EXPI) carried much of this positive momentum, with a 20.2 percent gain. Twelve of the 16 individual stocks in the index did decline, which was expected given May’s blistering performance. The DSCI continues to set record highs, up 115.6 percent since the tracking period began on March 1, 2020. The DJIA gained 35.9 percent during this same time period, showing the DSCI to significantly outperform the broader market. On a year-to-date basis, DSCI gained 36.4 percent, compared to 14.2 percent for the DJIA.
After moderate profit-taking by most direct selling stocks last month, muted stock price movements are now expected for July. Second quarter earnings reports will be the next key event to consider, and most will likely be released in early August.
“First-quarter year-over-year earnings comparisons for direct selling stocks were fairly easy, as first quarter 2021 reflected a boost from pandemic trends while those factors played no role in the first quarter of 2020 results,” said Stuart Johnson, Direct Selling Capital Advisors CEO. “However, those trends were largely reflected in consumer behavior by the second quarter of 2020. Consequently, second quarter of 2021 earnings comparisons should prove more challenging than in Q1 2021, but we still expect the companies comprising our large cap tracking set, as a whole, to report strong second quarter revenue and earnings results.”
Large Cap Stocks
Three of the eight members of the large cap direct selling stocks tracking set advanced in June, while the others declined, reflecting the uneven nature of the index. All eight companies, however, have outpaced the DJIA since March 2020.
A notable event within this group was the merger of the Beachbody Company Group, LLC with Forest Road Acquisition Corp. (NYSE: FRX), a special purpose acquisition company (SPAC) that also includes Myx Fitness Holdings, LLC. This new combined company will operate under the name The Beach Body Company, Inc. and will trade on the NYSE under the symbol BODY. The company’s stock closed at $12 per share on June 25 with an implied market capitalization of around $3.65 billion. Beachbody’s first quarter financial summary also included summary results for Myx, and on a consolidated basis, the company reported revenue of $243.3 million for the quarter—a 43 percent increase year-over-year. Total 2021 revenue for BODY is expected to exceed $1 billion. Beginning next month, BODY will join the DSCI large cap tracking set.
- Betterware de Mexico (NASDAQ: BWMX)gained 15.2 percent in June and stands 51.1 percent higher since the beginning of the year, and 431 percent higher than when it began trading in March 2020. The company’s sharp rally in June was likely a reflection of long-term investors factoring in strong first quarter earnings results. Betterware de Mexico serves 3 million households in approximately 800 communities in Mexico.
- Tupperware Brands Corporation (NYSE: TUP)continued its decline (-7.4 percent) during the month after astounding 2020 gains of approximately 800 percent. Year-to-date, TUP’s losses average 25 percent. Shares rebounded slightly, ending June about 17 percent higher than its June 21 lows after the Board of Directors authorized a $250 million stock repurchase plan and a $58 million prepayment of its term loan.
- Nu Skin Enterprises, Inc. (NYSE: NUS) fell 5.8 percent after a 14.5 percent gain in May. Its May strengthening was likely due to a strong first quarter earnings report, which included a 31 percent year-over-year revenue increase. Since March 2020, NUS has still dramatically outpaced the Dow, gaining 140.1 percent, compared with a 35.9 percent gain for the broader market.
- Herbalife Nutrition, Inc. (NYSE: HLF) gained 0.3 percent in June and held onto its May gains of approximately 15 percent. HLF shares are up 62.9 percent since March 2020.
- Medifast, Inc. (NYSE: MED)shares declined 14.8 percent in June, surrendering almost a third of its 46 percent gain in May. MED’s shares reacted positively to first quarter earnings, which reported revenue increases of 91 percent year-over-year. The company is projecting a 54 percent increase for 2021 revenue. Shares have increased 256 percent since March 2020.
- USANA Health Sciences, Inc. (NYSE: USNA)fell 3.1 percent in June following a 17.5 percent gain in May. Through mid-year 2021, USNA has more than doubled the performance of the DJIA in 2021, rising 31.4 percent versus 14.2 percent for the stock market index.
- eXp World Holdings (NASDAQ: EXPI)led the large cap tracking set, rising 20.2 percent in June. Since March 2020, EXPI shares have risen more than 700 percent. In its first quarter earnings report, the company’s revenue increased 115 percent year-over-year, with agent numbers expanding 77 percent.
- Primerica, Inc. (NYSE: PRI)declined 5.6 percent in June, but hit 52-week highs of around $165 in early June before correcting at the end of the month. PRI is trading well above its late October 52-week low of about $107.
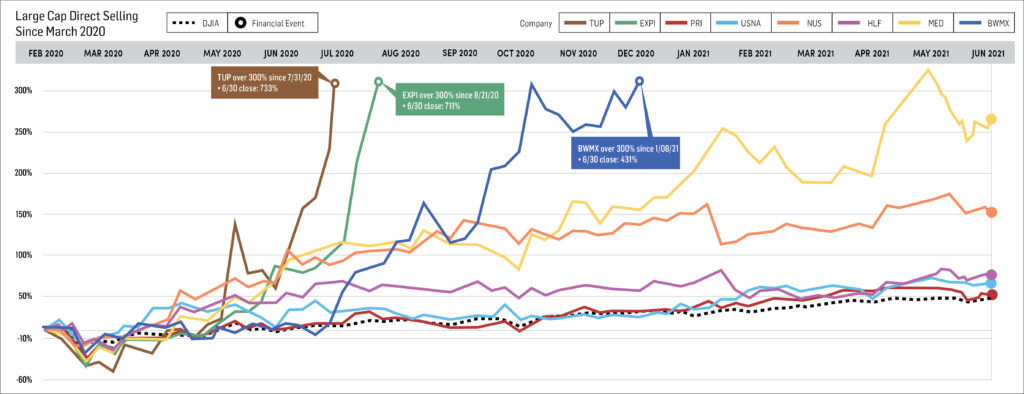
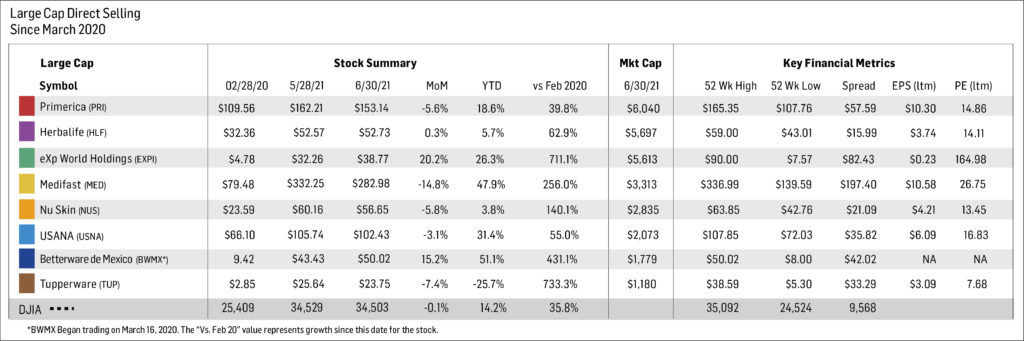
Small Cap Stocks
With the exception of Mannatech Incorporated (NASDAQ: MTEX), which rose 10.9 percent in the month, seven of the eight small cap stocks in the DSCA tracking group declined.
Mannatech announced a tender offer to purchase just over 10 percent of its total outstanding shares at a price of $26, representing a premium of nearly 28 percent to the stock’s closing price in the previous session. On June 30, the company announced that only 8.31 percent of the total shares outstanding were tendered, illustrating that the majority of shareholders believed $26 was too low a price to surrender their shares. This move is an encouraging sign for MTEX, given that non-insiders hold about half of the company’s shares.
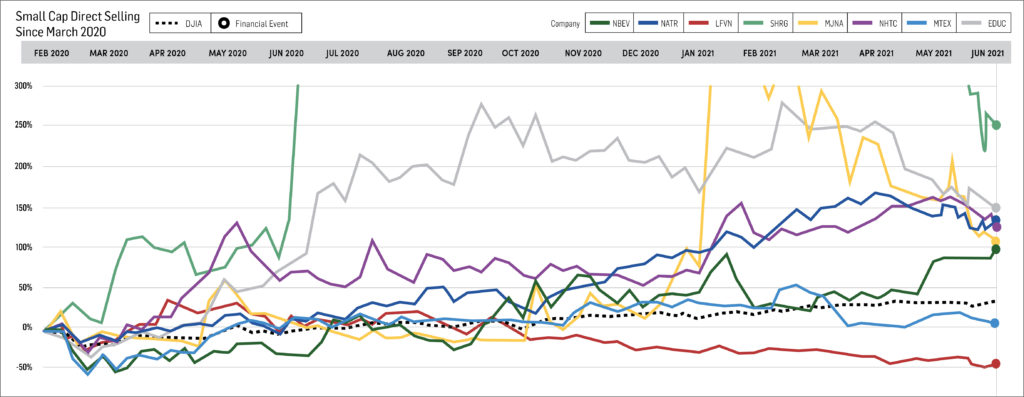
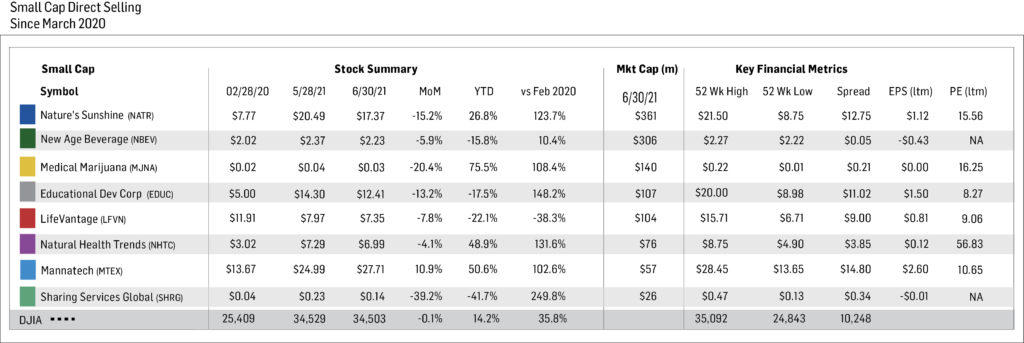
Short Interest and Data Analysis
Short interest in industry stocks moved noticeably higher from mid-May to mid-June, which is not unexpected given the elevated trading levels of so many of the DSCA stock tracking groups. HLF, USNA, NUS and TUP experienced the largest increases in “days to cover” during this period.
Analysts maintaining “buy” and “hold” ratings on industry stocks remained flat at approximately 90 percent, while those maintaining “sell” ratings held at just under 10 percent.
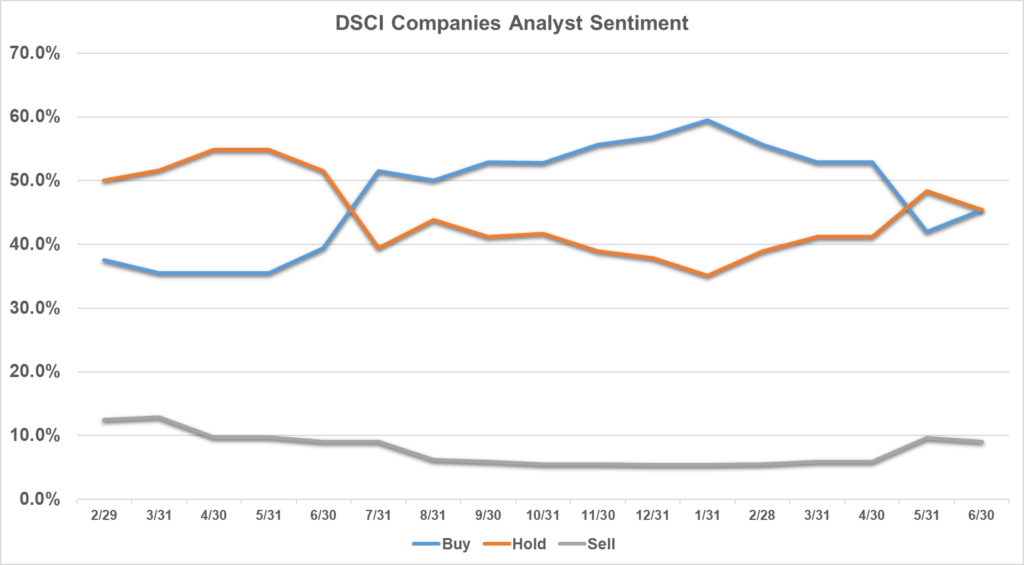
-
May 2021
Brought to you by Direct Selling Capital Advisors
Direct Selling Stocks Significantly Outperform the Market in May
May saw a surge in direct selling stocks, driven by a strong first quarter, which included aggregate growth revenue of more than 63 percent among the Direct Selling Capital Advisors (DSCA) large cap tracking set. The Direct Selling Capital Advisors Direct Selling Index (DSCI) rose 18.4 percent during the month, as compared to a gain of 1.9 percent for the Dow Jones Industrial Average (DJIA).
These gains have led the DSCI to sit at a record high, up 111 percent since the tracking period began on March 1, 2020. This is compared to a gain of 35.9 percent for the DJIA during the same period. Year-to-date, the DSCI is also outperforming the broader markets with gains of 33.5 percent, while the DJIA gains 14.2 percent.
“May represented one of the strongest monthly performance periods for direct selling stocks since the inception of our tracking set in March 2020,” said Stuart Johnson, Direct Selling Capital Advisors CEO. “Particularly impressive was the manner in which it occurred, which was primarily without the support of the broader markets. The relative strength is not necessarily surprising; however, the dramatic spread is certainly impressive.”
Large Cap Stocks
Each of the eight large cap stocks within the tracking set outperformed the broader markets since tracking began. Only two companies declined, but both have experienced noteworthy runs during the year.
- Medifast, Inc. (NYSE: MED) rose 46.3 percent, driven by the company’s first quarter financial results announcement, which included revenue growth of 91 percent, year-over-year. At the end of May, MED stands up 318 percent since tracking began and includes gains of 73.6 percent in 2021 year-to-date, making it the clear leader in the group.
- USANA Health Sciences, Inc. (NYSE: USNA) rose 17.5 percent and now stands 60% above its February 2020 levels. With 2021 gains of 35.7 percent, it is the second leading company in the large cap tracking set.
- Herbalife Nutrition, Inc. (NYSE: HLF) moved aggressively higher after impressive first quarter results and increased 14.9 percent throughout May. HLF is now 62.5 percent above its initial tracking date levels, but continues to lag somewhat with gains of only 5.4 percent for the year.
- Nu Skin Enterprises, Inc. (NYSE: NUS) rose 14.5 percent and now stands 155 percent above the initial tracking date. Year-over-year revenue growth of 31 percent announced in its first quarter results created a continued upward trend and a near-record 52-week high before selling off slightly in early June.
- Betterware de Mexico (NASDAQ: BWMX) declined 7 percent and now stands 31.2 percent higher since the beginning of the year and 361 percent higher than March 2020. The company’s first quarter financial results included net sales growth of 205 percent year-over-year, leading the stock to trade off slightly and it has since been trading in a sideways to slightly down consolidating pattern since then.
- Tupperware Brands Corporation (NYSE: TUP) rose 5.2 percent and is now 800 percent up since the end of February 2020. TUP has become a remarkable turnaround story and became a top performer in 2020, but has lagged behind in 2021, standing down nearly 20 percent year-to-date as of the end of May. The stock is trading in a general downward trend, possibly an indication of profit taking after the stock’s impressive run last year.
- eXp World Holdings (NASDAQ: EXPI) lost approximately 6 percent during the period, but despite declines over the last several months, the stock remains up 5.1 percent year-to-date and 574.9 percent since the initial tracking period began.
- Primerica, Inc. (NYSE: PRI) rose 1.8 percent during May, and now stands 48.1 percent higher than its initial levels, and 25.7 percent up year-to-date. On May 5, the stock set a new 52-week high following strong first quarter financial results, which included 21 percent year-over-year revenue growth, and set a new 52-week high again in early June.
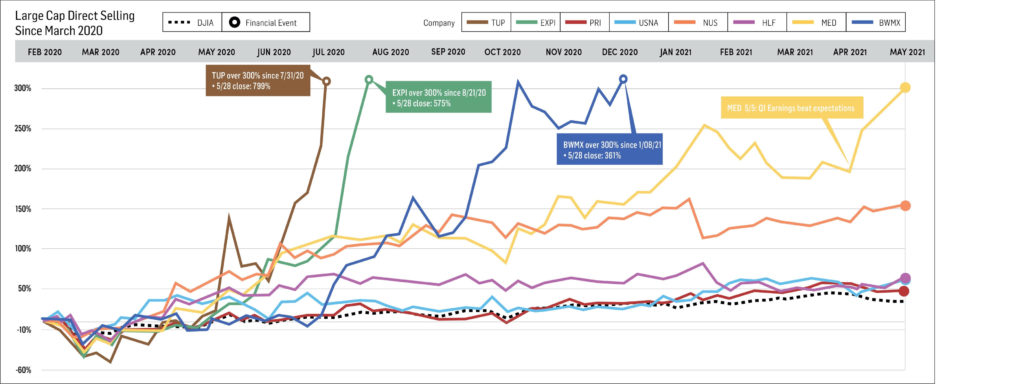

Small Cap Stocks
Mannatech Incorporated (NASDAQ: MTEX) gained 29.2 percent in May, and then began a process that seems to clearly indicate they are in the process of preparing for a “go-private” transaction. After several years of repurchasing shares, the company announced a tender offer to purchase up to 211,538 of its shares at a price of $26, representing a premium of nearly 28 percent to the stock’s closing price in the previous session. This tender off represents more than 10 percent of shares outstanding, and insiders currently hold more than 48 percent of the stock, which will likely exceed 50 percent of the total following the completion of the offer.
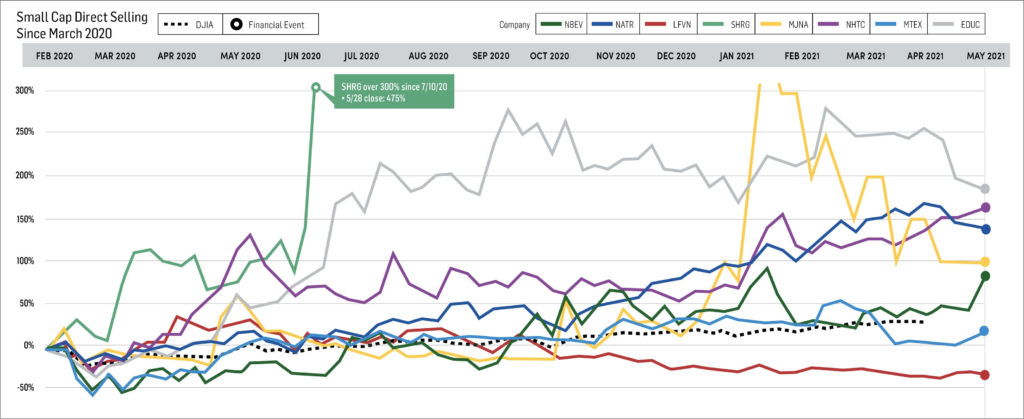
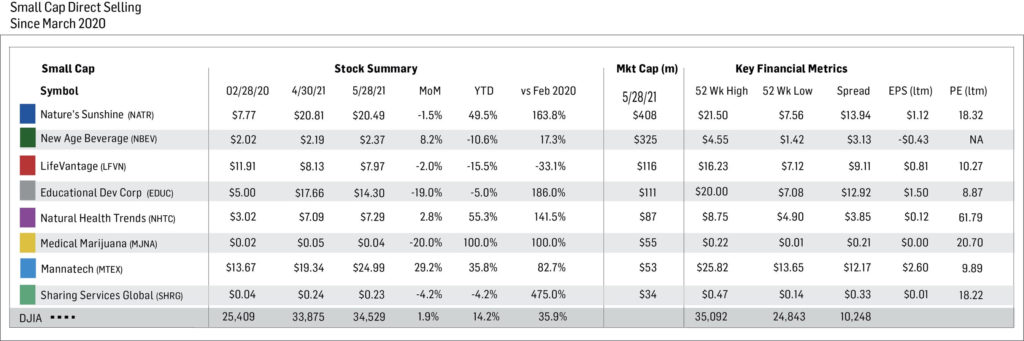
Short Interest and Data Analysis
During the month of May, the number of sell-side analysts maintaining “buy” and “hold” ratings on industry stocks remained flat at approximately 97 percent. Analysts recommending “sell” ratings remained miniscule.
“Second quarter of 2021 results are where things will get interesting,” Johnson said. “While first quarter results were very impressive, the year-over-year comparable period did not include the pandemic period trends that helped to launch the current growth cycle the industry is experiencing. However, by the second quarter of 2020 these trends had begun to take root and positively impact results in many cases. As such, the upcoming second quarter results will have a much higher hurdle to jump for many companies to continue to show significant YoY growth.”
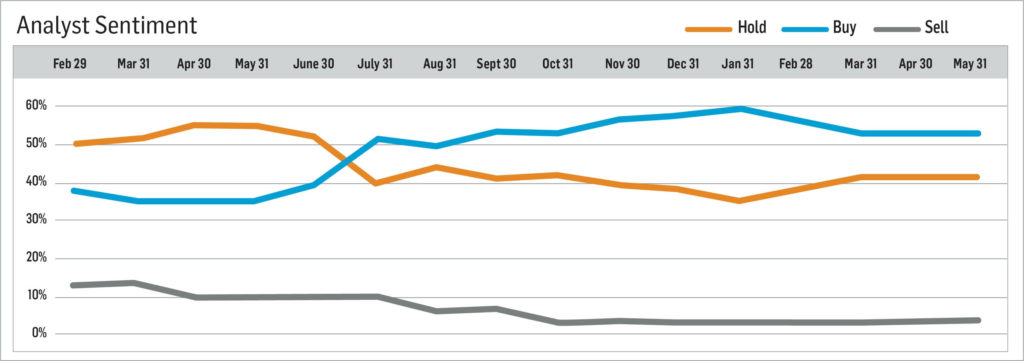
-
April 2021
Brought to you by Direct Selling Capital Advisors
Rise in Direct Selling Stocks Projects Another Record Year
March was a tumultuous month for direct selling stocks, but April proved to move the group marginally higher, with the Direct Selling Capital Advisors Direct Selling Index (DSCI) rising 3.1 percent during the month, compared to a slightly lower gain for the Dow Jones Industrial Average (DJIA) of 2.7 percent. This rise in April places the DSCI in line with the broader markets.
Since the tracking period began March 1, 2020, the DSCI remains up 79.1 percent, compared to a DJIA gain of 33.3 percent. Considering a year-to-date basis, the DSCI retains a slight lead over the DJIA, with gains of 11.4 percent, compared to 10.4 percent.
Large Cap Stocks
Most of the large cap stocks within the DSCI tracking set reported strong revenue, exceeding even optimistic estimates, with the average year-over-year revenue growth in this group reaching 63.3 percent. The company trailing the group with the least growth still grew more than 15 percent. Collectively, the companies’ revenue grew by $2.76 billion in the first quarter.
Much of this growth is being driven by the domestic market. Medifast, Inc. (NYSE: MED), a primarily domestic company, grew revenue 91 percent year-over-year, and the North American segment of Nu Skin Enterprises, Inc. (NYSE: NUS) grew 97 percent year-over-year.
First quarter data for this grouping showed that 80 percent of the 50 companies within the tracking set reported year-over-year revenue growth for the first quarter of 2021.
- Betterware de Mexico (NASDAQ: BWMX) went public last year in a merger with a special purpose acquisition company (SPAC) and has since been a new standout to the large cap tracking set. The Mexican direct seller has a current market capitalization of approximately $1.7 billion and rose nearly 22 percent over the course of the month, climbing nearly 40 percent year-to-date. As of the end of April, the stock had increased more than 450 percent since the merger was finalized with the SPAC in March 2020.
- Tupperware Brands Corporation (NYSE: TUP) fell 7.7 percent in April, but remains one of the top leaders within the tracking set, with gains of 755.1 percent since February 28 of last year. The company’s turnaround plan has made significant progress in the last year, including a return to significant growth and a tidier balance sheet. First quarter financial results for the company included 22 percent revenue growth and a net income of $45.3 million.
- Nu Skin Enterprises, Inc. (NYSE: NUS) was mostly flat in April but remains approximately 123 percent above its levels in February of last year. The stock traded in a sideways consolidating pattern for most of the month. The company’s Q1 results included 31 percent revenue growth and has since traded aggressively higher.
- Herbalife Nutrition, Inc. (NYSE: HLF) has followed the trading pattern of NUS almost exactly—trading down significantly for several months and now moving aggressively higher following impressive first quarter reports. HLF increased 3.2 percent in April and stands 41.4 percent above its levels in February of 2020. Its first quarter report included 19 percent year-over-year revenue growth and strong performance within its North American market which increased sales by 30 percent year-over-year.
- Medifast, Inc. (NYSE: MED) gained 7.2 percent in April and now stands 185.7 percent above its February 28, 2020 levels. The stock spent most of the month trading in a calm but upward pattern, then surged higher following reports of a 91 percent year-over-year revenue growth in the first quarter.
- USANA Health Sciences, Inc. (NYSE: USNA) has been a strong performer over the last several months, reaching several 52-week highs in early 2021. While it spent much of April in a tight consolidating pattern with an upward bias, the company reported 15.5 percent revenue growth year-over-year in the first quarter, and surprisingly traded aggressively lower. It has since recouped much of those losses and has climbed back above its 50-day moving average.
- eXp World Holdings (NASDAQ: EXPI) declined 24.6 percent during April. The company has had a remarkable growth story this year and remains up 8.9 percent year-to-date and 618.8 percent since March 2020. In spite of reporting record revenue and growth numbers for the first quarter, it fell short of analyst expectations and declined as a result. Year-over-year revenue growth for the company stands at 115 percent.
- Primerica, Inc. (NYSE: PRI) increased 8.1 percent in April and now stands 45.4 percent higher since March 2020 and 19.7 percent higher year-to-date. The company reported 21 percent revenue growth year-over-year and has since trended steadily upward.
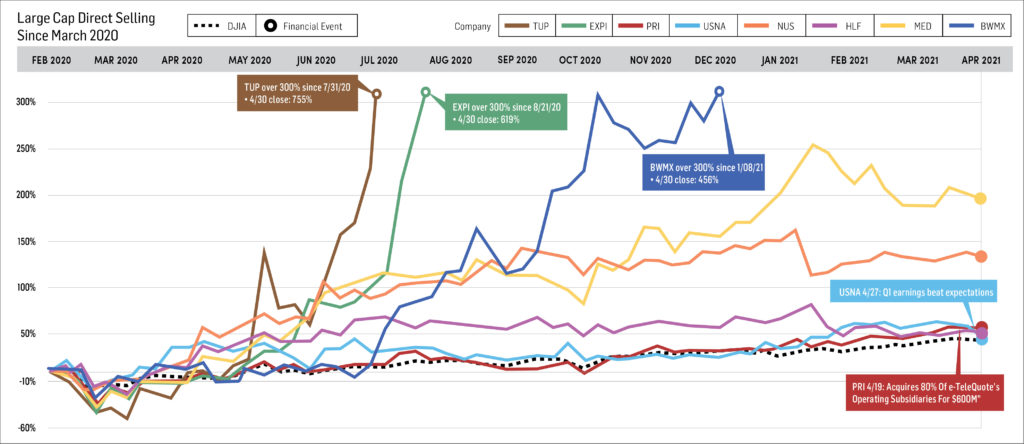
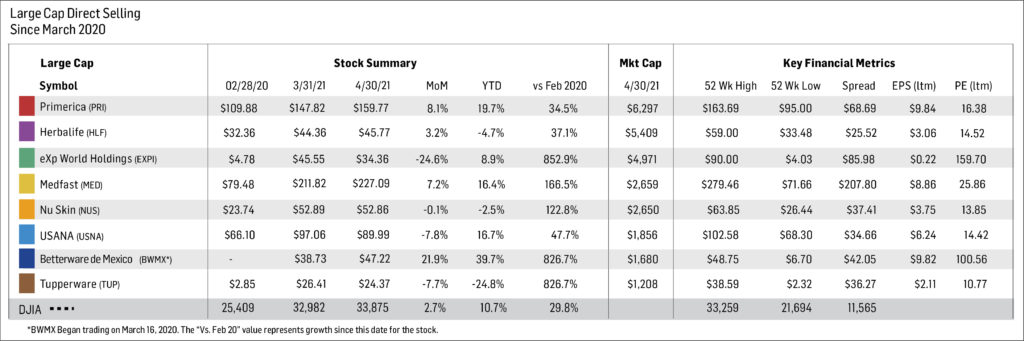
Small Cap Stocks
Nature’s Sunshine Products, Inc. (NASDAQ: NATR) is the largest group within the tracking set with a market capitalization of $412 million. It continued its general upward trend and continually sets new 52-week highs on a regular basis. The stock moved 4.3 percent higher and now stands 168 percent above its March 2020 levels and 47 percent higher on a year-to-date basis. The company reported $102.6 million in first quarter revenue and has since trended in a sideways pattern.
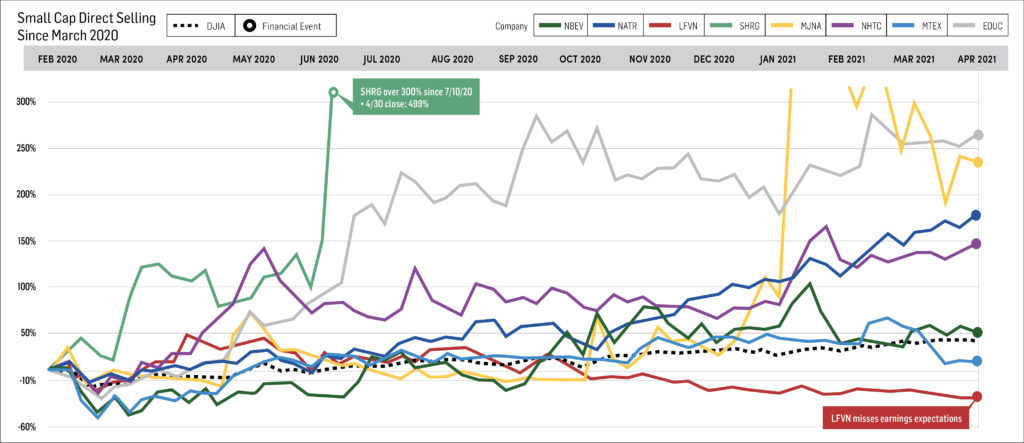

Short Interest Data & Analysis
Short interest in industry stocks trended generally lower over the course of April but remain in the same range of 3.5 days to cover. The number of sell-side analysts maintaining “buy” and “hold” ratings on industry stocks remained flat at approximately 97 percent, but the number of analysts recommending “hold” as opposed to “buy” increased slightly. Analysts maintaining “sell” was miniscule.
“To say that direct selling companies reported strong first quarter financial results would be a clear understatement,” said Stuart Johnson, Direct Selling Capital Advisors CEO. “While we had been expecting an impressive performance, they, for the most part, hit it out of the proverbial park with average revenue growth of 63.3 percent amongst our large cap tracking set. While we continue to believe that the rate of year-over-year growth will likely begin to slow in the second quarter of the year, we are now more than comfortable in projecting that 2021 will result in another record year for domestic direct selling revenue.
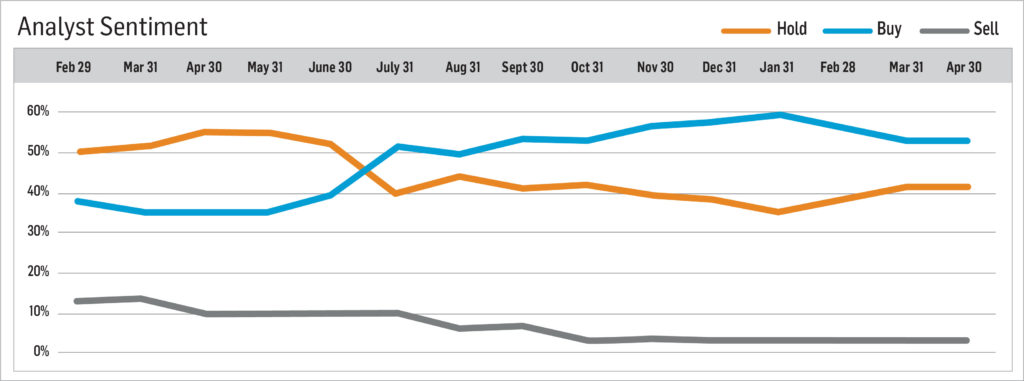
-
March 2021
Brought to you by Direct Selling Capital Advisors
Direct Selling Stocks Experience Tough March After Months of Record-Breaking Performance
For the first time since October 2020, direct selling stocks endured a difficult month in March. Each large cap stock within the tracking set either declined or underperformed and the Direct Selling Capital Advisors Selling Index (DSCI) fell 5.7 percent during the month, while the Dow Jones Industrial Average (DJIA) gained 6.6 percent. This is the first decline for the DSCI since October of last year and the first time since February 2020, when the DSCI began tracking this data. In spite of this new negative trend, the DSCI remains up 77.8 percent since February 2020, a massive lead on the DJIA, which gained only 29.8 percent. On a year-to-date basis, the index remains up 9.9 percent, compared to 7.8 percent for the DJIA.
This new weakness in the tracking sets in the month of March is likely due to altitude fatigue and profit taking, and can be primarily attributed to three leading performers during the pandemic: eXp World Holdings (NASDAQ: EXPI), Medifast, Inc. (NYSE: MED) and Tupperware Brands Corporation (NYSE: TUP). All three stocks saw significant declines during March, but remain among the top three performers in the tracking set since the DSCA began tracking.
Fourth quarter and year-end financial results were strong within the large cap tracking set. In Q4, the smallest year-over-year revenue growth among the seven companies within this set was 12.6 percent, and the smallest EPS growth was 15.2 percent. These seven companies grew, on average, 38 percent and earnings per share by 41.5 percent. It’s important to note that this EPS average excludes TUP and EXPI, which had negative or exceptionally low EPS during Q4 2019 and would artificially skew the calculation higher.
In 2020, six of the seven companies grew 6 percent in revenue year-over-year, with average revenue growth of 21 percent and average EPS growth of 25 percent, taking the same exclusions into consideration as Q4.
Large Cap Stocks
- Tupperware Brands Corporation (NYSE: TUP) fell 13.6 percent during the month, but remains one of the leaders with gains of 827 percent since February 28, 2020. TUP reported strong fourth quarter results, including revenue up 17.4 percent. Year-over-year comparisons, however, were behind analysts’ expectations, leading to a selloff of stock. Tupperware has stabilized its profitability and growth, setting the stage for additional growth in 2021, but having risen approximately 1,000 percent over the last year, the stock was due for a bit of pull back. In March, several of the companies’ executives purchased approximately $1.2 million in stock—a bullish sign.
- Nu Skin Enterprises, Inc. (NYSE: NUS) increased 3.3 percent over the month and now stands 123 percent above its levels when DSCA began tracking. Despite 28 percent year-over-year revenue growth, analysts and investors were expecting higher numbers, and so the company is working to slowly recoup losses experienced during February when Q4 financial results were announced. Like TUP, this pullback is to be expected after a year of significant gains.
- Herbalife Nutrition, Inc. (NYSE: HLF) traded significantly down in late February following the company’s earnings announcement. While the company has strong fourth quarter year-over-year revenue growth (15.6 percent), the stock traded lower due to missed analyst expectations at both the top and bottom line. The stock was virtually flat (-1.6 percent) in March, and has continued to trade in a sideways, consolidating pattern.
- Medifast, Inc. (NYSE: MED) has been a standout in the large cap tracking set, but declined 15.7 percent over the course of the month. It is still 166.5 percent higher than it was when DSCA tracking began. The company’s Q4 financial results beat estimates and included revenue that was up 55.3 percent year-over-year. Since then, the stock has traded sideways in a consolidating pattern and remains up 8.6 percent year-to-date.
- USANA Health Sciences, Inc. (NYSE: USNA) traded higher following its Q4 and full year 2020 financial results on February 9. The stock continued to trade higher and ultimately reached a 52-week high of $102.58 on March 4. It has traded in a bullish, sideways, consolidating pattern since then with its daily trading range tightening significantly. USNA is consistently trading in the upper 90s, well within striking distance of a new 52-week high.
- eXp World Holdings (NASDAQ: EXPI) reported preliminary fourth quarter results on March 2, including both record revenue (+122 percent year-over-year) and profitability, but the stock sank over the next several sessions. Over the course of March, the stock fell 24.6 percent but remains up 852.9 percent since DSCA began tracking 13 months ago. Year-to-date, EXPI remains up 44.3 percent and is the leading 2021 performer among larger stocks.
- Primerica, Inc. (NYSE: PRI) rose 4.7 percent in March and its year-to-date stock is up 10.7 percent. Since fall of last year, the stock has traded in a predictable, upward pattern. On April 2, the company announced it had achieved a single month Investment & Savings Products (ISP) sales record of more than $1 billion in March.
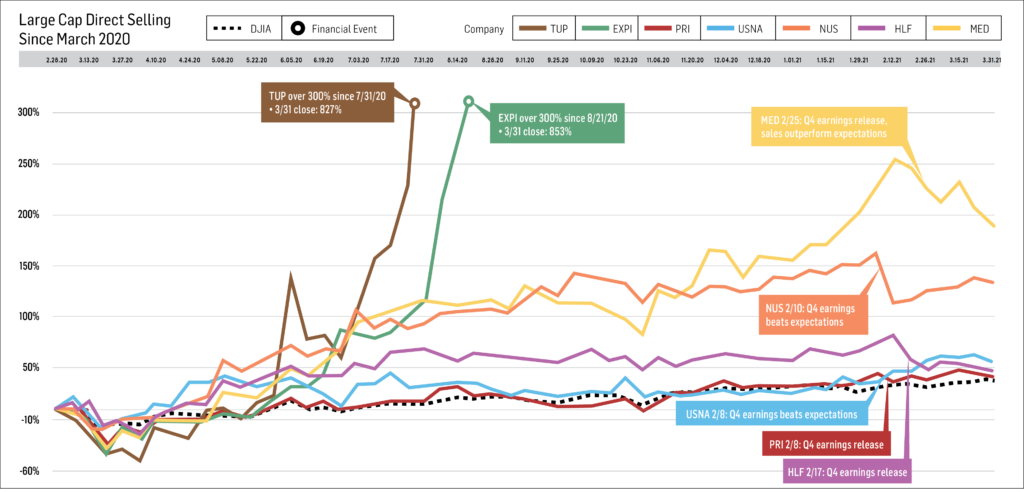
Small Cap Stocks
Nature’s Sunshine Products, Inc. (NASDAQ: NATR) stood out in March, rising 27.9 percent over the course of the month and is now 157 percent above its February 2020 closing price. The company reported financial results, which included a quarterly net sales increase of 11 percent year-over-year to a record $101.7 million on March 10, resulting in the stock moving aggressively higher on stock trade. The company also announced a special dividend of $1 per share and a $15 million share repurchase authorization. NATR reported $92 million in cash on hand at the end of the year. The dividend and repurchases will cost the company an expected $36 million.
All small cap stocks within the DSCA tracking set outperformed throughout March, and have year-to-date as well, with all providing positive returns for 2021 and all but two doing so in March.
Short Interest Data and Analyst Sentiment
Short interest in industry stocks began increasing toward the end of February. Industry wide days to cover fell to 2.4, the lowest level since a 1.5 was recorded in August of 2020. USNA fell to 6.9 days to cover, its lowest level since July of 2020, and PRI fell to 1.5 days to cover, its lowest level since DSCA began tracking this data in March of 2020. EXPI also saw short interest drop to 0.7 days to cover, its lowest levels since DSCA began tracking data.
The number of sell-side analysts maintaining “buy” and “hold” ratings on industry stocks remained flat, at approximately 97 percent. However, the number of analysts recommending “hold” as opposed to “buy” increased slightly. Analysts advising “sell” remained miniscule.
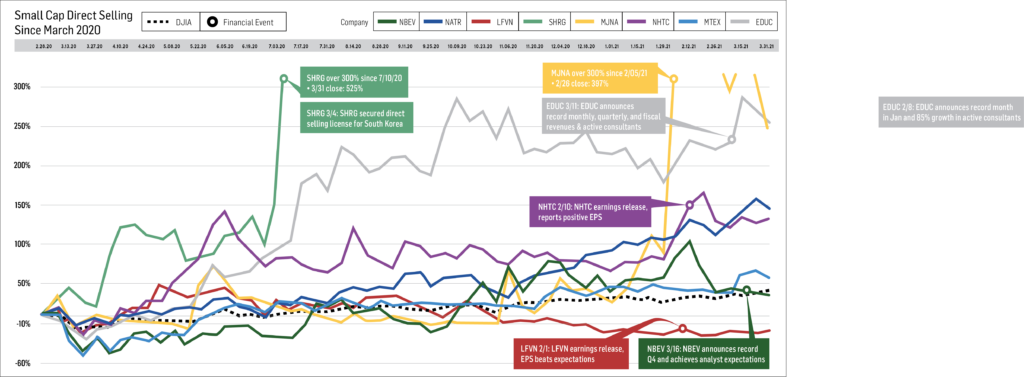
Looking Ahead
The first quarter of 2020 had not yet seen the impact that COVID-19 would have on the industry, and year-over-year comparisons will reflect the strong positive trends we have been seeing within the tracking set. As the industry enters the second quarter, the year-over-year comparison will become more difficult, since this is when many companies within the tracking set began to experience improved numbers.
“While we expect to see continued growth, we also expect the rates of growth to slow somewhat as we move forward throughout the year,” said Stuart Johnson, CEO of Direct Selling Capital Advisors.
-
February 2021
Brought to you by Direct Selling Capital Advisors
Small Cap Direct Selling Stocks Outperform the Dow Jones Industrial Average
The past year has delivered unforeseen and unprecedented growth for direct selling stocks. With the majority of large cap stocks reporting their full-year financial results this month, there was significant volatility within the direct selling stocks segment.
In spite of this instability, large cap stocks posted gains for the month of February. The Direct Selling Capital Advisors Index (formerly Transformation Capital Direct Selling Index (TDSI)) rose 3.1% during the month, compared to a 3.2% gain for the Dow Jones Industrial Average (DJIA). The TDSI now stands 88.6% above February 28, 2020 levels. Within the same period, the DJIA gained approximately 21.7%.
Small Cap Stocks:
Every stock within the small cap tracking set (with the exception of LFVN) posted gains and outperformed the DJIA during the pandemic period. The most notable small cap stock within the tracking set was Medical Marijuana, Inc. (OTC: MJNA), which posted gains of 178% after a strong January. The company also benefited from its ability to generate interest from investors in the midst of positive regulatory trends around cannabis. Also noteworthy among small cap stocks was Natural Healthtrends Corp. (NASDAQ: NHTC), which set a 52-week high early in February before settling into a consolidating pattern for the rest of the month.
“We can say, with certainty, that no one could have predicted the remarkable run direct selling stocks have had over the last twelve months,” said Stuart Johnson, CEO of Transformation Capital. “We can also say that no one could have predicted that the domestic US market would lead the way to significant revenue growth over the course of 2020.”

Large Cap Stocks:
- Tupperware Brands Corporation (NYSE: TUP) increased slightly (1.6%) in February after setting a new 52-week high in January ($38.59). The stock has traded in a slightly downward consolidating pattern since then. The company’s full year financial results significantly missed analysts’ earning expectations which resulted in an approximately 20% decline in stock value. In spite of this, the stock is still up dramatically the last 12 months.
- Nu Skin Enterprises, Inc. (NYSE: NUS) remains up more than 115% over the last year, but declined approximately 11% in February. The company reported a 28% increase in revenue for the fourth quarter of 2020 over the same period of 2019.
- Herbalife Nutrition, Inc. (NYSE: HLF) traded down approximately 12% for the month. Strong fourth quarter revenue growth of 15.6% was still beneath analyst expectations and resulted in its stocks trading significantly downward. Both NUS and HLF are experiencing the consequences of consistent success and the difficulty of beating increasing analyst expectations.
- Medifast, Inc. (NYSE: MED) rose 7.8% during February and now stands 216% above levels from the same time one year ago. The company’s fourth quarter results beat analyst expectations and included revenue that was up 55.3% year-over-year.
- USANA Health Sciences, Inc. (NYSE: USNA) stock reached a new 52-week high of $101.50 following the announcement of its fourth quarter revenue results, which increased 14.5% year-over-year. Both the EPS and revenue beat analyst expectations by far.
- eXp World Holdings (NASDAQ: EXP) rose an additional 13.3% and ended the month up 1,163.4% over the course of the last year. The company’s fourth quarter results included both record revenue (an increase of 122% year-over-year) and profitability, but the stock sank over the next several sessions.
- Primerica, Inc. (NYSE: PRI) rose 1.7% over the course of the month. It hit a new 52-week high of $149.05 in early February. Its fourth quarter financial results met expectations and included revenue of 12.5% year-over-year.

Short Interest Data & Analysis
Short interest has generally declined across the industry as the markets reached their mid-March and COVID-19 induced lows. Industry-wide days to cover fell to 2.4, the lowest level since a recorded 1.5 in August of 2020.
- USNA fell to 6.9 days to cover, the stock’s lowest levels since July of 2020
- PRI fell to 1.5 days to cover, its lowest level since the TDSI began tracking in March of 2020
- EXPI short interest dropped to 0.7—its lowest levels since the TDSI began tracking data
The number of sell-side analysts maintaining “buy” and “hold” ratings on industry stocks remained flat at 97%, but the number of analysts recommending “hold” as opposed to “buy” increased slightly. The number of analysts recommending “sell” remained sparse.
“Looking forward into the remainder of 2021, we see continued strength across the industry, and, from a financial results and stock performance perspective, particularly in the first quarter,” Johnson said. “We believe business will remain strong through the year. However, as we move into the second quarter and beyond, the year-over-year comparables will become more and more difficult to replicate and exceed.”
-
January 2021
Brought to you by Direct Selling Capital Advisors
Strong January Performance Drives TDSI to All-Time High
A volatile market month ended with strong gains for direct selling stocks. The Direct Selling Capital Advisors Index (formerly Transformation Capital Direct Selling Index (TDSI)) rose 18% during January, as compared to a loss of 2% for the Dow Jones Industrial Average (DJIA).
January’s strong performance drove the TDSI to an all-time high of $95.65, with 11-month gains of 112.3%, as compared to a much more modest increase of 18% for the DJIA over the same period. Six of the seven large cap stocks drove performance over the course of the month. Tupperware Brands Corporation (NYSE: TUP) was the exception, declining 7.1% during January, but rising 955.4% overall since the end of February last year.
The majority of the tracking set within private companies once again returned to sequential revenue growth in January. Approximately 65% of respondent companies grew revenue as compared to the prior month, now marking nine out of the last 11 months with sequential growth. The average private company within the tracking set grew revenue 48% in January as compared to January of last year. This points to the positive momentum generated over the pandemic period, but it is important to remember that this comparison is to pre-COVID numbers. Year-over-year comparisons as 2021 progresses will be illuminating.
Large Cap Stocks
- Tupperware Brands Corporation (NYSE: TUP) declined slightly over the course of the month (-7.1%) after setting a 52-week high on January 11 ($38.59). This is likely due to consolidating action following impressive gains over the last several months. TUP is expected to report full year 2020 financial results on March 10.
- Nu Skin Enterprises, Inc. (NYSE: NUS) presented choppy trading action with a general upward trend, and ultimately rose 5.9% during the period. The stock now stands 141.9% above its February, 2020 closing price. NUS set a new 52-week high on both January 7 and January 20 and continues to trend upward despite some volatility. NUS is expected to report full year 2020 financial results on February 11.
- Herbalife Nutrition, Inc. (NYSE: HLF) traded with noticeable volatility, ultimately rising 6.1% for the month and now trades 57.5% above its February closing price. While HLF has underperformed NUS, the two stocks seem to be somewhat similar, and HLF also set a new 52-week high on January 6 and 7. HLF is scheduled to report full year financial results on February 17.
- Medifast, Inc. (NYSE: MED) returned to an upward trend rising 19.5% for the month, leading to an 11-month performance of 193.4% and new 52-week highs on each of January 7, 20, 25, 26 and 27. MED has been a leading performer within the large cap tracking set, driven by strong growth in revenue and earnings. Full financial reports are expected to be released later this month.
- USANA Health Sciences, Inc. (NYSE: USNA) closed the month with gains of 7.3% and now stands 25.2% above its February, 2020 closing price. After setting a 52-week high of $92.26 on July 21, the stock has lagged the rest of the large cap set. The company announced fourth quarter net sales totaling $310.5 million, with fiscal year net sales increasing 7% year-over-year to $1.135 billion.
- eXp World Holdings (NASDAQ: EXPI) rose an additional 68.9% over the course of January. The stock now stands 1,015% above its February 2020 levels. The stock rose 17 out of 25 trading sessions during the month with upward volume continuing to significantly exceed down volume. EXPI is now the largest company within the large cap set with a market capitalization of approximately $7.5 billion. On January 19, the company announced a two-for-one stock split, by way of a stock dividend. The next day, the stock ended the session nearly 16% higher. The split is expected to take effect on February 16.
- Primerica, Inc. (NYSE: PRI) rose 4% over the month and now stands 26.4% above its February 2020 levels and has performed well since displaying some significant weakness in late October 2020. Full financial results are expected to be released this month.

Small Cap Stocks
Small cap stock performance was mixed, with four rising, four declining and one flat.
- Medical Marijuana, Inc. (OTC: MJNA) was a notable exception, rising 54.7% during the period and now stands 78.7% above its February, 2020 levels. Parent company Kannaway derives the majority of its revenue from its direct selling business. MJNA has continued its upward trajectory following the end of the month.
- Nature’s Sunshine Products, Inc. (NASDAQ: NATR) continued its strong performance, rising 7.4% to now stand 95.7% above its February, 2020 levels. The stock has traded consistently higher since the company’s financial results announcement in early November.
- New Age, Inc. (NASDAQ: NBEV) rose 16% in January and now stands 51% above its pre-pandemic levels. The company’s fourth quarter and full year financial results will be the first to include its merger with ARIIX, which was finalized in November, 2020.

Short Interest Data & Analysis
Short interest has generally declined across the industry since the markets reached their mid-March COVID-19 induced lows. The last month saw a net increase from 3.4 days to cover to 3.6 days to cover.
The number of sell-side analysts maintaining “buy” and “hold” ratings on industry stocks increased slightly, while the number of analysts recommending investors “sell” industry stocks continued to decline. Approximately 97% of analysts covering industry companies had “buy” or “hold” ratings on those companies as of the end of the year, with nearly 60% being “buy.”
Looking Ahead
“From a high level, we expect the first half of 2021 to continue the same trends we have seen over the last several months, including continued year-over-year growth within the domestic markets,” says Stuart Johnson, CEO of Transformation Capital. “We believe that fourth quarter performance will be strong on a year‐over‐year basis, as well as guidance for the first quarter. However, we will be very interested to see and analyze full year guidance from the industry’s larger companies as the higher comps set in the second through fourth quarters of 2020 come into play.”
-
December 2020
Brought to you by Direct Selling Capital Advisors
Large Cap Direct Selling Stocks Outperformed the Market in 2020
While December is commonly a quiet trading month, large cap direct sellers extended and consolidated their gains. The month of holiday breaks reflected a quiet period for the markets as a whole, but also signaled a slight upward performance of the Direct Selling Capital Advisors Index (formerly Transformation Capital Direct Selling Index (TDSI)), which rose 2.9%, as compared to gains of 3.3% for the Dow Jones Industrial Average (DJIA).
Prior to the pandemic, on February 28, the TDSI held at $45.74. Since then, the index has risen 77.1%, to $81. This is in comparison to a much slimmer 20.5% gain for the DJIA. The TDSI includes large cap, difficult to move stocks, that have risen 1,037% (TUP), 560% (EXPI), 145% (MED) and 128% (NUS). These stocks, plus three more, represent the seven stocks within the large cap tracking set that have more than doubled since February 28. This performance has been driven by significant company growth, as well as growth within the industry as well—both domestic and European markets. These markets, which saw rapid and steady growth in 2020, were believed to be in decline one year prior.

The large cap tracking set outperformed the markets as a group, with each stock posting gains, save two exceptions who posted small losses following huge November gains. Small cap tracking sets did not follow suit, showing relative weakness. All but two small cap stocks posted losses for December 2020, which provided an anchor effort on the overall performance of the index.
Standouts and Major Events
On January 3, Herbalife Nutrition (NYSE: HLF) reported that it would be repurchasing $600 million worth of its shares from its largest shareholder Carl Icahn, of Icahn Enterprises. As this dips below the threshold of stock ownership within their agreement, Icahn’s representatives will also relinquish their seats on the company’s Board. After initial uncertainty on January 4, the stock surged higher, following Icahn’s statement of continued belief in the company and observation of how the transaction will reduce shares outstanding by approximately 10%.
Standouts within the large cap tracking set include eXp World Holdings (NASDAQ: EXPI), which continued its remarkable performance by adding 18.4% to its gains and standing 560% above February levels.
Within the small cap tracking set, Natures Sunshine Products, Inc. (NASDAQ: NATR) was the lone standout with gains of 20% following a 19% increase in November. The stock has moved steadily higher since reporting strong financial results on November 9.
The TCAP Direct Selling Index
The TDSI is a market capitalization weighted index of all domestic public direct selling companies with a market capitalization of at least $25 million. The index is rebalanced monthly and no single issue is permitted to represent more than 20% of the total value of the index. In the event that a particular issue would exceed 20%, then the excess weighting is redistributed amongst the other index components.
The index delivered strong returns in December, surging 20% higher as compared to an 11.8% increase in the DJIA. Eleven of the 15 index components posted gains on the month, and seven advanced 15% or more. The index now stands 71% above February 28, 2020 levels, as compared to a gain of approximately 16.6% for the DJIA.
“During the month, the number of sell-side analysts maintaining ‘buy’ and ‘hold’ ratings on industry stocks increased slightly, while the number of analysts recommending investors ‘sell’ industry stocks continued to decline,” says Stuart Johnson, CEO of Transformation Capital. “As of the end of the year, approximately 95% of analysts covering industry companies had ‘buy’ or ‘hold’ ratings on those companies with nearly 60% being ‘buy’.”
Large Cap Stocks
- Tupperware Brands Corporation (NYSE: TUP) declined slightly over the course of the month, a bullish sign following its impressive runup over the course of the last several months. TUP now stands 1,037% above its February closing price and has been the leading performer within the large cap tracking set. On December 3, the company announced the completion of its refinancing of senior notes, changing their due date to the fourth quarter of 2023. The stock surged nearly 9% higher on more than five times average trade following this announcement.
- Nu Skin Enterprises, Inc. (NYSE: NUS) rose 6.1% and now stands 128.4% above its February 2020 closing price. The stock began December with a choppy pattern of trading, moving back and forth above and below its 50-day moving average, but appears to have found support beginning on December 21 and has generally trended higher since then.
- Herbalife Nutrition, Inc (NYSE: HLF) traded in a pattern similar to NUS, with choppy patterned trading, but rose only 0.3% for the period. HLF traded 48.5% above its February closing price as of the end of December. With the announcement of Carl Icahn selling his controlling shares back to the company, shares outstanding will be reduced by more than 10%, delivering significant value to shareholders. Since the announcement, the stock has moved approximately 8% higher. Icahn retains approximately 8 million shares, or 6% of shares outstanding.
- Medifast, Inc. (NYSE: MED) following an impressive 45.3% advance over the course of November, MED declined slightly in December (-3.3%) and now stands 145.5% above its February 2020 closing price.
- USANA Health Sciences, Inc. (NYSE: USNA) rose slightly (2.6%). Its gain of 16.6% makes it the only member of the large cap tracking set that has underperformed the DOW (+20.5%) during the pandemic. USNA has consistently held above its 50-day moving average, indicating a relevant level of institutional support, but since setting its 52-week high in July, the stock has not done much of anything.
- eXp World Holdings (NASDAQ: EXPI) rose an additional 18.4% in December and was the leading performer in the large cap tracking set. EXPI has been the second leading performer in the tracking set and during the pandemic period with gains of more than 560% since February 28.
- Primerica, Inc. (NYSE: PRI) rose slightly (2.8%) following a strong November during which it advanced 18.5%. PRI virtually matched the DOW’s performance in December.

Small Cap Stocks
The group as a whole showed some weakness in the period with six of the eight stocks within the tracking set declining during December. One notable exception was Natures Sunshine Products, Inc. (NASDAQ: NATR), which rose an additional 20% after posting 19% gains in November. The stock has traded consistently higher since the company’s announcement of financial results in early November and now stands 82.3% above its pre-pandemic levels. Taking a wider view, every stock within the small cap tracking set, with the exception of LFVN has posted gains during the pandemic period and all but two have outperformed the DOW.

Short Interest Data Analysis and Forecasts
As indicated by the TCAP “days to cover” chart, short interest has generally declined across the industry since the markets reached their mid-March COVID-19 induced lows. The last month saw a slight increase, which TCAP attributes to both lower trading volume as well as many industry stocks trading at or near 52-week highs in recent weeks. Overall, the TCAP Direct Selling Short Interest Index stands at 3.4 days to cover, up for 2.6 days as of November’s report.
Short interest is not always a clear indicator. Increase in short interest can be a bearish sign of increased sentiment among investors that a stock is likely to decline. Conversely, as a stock moves higher, a significant short interest can serve as extra fuel on the fire as investors scramble to “buy to cover” their short positions and mitigate losses.

Forecasts and Expectations
TCAP forecasts the first half of 2021 will continue the same trends seen over the last several months, including continued year-over-year growth within the domestic market. However, the Georgia Senate races, with its democratic victory in both elections, will likely result in significant selling within the equity markets. TCAP also predicts that a democratic victory would heighten the regulatory risk faced by the industry as a whole.
While the election results are significant, they are not expected to have any immediate or short-term impacts on business operations within the industry. “Have we reached an inflection point that will carry the industry over the next several years?” Johnson asks. “Our hope is definitely ‘yes’.”
-
November 2020
Brought to you by Direct Selling Capital Advisors
November Showed Direct Selling Stocks Outperforming Markets
November represented a strong period for direct selling stocks as a whole, as reflected in the Direct Selling Capital Advisors Index (formerly Transformation Capital Direct Selling Index (TDSI)), which rose an additional 20% over the course of the month. Direct selling stocks continue to outperform, driven by exceptional third quarter financial results related to uncommon strength in both domestic and European markets.
The performance of the domestic market points to a record domestic direct selling revenue for 2020. Of the multi-nationals reporting segmented information, Herbalife reported 55% year-over-year growth in North America; Nu Skin reported 81% growth in a segment which includes North America; Medifast, a primarily domestic company, reported 43% growth; Tupperware reported a growth of 42% and USANA reported 12%.
“The performance of direct selling stocks, as a group, has been something to watch over the last eight months,” says Stuart Johnson, CEO of Transformation Capital. “Six stocks amongst our tracking set have more than doubled over that period and four are up over 200% including gains of 1,080%, 497% and 458%.”
Large-cap Stocks
Standouts among large-cap stocks include Medifast, Inc. (NYSE: MED), which advanced an additional 45% during November, reporting revenue up nearly 43% year-over-year, with a gain of nearly 154% since the end of February; Primerica, Inc. (NYSE: PRI) which advanced more than 18% during November after a stagnant three months; and eXp World Holdings (NASDAQ: EXPI), which added 25.8% to its gains and now stands nearly 458% above February levels.
- Tupperware Brands Corporation (NYSE: TUP) advanced an additional 6.1% and now stands 1,081% above its February 2020 closing price.
- Nu Skin Enterprises (NYSE: NUS) rose 5.2% and now stands 115.3% above it’s February 2020 closing price. The company grew revenue 19% year-over-year.
- Herbalife Nutrition, Inc. (NYSE: HLF) reported the largest sales quarter in the company’s history on November 5. HLF now stands 48% above its pre-pandemic levels. The company has more than $1 billion in cash on the balance sheet and, based on its track record, is expected to aggressively return value to shareholders, which would further buoy the stock price.
- Medifast, Inc. (NYSE: MED) now stands 153.8% above its February 2020 closing price. The stock has steadily advanced and now sits in a consolidating pattern, above $200, after setting a 52-week high on November 30.
- USANA Health Sciences, Inc. (NYSE: USNA) declined 0.6% in spite of reaching $298.5 million in third quarter revenue, well ahead of analyst consensus estimates of $280 million. EPS increased 32% and represented a record quarter for the company.
- eXp World Holdings (NASDAQ: EXPI) rose an additional 25.8% and remains a top leader with the tracking set, posting gains of 458% since the end of February.
- Primerica, Inc. (NYSE: PRI) advanced 18.5%, and revenue and EPS grew 9% and 23% year-over-year respectively, compared to analyst expectations of 4% and 4.6% respectively.

Small-Cap Stocks
The group as a whole performed well, with 5 of the 8 companies included posting gains of 10% or more. New Age, Inc. (NASDAQ: NBEV) gained an additional 46%, buoyed by optimism surrounding its merger with ARIIX, while Nature’s Sunshine Products, Inc. (NASDAQ: NATR) rose 19% and has now advanced 51.6% during the pandemic period.
- New Age, Inc. (NASDAQ: NBEV) rose 46.6% and now stands 69.8% above its February close. Management expects the recent merger with ARIIX to result in a combined entity with more than $500 million in annual revenue and to realize cost synergies of more than $20 million.
- Sharing Services Global Corporation (OTCBB: SHRG), the parent company of Elepreneurs, advanced an additional 22.6% and now stands 500% above its February 2020 close.
- Nature’s Sunshine Products, Inc. (NASDAQ: NATR) rose 19% and has now advanced 51.6% during the pandemic period. The company reported its highest revenue quarter in company history and a more than four-fold increase in EPS.Small-Cap Stocks

Looking Forward
“With a remarkable, to say the least, 2020 coming to end, we find ourselves taking stock of what has transpired and, more importantly, what to expect in the future,” says Stuart Johnson, CEO of Transformation Capital. “The question now becomes what’s next? We believe the market dynamics that have driven performance in the pandemic era have not changed and will not change quickly. As a result, we believe that at least the first half of 2021 will continue the current trend of strong growth across the majority of the industry.”
-
October 2020
Brought to you by Direct Selling Capital Advisors
October Sees Slight Decline for TDSI
October was a relatively strong month for direct selling for most of the period until market-related weakness drove the stocks lower over the last week. According to the investment banking and business development firm, the Direct Selling Capital Advisors Index (formerly Transformation Capital Direct Selling Index (TDSI)) decreased slightly (-3.4%), as compared to a decline of -4.6% for the Dow Jones Industrial Average (DJIA). The TDSI has advanced an impressive 40% since the beginning of March, as compared to a more modest increase of 4.3% for the Dow.
Large-Cap Stocks
During the month of October, three large-cap stocks—Nu Skin, USANA and Tupperware—exceeded expectations,
- On October 28, before the market opened, Tupperware Brands Corporation (NYSE: TUP) reported financial results for the third quarter of 2020, that seemed to take everyone by surprise. While Transformation Capital has been reporting bullishly on TUP’s turnaround in recent months, the results were ahead of its optimistic expectations. Following the announcement, the stock gapped up 25% at the market’s open, and advanced as much as 40% higher during the session, before closing the day up 35% on 10X average trade. TUP’s climb continued through the end of the week, despite some significant downward pressure from the markets. To put the Company’s surprising results in perspective, consider this:
- The third quarter of 2020 represented 1.) the highest quarterly revenue the Company has achieved in 6 quarters; 2.) the first time in 36 quarters that the Company has reported double-digit YoY revenue growth; and 3.) 42% YoY growth in the North American market, which is the highest growth rate experienced since 2002.
- The Company appears to now be managed exceptionally well with the new management team, just installed in April, making significant progress in growing the business, while also reducing debt and cutting costs.
- Nu Skin Enterprises, Inc. (NYSE: NUS) pre-announced third quarter 2020 financial results on October 1, which included revenue well head of internal guidance and analyst expectations. The mid-point of the announced revenue range of $700-$703 million represents a YoY increase of approximately 19%. The following day the stock gapped up 9% and Nu Skin remains one of the leading performers among the large-cap group. Following the end of the month, NUS formally announced third quarter results and increased guidance for the full year 2020. Continuing a trend identified months ago, the Company’s strong performance was driven by 83% YoY growth within its America’s/Pacific reporting segment.
- USANA Health Sciences, Inc. (NYSE: USNA) finally broke out of the extended downtrend that the stock had been in since mid/late July, and advanced 2.7% over the course of the month. Transformation Capital saw no particular reason for the weakness in the stock, and USANA’s third quarter results, reported on October 20, proved the investment firm correct. Over the next three sessions, the stock traded approximately 10% higher, before falling off slightly into the end of the month along with the general markets.

Small-Cap Stocks
Small-cap stocks among the tracking set again showed some weakness over the course of the month.
“The fact of the matter is that we are in/are entering a significant period of uncertainty within the markets,: said Stuart Johnson, CEO of Transformation Capital. “As investors look to balance their portfolios to adjust for this risk, smaller, lightly traded and less liquid companies often carry a disproportional amount of this burden.”
- Defying this trend, New Age, Inc. (NASDAQ: NBEV), rose an impressive 35.3% during October. Beginning early in the month, NBEV has been on a strong, upward trend driven by some significant up days on above average trade. The Company is set to close its merger with ARIIX, originally announced in July, at the end of November.
- Educational Development Corporation (NASDAQ: EDUC), a new addition this month, declined slightly during the month (-.8%), but has posted impressive gains of 226% since the end of February 2020. The Company, an educational children’s book publisher and marketer, operates the direct selling company Usborne Books, which accounts for most of its revenue. Pandemic-related trends have had a significant upside impact on the Company’s business.

- On October 28, before the market opened, Tupperware Brands Corporation (NYSE: TUP) reported financial results for the third quarter of 2020, that seemed to take everyone by surprise. While Transformation Capital has been reporting bullishly on TUP’s turnaround in recent months, the results were ahead of its optimistic expectations. Following the announcement, the stock gapped up 25% at the market’s open, and advanced as much as 40% higher during the session, before closing the day up 35% on 10X average trade. TUP’s climb continued through the end of the week, despite some significant downward pressure from the markets. To put the Company’s surprising results in perspective, consider this:
-
September 2020
Brought to you by Direct Selling Capital Advisors
September a Volatile Period for Markets
According to the investment banking and business development firm, members of its direct selling tracking set were not immune to the action within the broader indices. Generally speaking, the larger capitalization stocks were flat, to slightly down during the month, with a few notable exceptions. Among small-cap stocks, a number of recent leaders pulled back off of recent highs.
As a whole, the Direct Selling Capital Advisors Index (formerly Transformation Capital Direct Selling Index (TDSI)) declined 4.43% over the course of September compared to a decline of 2.28% for the Dow Jones Industrial Average (DJIA). However, the TDSI remains up 44.17% since February 28, 2020, as compared to a gain of 9.34% for the Dow.
Large-Cap Stocks
Tupperware moved up to Transformation Capital’s large-cap tracking set this month as the Company rose an additional 24% over the course of the period and now possesses a market capitalization of ~$1 billion, which is the minimum requirement for inclusion in the large-cap list.
- Tupperware Brands Corporation (NYSE: TUP) now stands more than 600% above its February 2020 closing price based on positive trends across its business driven by new management and a pandemic-oriented trend towards at-home food preparation and storage.
- Nu Skin Enterprises, Inc. (NYSE: NUS) advanced an additional 6% and now stands 107% above its pre-pandemic levels. After the market closed on October 1, Nu Skin announced revenue results for the third quarter of 2020 that were nearly $100 million ahead of the low end of the Company’s previously issued guidance range. As a result, the stock rallied approximately 10% on October 2 on trade nearly 3X average.
- Other interesting notes include Primerica, Inc. (NYSE: PRI), which our research indicates is significantly outperforming its insurance and financial services peers.

Small-Cap Stocks
The small-cap stocks among Transformation Capital’s tracking set showed some weakness over the course of the month, but much of that was within stocks that have advanced significantly over the course of the last several months.
- Natural Health Trends Corp (NASDAQ: NHTC) rose more than 20% between September 11 and September 14, on heavy trade, before settling into a gain of 8.25% for the period.
- Sharing Services Global Corporation (OTC: SHRG) fell 47% during the period but remains 525% above its February 2020 closing price.

Looking Ahead
According to Transformation Capital, September continued the consolidating action generally seen among its direct selling tracking set since August.
“We believe this consolidation is a prelude to an exceptionally strong end to what has proved to be a phenomenal year across the channel,” said Stuart Johnson, CEO of Transformation Capital. “We continue to believe that 2020 remains on track to surpass 2016’s record domestic direct selling revenue and our short to mid-term thesis remains unchanged. Our belief is that the industry will continue to perform well financially and outperform the major indices for the foreseeable future.”
-
August 2020
Brought to you by Direct Selling Capital Advisors
Both Large-Cap and Small-Cap Stocks Show Gains in August
August saw gains for the majority of the large-cap and small-cap stocks in its tracking set. According to the investment banking and business development firm, each of the stocks in its large-cap set remain well above their pre-pandemic levels, and the majority continue to significantly outperform the major indices. Smaller-cap stocks performed well during the month, with all but one showing gains during the period and four rising double digits.
“From a broad perspective, we believe that the direct selling industry, as a whole, is experiencing a renaissance within the domestic market,” said Stuart Johnson, CEO of Transformation Capital. “As indicated in the chart below, domestic direct selling revenues have been flat to slightly down since reaching an all-time high of more than $36 billion in 2016. It is our belief that 2020 sales will reach, and likely exceed, that record figure.”

TCAP Direct Selling Index
August was a generally strong month for the markets as a whole with the Dow Jones Industrial Average (DJIA) rising approximately 7.6% during the month, which compares to a gain of 4% for the TCAP Direct Selling Index (“TDSI).
The TDSI is a market capitalization weighted index of all domestic public direct selling companies with a valuation of at least $25 million. TDSI data is tracked back to March 1, 2020 and the index now stands 56% above February 28, 2020 levels, as compared to gains of approximately 7% for both the DJIA and S&P 500.

Large-Cap Stocks
Two companies were added to the large-cap tracking group this month: eXp World Holdings, Inc. and Primerica, Inc.
- Nu Skin Enterprises, Inc. (NYSE: NUS) led the large-cap tracking set over the course of August, rising an additional 6%, and now stands more than 96% above its February 28 closing price. The Company reported second quarter financial results after the market close of August 5. Revenue for the quarter was $612.4 million (-1.8% YoY) and earnings per share were $.81 (-2.5% YoY).
- Herbalife Nutrition, Inc. (NYSE: HLF) declined slightly over the course of the month and closed down 4% for the period at a price of $49.15 per share, which is slightly off of its 52-week high of $52.89. An August 6, 2020, Herbalife reported the largest net sales quarter in the Company’s 30-year history with revenue of $1.35 billion (+8.6% YoY) and earnings per share of $.95 (+36% YoY), both of which were ahead of consensus analyst estimates of $1.26 billion and $.91 per share.
- Medifast, Inc. (NYSE: MED) declined only 2.6% during the period. Despite this small decline, MED continues to lead the historical large-cap tracking set with gains of more than 100% since March 1, 2020. MED reported second quarter financial results including revenue of $220 million (+17.6 YoY) and earnings per share of $1.86 (+6.3% YoY). Both revenue and earnings per share results were ahead of consensus analyst expectations of $195.75 and $1.84 per share.
- USANA Health Sciences, Inc. (NYSE: USNA) declined approximately 3.4% during the month after reaching a new 52-week high in the third week of July. While the stocks monthly decline is not substantial, it is a continuation of a trend that began following the Company’s July announcement of financial results and feels a little different than the rest of the group from a purely technical perspective.

New Additions
- eXp World Holdings (NASDAQ: EXPI) is a cloud-based real estate brokerage service for residential homeowners and homebuyers that now carries a market capitalization of more than $3 billion after rising 124% over the course of August and an impressive 365% since its February 28, 2020 closing price. On August 5 EXPI reported record revenue and earnings per share of $354 million (+33% YoY) and $.11 per share, which compared to a loss of $.04 per share in the prior year period.
- Primerica, Inc. (NYSE: PRI) rose 4.66% during the month and now stands approximately 13% above its February 28 closing price. On August 5, PRI reported financial results that included revenue of $525.8 million (+4% YoY) and earnings per share of $2.44 (+10% YoY).
Small-Cap Stocks
All but one of the smaller-capitalization stocks within the industry has continue to outperform the DJIA since the beginning of March, and all but one rose over the month of August.
- Tupperware Brands Corporation (NYSE: TUP) rose an additional 6%, following an impressive gain of 225% during the prior month, and now stands approximately 472% above its February 28 closing price.
- Sharing Services Global Corporation (OTC: SHRG) continued its impressive run of late with an additional gain of 27% during the month and now stands 1,070% above its levels at the end of February. SHRG, the parent Company of Elepreneurs, a health and wellness beverage Company focused on nootropics has been the top performer amongst all stocks in our tracking set since we entered the pandemic environment.
- LifeVantage Corporation (NASDAQ: LFVN) rose 17% during the period following the reporting of financial results on August 18 that included both a sequential and year-over-year increase in revenue of approximately 6%.

Looking Ahead
Looking forward and moving into the fall and winter months, Transformation Capital believes that the industry will see a strong close to 2020 with typical seasonal trends and a continuation of the momentum built over the last six months driving the industry towards a potential record year.
“There are a number of bullish indicators for the industry, including the anecdotal evidence we are seeing, as well as the sentiment of the vast majority of analysts covering industry stocks, 97% of which have “buy” or “hold” ratings on the industry stocks they cover,” said Johnson. “In addition, we are seeing a decline in short interest in industry stocks across the board meaning investors are not inclined to bet against industry stocks at this time.”
-
2020 Q2
Brought to you by Direct Selling Capital Advisors
Direct Selling Stocks Continue to Outperform DJIA
Insights show that both large-cap and small-cap direct selling stocks continue to dramatically outperform the Dow Jones Industrial Average (DJIA).
Large-Cap Stocks
The four large-cap direct selling stocks continued to march higher during July, surging a collective 16.5% during the period, compared to a relatively paltry 2.4% gain in the DJIA for the period, and have now risen more than 67% since February 28, 2020, as compared to 5.7% increase for the DJIA. Both individually and as a group, these direct selling stocks continue to outperform the major indices since March 1, 2020.
- Medifast, Inc. (NYSE: MED) continues to stand out as a leader among the group as it gained an additional 20.4 percent over the course of July and has now more than doubled since its February 28, 2020 close (106.8 percent). MED is expected to report its second quarter 2020 financial results after the market close on August 5. The Company declined to provide guidance for the quarter, and withdrew its full year guidance, due to uncertainty related to the COVID-19 pandemic. However, during its first quarter 2020 earnings conference call, management stated that April revenue had tracked slightly ahead of the same month of the preceding year. Analyst consensus estimates call for earnings of $1.84 per share, which would represent a year-over-year increase of 5.1 percent, on revenue of $194.75 million, or 4.1 percent above the second quarter of last year. Medifast is currently trading near its 52-week high, which represents its highest levels since the fall of 2018, and the stock has doubled in the last four months alone. Based on these facts alone, it would not be surprising to see some profit taking at these levels, regardless of the strength of the Company’s performance. However, if the Company reports results and issues guidance significantly ahead of expectations, then it would not be surprising to see the stock continue its upward trajectory. UPDATE: After the market closed on August 5, 2020, Medifast reported second quarter financial results including revenue of $220 million (+17.6 percent YoY) and earnings per share of $1.86 (+6.3 percent YoY). Both revenue and earnings per share results were ahead of consensus analyst expectations of $195.75 million and $1.84 per share. Prior to the release, MED traded to a new 52-week high of $183.54. On August 6, the day following the release, the stock traded off approximately 10 percent closing at $164.44. Since that time MED has been consolidating in that range, on average trade. As predicted above, it is believed this is not due to any disappointment in the stock’s performance, but, instead, profit taking as a result of its impressive run over the last several months, as well as a lack of forward-looking guidance, which was attributed to uncertainties related to the COVID-19 pandemic.
- Nu Skin Enterprises, Inc. (NYSE: NUS) also continued its strong, pandemic environment performance with a July gain of 17.3 percent, which allowed it to maintain its position as the second leading performer among the top-tier direct selling stocks since March 1, with a total gain of 87.1 percent over the last four months. Following the markets close on July 1, 2020, Nu Skin reported preliminary second quarter revenue results in range of $603 to $608 million, which was well ahead of its internal guidance range of between $520 and $550 million for the period. The following day the stock surged 25 percent on more than 4X average trading volume. Since that announcement, the stock has generally traded sideways in a consolidating pattern ahead of its complete second quarter earnings announcement, which is also scheduled after the market close on August 5. Analyst consensus estimates call for earnings of $0.63 per share on revenue of $606.02 million, which both represent year-over-year declines. Like Medifast, Nu Skin is also trading near its 52-week high. As a result, if the Company doesn’t come in ahead of those numbers and/or raise guidance for the remainder of the year, then it would not be surprising to see some profit taking here as well. However, based on Transformation Capital’s proprietary look at industry trends and data, as well as Nu Skin’s strong pre-announcement, it is expected that the Company will report results ahead of estimates and raise guidance for the remainder of the year. UPDATE: Nu Skin also reported second quarter financial results after the market closed on August 5. Revenue for the quarter was $612.4 million (-1.8 percent YoY) and earnings per share were $.81 per share (-2.5 percent). Despite the slight year-over-year declines, Nu Skin’s results were ahead of updated consensus analyst expectations of $606 million and $.67 per share. More importantly, and as predicted above, the Company raised its full-year guidance for both revenue and earnings per share. Since that time, the stock has remained stable and pegged near its 52-week high. The lack of dramatic response to the Company’s financial report is likely due to its pre-announcement discussed above.
- Herbalife Nutrition, Inc. (NYSE: HLF) turned in a strong July performance as well, rising 13.8 percent during the period and now 58.3 percent since March 1. Before the market opened on Monday, July 13, Herbalife announced a modified Dutch auction tender offer to repurchase up to $750 million of the Company’s shares at a price of not more than $50, and not less than $44.75, per share. At the same time, the Company announced the largest volume points quarter in the Company’s history (following a record first quarter). Following these announcements, Herbalife’s stock moved aggressively higher, on more than 6X average trading volume, and closed the day 13 percent higher. Since that time, and much like Nu Skin and Medifast, Herbalife’s stock has been consolidating near the 52-week high it set on July 13, and much will depend on its earnings announcement scheduled for after the market close on August 6, as well as management’s outlook going forward. Herbalife declined to provide guidance when they announced first quarter results, however, record volume points serves as a strong indicator of the manner in which the Company’s business is performing. UPDATE: On August 6, 2020, after the market’s close, Herbalife reported the largest net sales quarter in the Company’s history with revenue of $1.35 billion (+8.6 percent YoY) and earnings per share of $.95 (+36 percent YoY), both of which were ahead of analyst consensus estimates of $1.26 billion and $.91 per share. Leading into the announcement, HLF traded nearly up to its 52-week high ($52.89) and reached $52.80 per share. On August 7, the stock traded down approximately 5 percent and has continued to trend down slightly since that time. Transformation Capital believes much of this is due to profit taking near 52-week highs, a “sell the news” mentality, and the fact that management did not provide forward-looking guidance.
- Wrapping up the large cap’s, USANA Health Sciences, Inc. (NYSE: USNA) rose 10.5% during the month, despite some significant profit taking following the Company’s second quarter earnings announcement on July 21, and now sits 22.8% above its February 28 closing price. USANA reported earnings of $1.32 per share, which beat analysts’ expectations by $.13, and revenue of $259 million, slightly below expectations, but up year-over year. The Company also raised its full year guidance for both revenue and earnings per share. Leading up to its earnings release, USANA traded up to a 52-week high of 92.26 before declining due to mixed results and some profit taking through the end of the month.
Transformation Capital remains bullish on the prospects of each of these four companies. While several possess complex operating and financial dynamics related to their global footprint, Transformation Capital believes the macro environment continues to provide tailwinds to each of their businesses, which leads to the belief that the short- to mid-term outlook for each remains strong.

Small-Cap Stocks
For smaller capitalization stocks within the industry, all but one has continued to outperform the DJIA since the beginning of March and, collectively, the group is up 42.6% since that time. The group, in general, had a relatively flat July, with two notable exceptions.
- The big performance surprise was Tupperware Brands Corporation (NYSE: TUP). Historically, Tupperware might have topped the large-cap list and based on recent performance, might be rejoining it shortly. The company closed June at 4.75 per share and, one month later, closed July at $15.43, a huge one month gain of 225% (482% since March 1). On July 29, Tupperware announced financial results that included revenue and earnings per share ahead of analysts’ expectations and, apparently, brought some new believers to the company’s turnaround story. The largest hurdle currently facing the company is approximately $500 million in debt that must be refinanced, or renegotiated, by June 2021. Investors now seem bullish regarding the company’s prospects in addressing this key financial issue. Furthering investor confidence was the company’s ability to retire approximately $100 million of their outstanding bonds at less than par value and the new management team’s success in cutting approximately $60 million in expenses on the way to a $180 million goal. Our internal definition of “large cap” within the direct selling industry is a minimum of a $1 billion market cap, which, based on its current $757 million valuation, puts Tupperware in play for inclusion on that list sometime in the near future.
- The second small cap with market moving news during the month was New Age Beverages Corporation (NASDAQ: NBEV), which, on July 20, announced an agreement to merge with ARIIX, along with four subsidiary companies, with consideration including $25 million in cash, 18 million shares of NBEV’s common stock, a six-month convertible note for $10 million and an additional $141.25 million convertible note that matures 24 months from closing. Based on Transformation Capital’s internal estimates this implies total consideration of more than $200 million. Further, based on research, this transaction makes ARIIX and/or its previous equity owners, easily the largest shareholders in the Company with a position north of 16% (next closest is 5.8%). As a result, we consider this to be a de facto reverse merger and, as a result, we would not be surprised to see a significant shift in the C-suite in the coming months. The day following the announcement the stock closed 41% higher on approximately 15X normal trading volume and has since settled into a consolidating pattern. The stock closed the month up 43% overall. New Age acquired Morinda Holdings, Inc. in December of 2018, which represented the Company’s initial entry into the direct selling space. NBEV’s stock has generally trended downward since that time, likely due to a history of significant operating losses. Management projects that the combined company will generate in excess of $500 million in revenue in 2020 and that the acquired businesses will provide a significant lift to the Company’s profitability.

A New Addition
Sharing Services Global Corporation (OTCQB: SHRG) is a new addition to this month’s report after the parent company of Elepreneurs and Elevacity rose 309% over the course of July and now stands 819% above its February 2020 close. In mid-March, the Company settled a long-standing piece of litigation with a former large holder and executive. Subsequently, on July 13, SHRG reported revenue of $131.4 million for its fiscal year ended April 30, 2020, which represented a year-over-year increase of 53%. The stock surged higher the last two days of the month, on volume significantly higher than average, indicating a bullish sentiment from investors. SHRG’s market capitalization now stands at $50 million, placing it well above our internal minimum of $25 million for inclusion on this list.

Looking Forward
All indications within Transformation Capital’s proprietary data set show another strong month for the industry in July among private companies, leading to the belief that most of the publics will follow suit. Well-run, customer-focused companies with consumable product offerings, particularly within nutrition, wellness, weight loss and personal care, are thriving today and there is no reason that should change in the near future.
NOT INVESTMENT ADVICE
This document is for informational purposes only; you should not construe any such information or other material as legal, tax, investment, financial, or other advice. Nothing contained in this document constitutes a solicitation, recommendation, endorsement or offer by Direct Selling Capital Advisors or any third-party service provider to buy or sell any securities or other financial instruments in this or in in any other jurisdiction in which such solicitation or offer would be unlawful under the securities laws of such jurisdiction.
All content in this document is informational in nature and may not address all the circumstances or information related to any particular individual or entity. Nothing in the document constitutes professional and/or financial advice, nor does any information in the document constitute a comprehensive or complete statement of the matters discussed or the law relating thereto. Direct Selling Capital Advisors is not a fiduciary by virtue of any person’s use of or access to this document. You alone assume the sole responsibility of evaluating the merits and risks associated with the use of any information or other content in the document before making any decisions based on such information or other content.
Analysis brought to you by:

Direct Selling Capital Advisors, LLC (DSCA) is a boutique investment banking, business development and corporate finance advisory firm primarily focused on the direct selling vertical, as well as ancillary businesses. Located in Dallas, Texas, DSCA’s core service offerings include both buy- and sell-side M&A advisory, equity and debt financing, as well as joint venture and partnership opportunities. For more information, visit DirectSellingCapital.com.