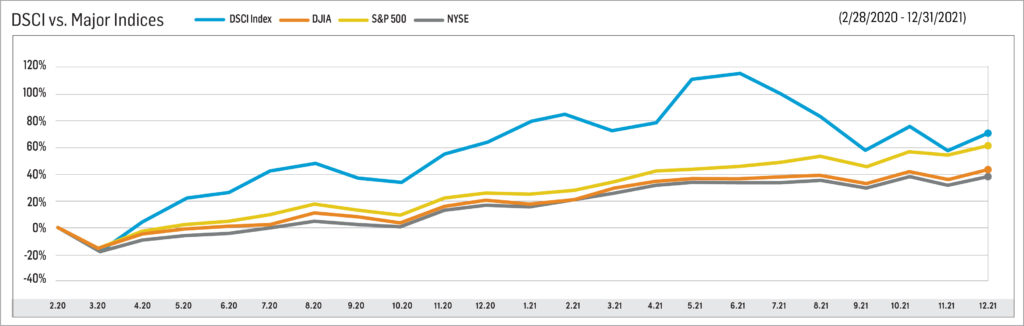
The Direct Selling Capital Advisors Direct Selling Index (DSCI) rose 4.1% in December, partially reversing an 8.5% decline in November. The positive performance in December marked the second up month in the last three. For the full year 2021, the DSCI increased 1.9%. At its peak in mid-2021, the compilation of direct selling stocks was up around 30% on the year. The Dow Jones Industrial Average (DJIA) moderately outperformed the DSCI in December, rising 5.4%. The Dow rallied 20.2% over the full year 2021.
A somewhat surprising aspect of the DSCI’s solid 4.1% increase in December was that the performance of the individual components of the index showed significant dispersion. Seven members rose; nine fell; and one was unchanged. Only one index component, large cap NuSkin Enterprises, Inc. (NYSE: NUS), posted a double-digit percentage increase (+15.7%), while large cap Betterware de Mexico (NASDAQ: BWMX) and small cap Medical Marijuana, Inc. (OTC: MJNA) posted declines of more than 10%.
The large cap subgroup of the DSCI significantly outperformed the small cap components. Five of the nine largest stocks posted gains during December, while only two of the eight small caps rose. One small cap stock was unchanged. In November, the performance of the two subgroups was quite similar.
From a longer-term perspective, the DSCI has gained a cumulative 61.1% since the March 1, 2020 index inception, compared with a 43.0% increase for the DJIA over the same period. In 2021, the DSCI inched 1.9% higher. The DJIA, on the other hand, rose 20.2% last calendar year.
The broad stock market has performed extremely well since the COVID-19 pandemic hit in early March 2020. Indeed, the total return of the S&P 500 Index was nearly 29% in 2021 as it outperformed the Dow Jones Industrials Index. Furthermore, the stock market is now more than 40% higher than before the pandemic hit and has more than doubled since the March 2020 pandemic lows. Despite the rally, the stock market, as measured by its P/E ratio based on consensus forward year earnings estimates, is valued quite similarly now to what it was in early 2020. Back then, the market traded at around 20x consensus 2020 earnings; today it trades at about 21x consensus 2022 projections. Both solid revenue increases and cost controls implemented during the crisis have boosted the underlying earnings of the typical company.
In sum, this represents a reasonably positive backdrop for the overall stock market in 2022. The U.S. Federal Reserve is likely to raise short-term interest rates several times this year, but, bowing to likely political pressure in a mid-term election year, the magnitude of the increases should be fairly modest. The central bank will probably decide to tolerate a higher level of inflation in the economy than it would have in the past.
Looking Forward
Direct selling stocks, as a group, underperformed in the stock market in 2021, reversing some of the group’s dramatic outperformance over the last ten months of 2020 (after the DSCI was established). Looking forward, two factors suggest that the DSCI could post improved results in 2022, particularly early in the year. First, the stock market seems reasonably valued (as noted above), and if it does move higher this year, the direct selling stocks, which generally are considered to carry higher risks—and rewards—than the overall market, seem poised to outperform.
Second, it appears that a number of DSCI components were the targets of tax loss selling in the late stages of 2021. As the calendar turns to 2022, that selling pressure will end. Two prime examples of this may be the large caps Tupperware Brands Corporations (NYSE: TUP) and Medifast, Inc. (NYSE: MED). After both stocks notably underperformed the overall stock market in 2021, they rose 5.6% and 2.2%, respectively in just the first two trading days of 2022.
More tangible data points for DSCI members will likely not be available until February when the companies begin to report 4Q 2021 earnings and provide 2022 guidance. These earnings results and managements’ revenue and earnings guidance will likely be major factors in the companies’ share price trajectories in 2022.
CHARTS & ANALYSIS
The DSCI is a market capitalization weighted index of all domestic public direct selling companies with a market capitalization of at least $25 million. The index is rebalanced monthly, and no single issue is permitted to represent more than 20% of its total value. In such an event, the excess weighting would be redistributed among the other index components.
The DSCI rose in December but still slightly underperformed the DJIA during the month. Specifically, the DSCI increased 4.1% during December, while the DJIA gained 5.4%. DSCI data is tracked back to March 1, 2020. The index has risen 61.1% since that date versus a 43.0% gain in the DJIA. At its peak in June 2021, the index had risen 115.6% since inception. For the full year 2021, the DSCI rose 1.9% versus a 20.2% gain for the DJIA.
Large Cap
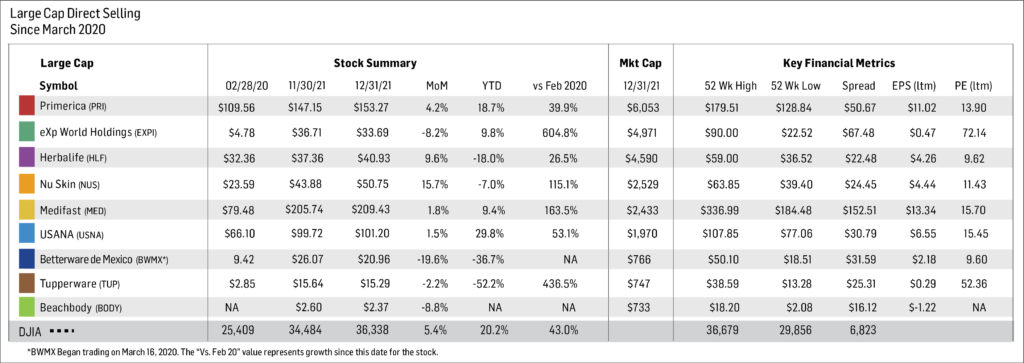
Betterware de Mexico (NASDAQ: BWMX) was the worst performer among the large cap direct selling stocks in December as it declined 19.6%. The DSCI, on the other hand, gained 4.1% during the month. Over the full year 2021, BWMX fell 36.7%. After a stellar performance from March 2020 through early July 2021, the stock has lost around 60% of its value over the last six months. In late October 2021, BWMX announced that its 3Q 2021 revenue and EBITDA increased 4% and decreased 3%, respectively, versus the year-ago period. Both measures represented substantially slower growth than during prior periods.
BWMX began trading in March 2020 after the Company’s merger with SPAC sponsor DD3 Acquisition Corp. BMWX specifically targets the Mexican market; it serves three million households through distributors and associates in approximately 800 communities throughout Mexico.
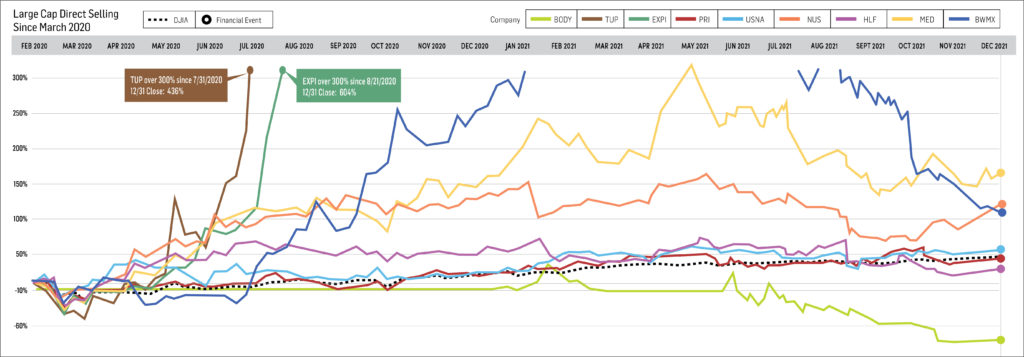
Tupperware Brands Corporation (NYSE: TUP) fell 2.2%in December, bringing its full year 2021 loss to 52.2%. Nonetheless, since March 1, 2020, TUP shares have appreciated a resounding 436.5%, the second highest return among all DSCI components over that period. (Only eXp World Holdings, Inc. has gained more: 604.8%.). In early November, TUP reported that 3Q 2021 sales declined 11.0% versus the year-ago period, as the lingering effects of COVID-19 affected its business.
In late November, TUP reported that it had raised $880 million in a new secured credit facility. The new facility lowers the company’s interest rate on term loans by more than 600 basis points; refinances the company’s existing credit facilities; and increases its liquidity by around $100 million.
For the second successive month, Nu Skin Enterprises, Inc. (NYSE: NUS) was the best performing large cap member of the DSCI. NUS rose 15.7% in December. (Indeed, NUS recorded the biggest percentage gain among all index members, large or small cap, during December.) For the full year 2021, NUS shares fell 7.0%. Since the March 2020 establishment of the index, NUS has increased 115.1%.
In early November, NUS reported 3Q 2021 results in which revenue and earnings per share declined 9% and 10%, respectively, from 3Q 2020 levels. Nevertheless, both measures exceeded analysts’ consensus estimates. NUS will report its 4Q 2021 results on February 16, 2022. On that day, NUS will host an investor day at its Provo, Utah headquarters and provide 2022 guidance.
Herbalife Nutrition, Inc. (NYSE: HLF) was the second best performing DSCI component in December, rising 9.6%. For the full year 2021, HLF lost 18.0%. Since the March 2020 establishment of the DSCI, the stock has appreciated 26.5%.
In early November, HLF reported mixed 3Q 2021 results. Its net sales were $1.4 billion, down 6% from 3Q 2020 levels due primarily to lingering effects of the pandemic, but the company’s EPS totaled $1.21, up $0.06 from $1.15 in the year-ago period.
Medifast, Inc. (NYSE: MED) shares gained 1.8% in December, marking its third consecutive monthly gain. In 2021, MED increased 9.4%, and since the March 1, 2020 establishment of the DSCI, the stock has risen 163.5%. As a result, MED has markedly outperformed the direct selling stock index benchmarks both for the full year 2021 and since DSCI inception.
In early November, MED reported impressive 3Q 2021 earnings results. Revenue and diluted EPS increased 52% and 22%, respectively, compared with the year-ago period. In addition, the company slightly boosted its full-year 2021 guidance ranges on both measures.
USANA Health Sciences, Inc. (NYSE: USNA) rose 1.5% in December, which lifted its full year 2021 gain to 29.8%. Since the March 2020 inception of the DSCI, USANA shares have appreciated 53.1%, beating the Dow’s 43.0% cumulative price increase.
In late October, USANA reported 3Q 2021 sales and EPS that declined 8.1% and 5.6%, respectively, from 3Q 2020. COVID-19-related disruptions impacted the company’s operations and ability to ship sufficient product to customers in 3Q 2021.
The DSCI’s best performer since its March 2020 establishment, eXp World Holdings, Inc. (NASDAQ: EXPI) declined 8.2% in December, cutting its full year 2021 gains to 9.8%. Since March 1, 2020, EXPI has rallied an astonishing 604.8%.
In early November, EXPI, the fastest growing real estate brokerage in the world, reported solid 3Q 2021 results; net sales and residential transaction volume nearly doubled versus 3Q 2020 figures, as the total number of its real estate agents rose 82% versus the tally twelve months ago. In mid-December, the company reported that its agent total exceeded 70,000, up dramatically from 41,313 at December 31, 2020.
The largest market cap stock in the DSCI, Primerica, Inc. (NYSE: PRI), rose 4.2% in December, approximately in line with the 4.1% increase in the DSCI for the month. The stock appreciated 18.7% in 2021 and is 39.9% higher since the March 2020 establishment of the DSCI.
On November 8, PRI, a leading provider of financial services in the U.S. and Canada, reported solid 3Q 2021 results. Revenue totaled $693.2 million, up 22% versus the year-ago period. The company benefitted from continued strong momentum in investment and product sales in the period ended September 30, 2021. Indeed, PRI has now put into force more than $900 billion of term life insurance coverage for its customers. Earnings per share in 3Q 2021 was $2.82, flat versus 3Q 2020.
On November 17, PRI’s Board authorized a $275 million share repurchase program through December 31, 2022. This program replaces a $300 million initiative that was approved in February 2021 and was due to expire on June 30, 2022.
The Beachbody Company, Inc. (NYSE: BODY) stock was the second weakest large cap component in the DSCI in December, declining 8.8%. In mid-November, Beachbody, a leading subscription health and wellness com0pany, reported that 3Q 2021 revenue was $208.1 million, down 17% from 3Q 2020, as at-home fitness demand softened. In addition, the company recorded a 3Q 2021 adjusted EBITDA loss of $43.4 million compared with a gain of $31.4 million in the year-ago period.
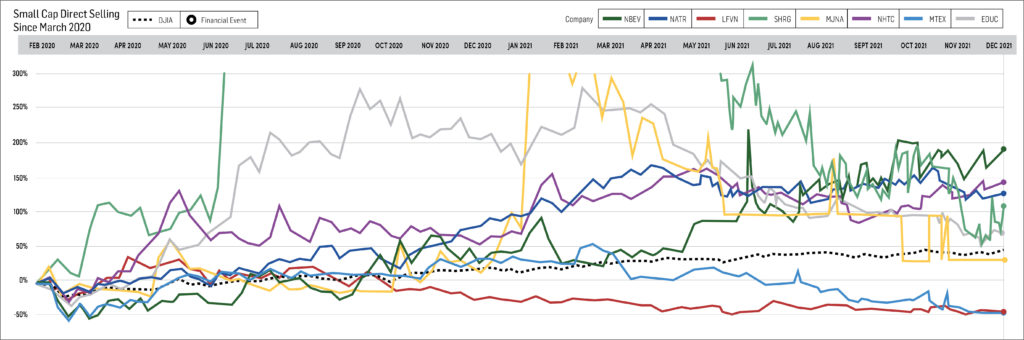
Small Cap
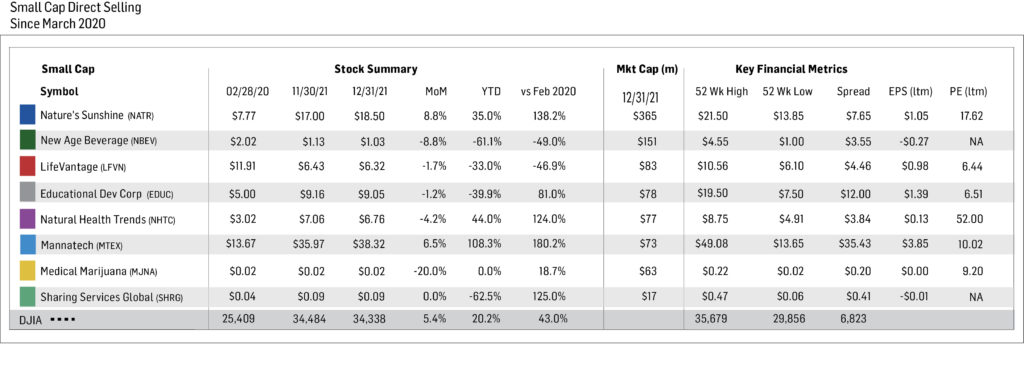
Our small cap tracking set generally trended lower in December as five of the eight components declined and one was unchanged. The strongest performer among the small caps was Nature’s Sunshine Products, Inc. (NASDAQ: NATR), a leading natural health and wellness company. NATR rose 8.8% in December. The stock gained 35.0% in 2021 and 138.2% since DSCI inception. Over all three periods, NATR handily outperformed the DSCI.
Short Interest Data & Analysis
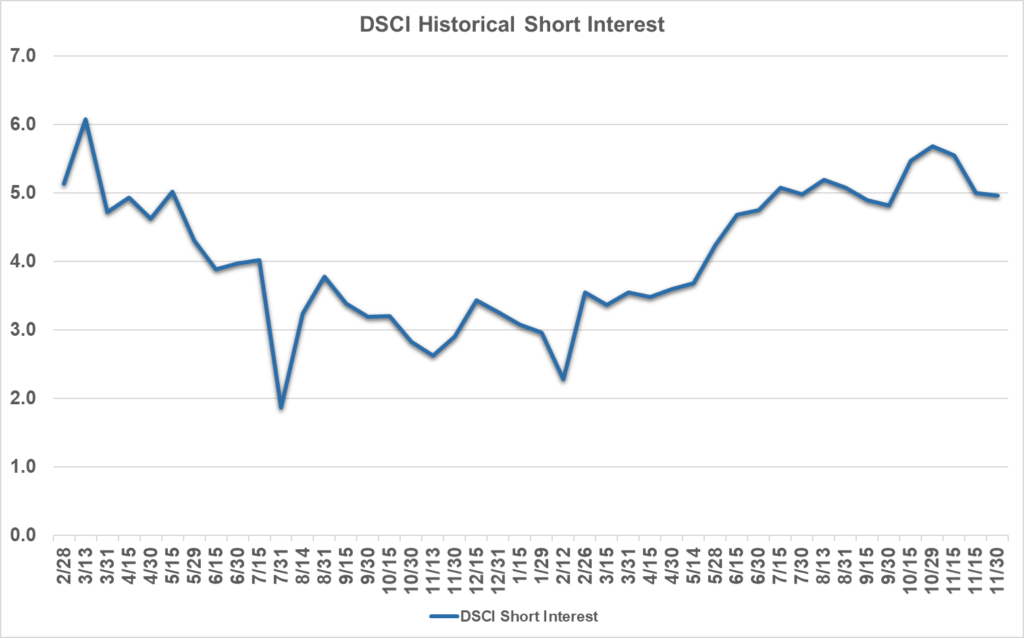
The following chart is an aggregate index of “days to cover” among the entire tracking set. Days to cover is a measurement determined by dividing the total outstanding short interest by average daily trading volume.
As indicated in the chart above, short interest in industry stocks declined during the period, from 5.0 days to cover at 11/15 to 4.3 as of 12/15. The decline was primarily attributable to a significant decline in short interest in TUP, from 8.4 days to cover at 11/15 to 4.3 as of 12/15. Aggregate days-to-cover have increased about 125% since bottoming in mid-February.
Short interest can be a difficult indicator to analyze. On the one hand, an increase in short interest can be a bearish sign in that it indicates an increased view among investors that a stock is likely to decline based on any number of factors, such as a belief that the company’s fundamentals are deteriorating or a belief that it has run too far too fast. Conversely, as a stock moves higher, a significant short interest can serve as extra fuel on the fire as investors scramble to “buy to cover” their short positions and mitigate losses.
Analyst Sentiment Index
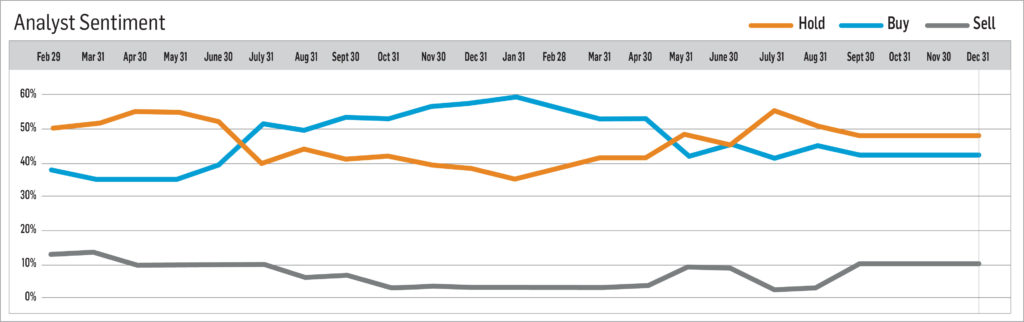
Our Analyst Sentiment Index was unchanged in December from November and remains near the peak level since its March 2020 establishment. During December, the number of sell-side analysts maintaining “buy” and “hold” ratings on industry stocks was 90%. In turn, the percentage of stocks which analysts recommend selling equaled just 10%.
NOT INVESTMENT ADVICE
This document is for informational purposes only; you should not construe any such information or other material as legal, tax, investment, financial, or other advice. Nothing contained in this document constitutes a solicitation, recommendation, endorsement or offer by Direct Selling Capital Advisors or any third-party service provider to buy or sell any securities or other financial instruments in this or in in any other jurisdiction in which such solicitation or offer would be unlawful under the securities laws of such jurisdiction.
All content in this document is informational in nature and may not address all the circumstances or information related to any particular individual or entity. Nothing in the document constitutes professional and/or financial advice, nor does any information in the document constitute a comprehensive or complete statement of the matters discussed or the law relating thereto. Direct Selling Capital Advisors is not a fiduciary by virtue of any person’s use of or access to this document. You alone assume the sole responsibility of evaluating the merits and risks associated with the use of any information or other content in the document before making any decisions based on such information or other content.
Analysis brought to you by:

Direct Selling Capital Advisors provides monthly market analysis based on research and the TDSI index. The TDSI is a market capitalization weighted index of all domestic public direct selling companies with a market capitalization of at least $25 million. Direct Selling Capital Advisors, LLC (DSCA) is a boutique investment banking, business development and corporate finance advisory firm primarily focused on the direct selling vertical as well as ancillary businesses. Located in Dallas, Texas, DSCA’s core service offerings include both buy- and sell-side M&A advisory, equity and debt financing as well as joint venture and partnership opportunities.