In November 2021, the Direct Selling Capital Advisors Direct Selling Index (DSCI) fell 8.5%, reversing a 10.0% rally in October. The DSCI is now down slightly YTD (-0.6%). At its peak in mid-2021, the compilation of direct selling stocks was up around 30% on the year. The Dow Jones Industrial Average (DJIA) also fell in November (-3.7%), but that still represented significant outperformance versus the DSCI.
The weakness among the DSCI components in November was broad based, but not as uniform as in previous down index months during 2021. More specifically, twelve of the 17 DSCI members retreated during November: Eight by 10% or more, but five member stocks rose during the month.
The largest decliner of DSCI members was large cap The Beach Body, Inc. (NYSE: BODY), which lost roughly half its value in November. The company reported a significant year-over-year revenue decline in 3Q 2021 and made marked cuts in its full-year 2021 sales and adjusted EBITDA guidance.
Interestingly, the performance of the large and small cap subgroups of the DSCI were quite similar. For example, three of the nine large cap and two of the eight small cap stocks rose in November. In addition, just over half the large caps declined by more than 10% during the month, while just under half of smaller cap names incurred similar declines. Typically, larger cap stocks outperform smaller caps during times of maximum market stress.
Gauging performance from a longer-term perspective, the DSCI has gained a cumulative 57.1% since the March 1, 2020 index inception, compared with a smaller 35.7% increase for the DJIA over the same period. Year to date, the DSCI has incurred a slight 0.6% loss—a fairly impressive figure given that the index has lost an aggregate 30% since June 30, 2021. The DJIA has advanced 14.1% since year-end 2020.
The broad stock market corrected in November, particularly late in the month, as the Omicron COVID variant surfaced in southern Africa, and Jerome Powell, Chairman of the Fed, told Congress it could begin to taper its bond buying program even faster than he suggested in early November. The direct selling stocks, generally considered a higher risk group, reacted poorly to these uncertainties. These factors, which are unlikely to be resolved for some time, along with fears about the effects of rising inflation, are likely to dominate stock market sentiment over the intermediate term.
Looking Forward
Investors are grappling with conflicting data points. On the one hand, the U.S. economy is recovering strongly, and employment opportunities are growing across almost all industries. Such a backdrop should be good for stocks. On the other hand, the stock market performed well over the first eleven months of 2021, and some investors are fearful that the uncertainties outlined above will prompt further selling before year end.
These macro questions are weighing on the direct selling stocks. A further complication is that a number of DSCI names, including Betterware de Mexico (NASDAQ: BWMX), Tupperware Brands Corporation (NYSE: TUP) and BODY, announced somewhat disappointing 3Q 2021 revenue and earnings results. Given all this, and noting that the next major data point for most DSCI companies—4Q 2021 earnings—will not be released until late January or February of 2022, DSCI stocks as a group seem unlikely to stage a significant reflex rally in December and may trade in a fairly narrow range during the month.
CHARTS & ANALYSIS
The DSCI is a market capitalization weighted index of all domestic public direct selling companies with a market capitalization of at least $25 million. The index is rebalanced monthly, and no single issue is permitted to represent more than 20% of its total value. In such an event, the excess weighting would be redistributed among the other index components.
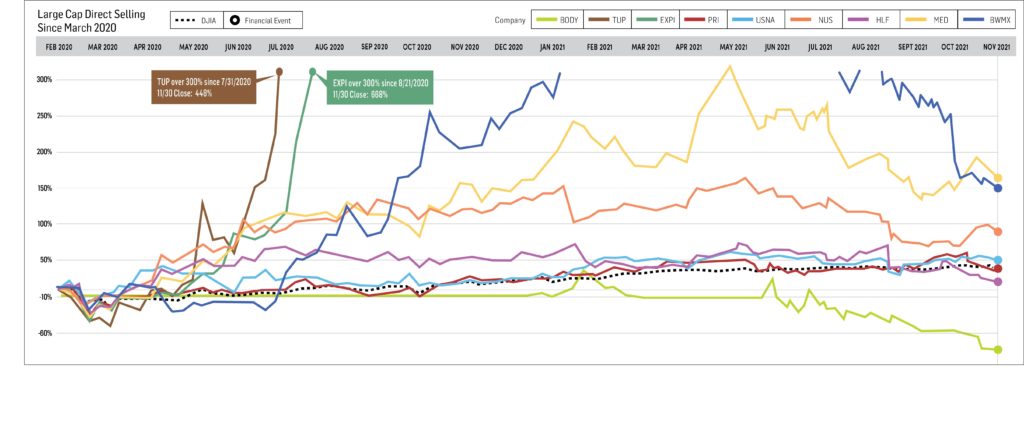
The DSCI declined sharply in November and underperformed the DJIA during the month. Specifically, the DSCI fell 8.5% during the month, while the DJIA declined 3.7%. DSCI data is tracked back to March 1, 2020, and the index has risen 57.1% since that date versus a 35.7% gain in the DJIA. At its peak in June 2021, the index had risen 115.6% since inception. On a year-to-date basis, the DSCI has recorded a slight loss of 0.6%, versus a 14.1% gain for the DJIA.
Large Cap
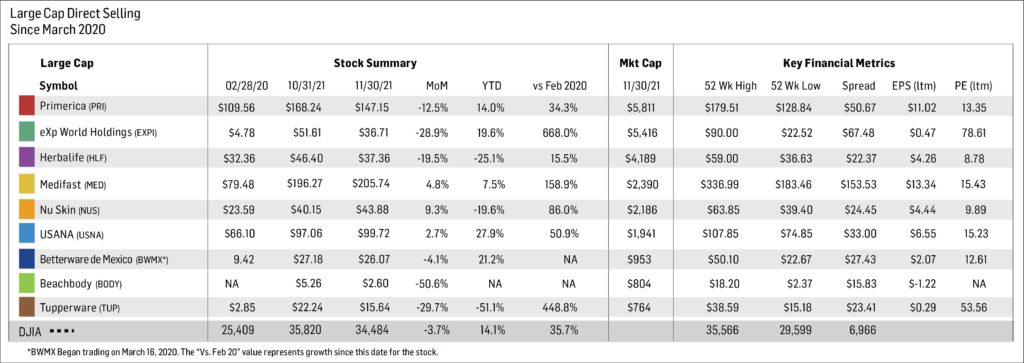
- Betterware de Mexico (NASDAQ: BWMX) outperformed the DSCI in November, declining 4.1% versus an 8.5% fall for the DSCI. BWMX is down 21.2% YTD. After a stellar performance from March 2020 through early July 2021, the stock has lost about half its value over the past five months. In late October 2021, BWMX announced disappointing 3Q 2021 earnings. Its 3Q 2021 revenue and EBITDA increased 4% and decreased 3%, respectively, versus the year-ago period. Both measures represented substantially slower growth than during prior periods. BWMX began trading in March 2020 after the Company’s merger with the SPAC DD3 Acquisition Corp. BMWX specifically targets the Mexican market; it serves three million households through distributors and associates in approximately 800 communities throughout Mexico.
- Tupperware Brands Corporation (NYSE: TUP) plunged 29.7% in November, pushing its YTD losses to 51.1%. Nevertheless, since March 1, 2020, TUP shares have appreciated a resounding 448.8%. In early November, the company reported that 3Q 2021 sales declined 11.0% versus the year-ago period as the lingering effects of COVID-19 affected TUP’s business. In late November, TUP reported that it had raised $880 million in a new secured credit facility. The new facility, which lowers the company’s interest rate on term loans by more than 600 basis points, refinances the company’s existing credit facilities and increases its liquidity by around $100 million.
- Nu Skin Enterprises, Inc. (NYSE: NUS) stock rose 9.3% in November, making it the best performing large cap member of the DSCI. This monthly gain cut its YTD losses to 19.6%. Since the March 2020 establishment of the index, NUS has increased 86.0%. In early November, NUS reported 3Q 2021 results in which revenue and earnings per share declined 9% and 10%, respectively, from 3Q 2020 levels. Nonetheless, both measures exceeded analysts’ consensus estimates.
- Herbalife Nutrition, Inc. (NYSE: HLF) fell 19.5% in November, which brought its full year 2021 loss to 25.1%. Since the March 2020 establishment of the DSCI, the stock has gained 15.5%. In early November, HLF reported mixed 3Q 2021 results. Its net sales were $1.4 billion, down 6% from 3Q 2020 levels due primarily to lingering effects of the pandemic, but the company’s EPS totaled $1.21, up $0.06 from $1.15 in the year-ago period.
- Medifast, Inc. (NYSE: MED) shares rose 4.8% in November marking its second consecutive monthly gain. For the eleven months ended November, MED has appreciated 7.5%. Since the March 1, 2020 establishment of the DSCI, the stock has risen 158.9%. On all three return measures, MED has handily outperformed the direct selling stock index benchmarks. In early November, MED reported impressive earnings results. Revenue and diluted EPS increased 52% and 22%, respectively, compared with the year-ago period. In addition, the company slightly boosted its full-year guidance ranges on both measures. The stock trades at a P/E multiple of about 14.6x, an approximate 30% discount to the overall stock market’s valuation—despite its much faster projected revenue growth.
- USANA Health Sciences, Inc. (NYSE: USNA) joined MED and PRI as the only three large cap members of the DSCI to post gains in November. USANA shares increased 2.7% in the month which boosted its YTD gain to 27.9%. Since the March 2020 inception of the DSCI, USANA shares have appreciated 50.9%, beating the Dow’s 35.7% cumulative price increase. In late October, USANA reported 3Q 2021 sales and EPS that declined 8.1% and 5.6%, respectively, from 3Q 2020. COVID-19-related disruptions impacted the company’s operations and ability to ship sufficient product to customers in 3Q 2021.
- The DSCI’s best performer since its March 2020 establishment, eXp World Holdings, Inc. (NASDAQ: EXPI) reversed some of those gains in November. During the month, it fell 28.9%. Nevertheless, EXPI is up 19.6% over the eleven months ended November. Since March 1, 2020, EXPI has rallied an astonishing 668.0%. In early November, EXPI reported solid 3Q 2021 results; net sales and residential transaction volume nearly doubled versus 3Q 2020 figures, as the total number of its agents rose 82% versus the tally twelve months ago.
- The biggest market cap stock in the DSCI, Primerica, Inc. (NYSE: PRI), declined 12.5% in November. The stock is 14.0% higher over the first eleven months of 2021 and 34.3% higher since the March 2020 inception of the DSCI. On November 8, PRI reported solid 3Q 2021 results. Revenue totaled $693.2 million, up 22% versus the year-ago period. The company benefitted from continued strong momentum in investment and product sales in the period ended September 30, 2021. Earnings per share in the quarter was $2.82, flat versus 3Q 2020. On November 17, PRI’s Board authorized a $275 million share repurchase program through December 31, 2022. This program replaces a $300 million initiative that was approved in February 2021 and was due to expire on June 30, 2022.
- As previously noted, The Beachbody Company, Inc. (NYSE: BODY) stock was the weakest component in the DSCI in November, declining 50.6%. On November 15, Beachbody, a leading subscription health and wellness company, reported disappointing 3Q 2021 results. Revenue was $208.1 million, down 17% from 3Q 2020, as at-home fitness demand softened. In addition, the company recorded an adjusted EBITDA loss of $43.4 million compared with a gain of $31.4 million in the year-ago period.
Small Cap
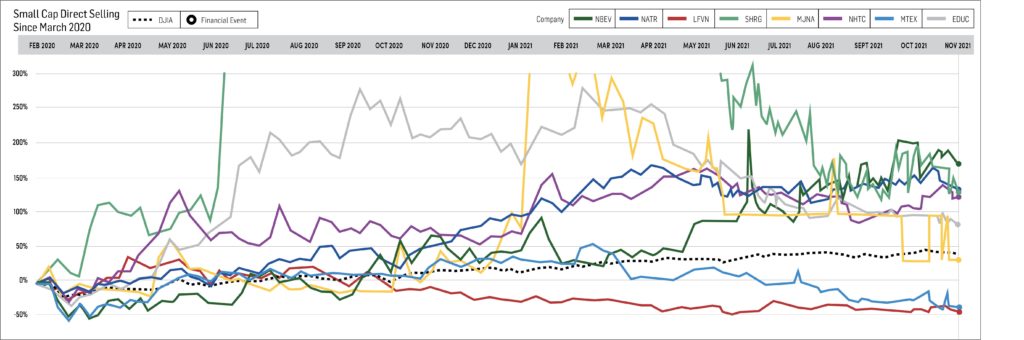
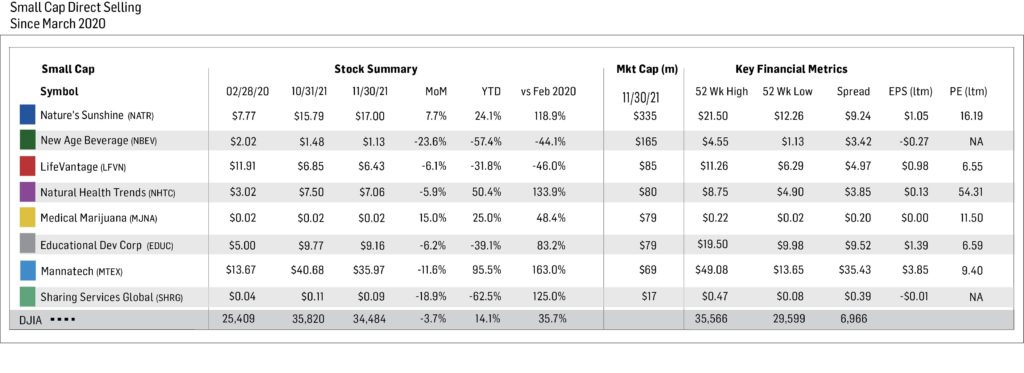
Our small cap tracking set generally trended lower in November, as six of the eight components declined, including three by more than 10%. The standout positive performer among the small caps was Medical Marijuana, Inc. (OTC: MJNA), a cannabis company with three businesses in the non-psychoactive cannabinoid space. MJNA increased 15.0% in November. The stock has appreciated 25.0% over the first eleven months of 2021 and 48.4% since DSCI inception.
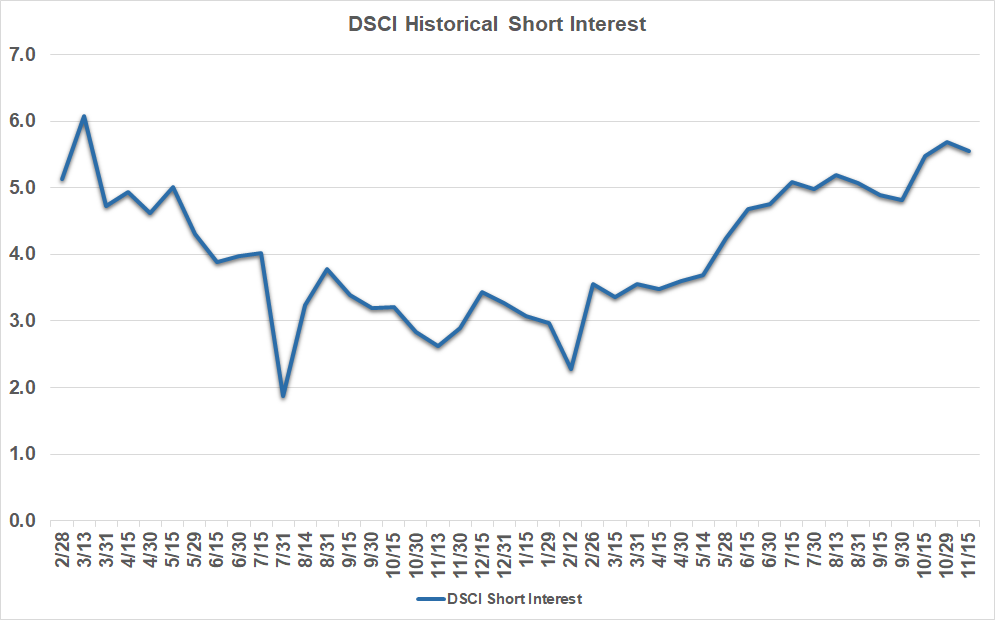
Short Interest Data & Analysis
The following chart is an aggregate index of “days to cover” among the entire tracking set. Days to cover is a measurement determined by dividing the total outstanding short interest by average daily trading volume.
As indicated in the chart above, short interest in industry stocks moved slightly lower in mid-November. Aggregate “days-to-cover” have increased about 150% since bottoming in mid-February.
Short interest can be a difficult indicator to analyze. On the one hand, an increase in short interest can be a bearish sign in that it indicates an increased view among investors that a stock is likely to decline based on any number of factors, such as a belief that the company’s fundamentals are deteriorating or a belief that it has run too far too fast. Conversely, as a stock moves higher, a significant short interest can serve as extra fuel on the fire as investors scramble to “buy to cover” their short positions and mitigate losses.
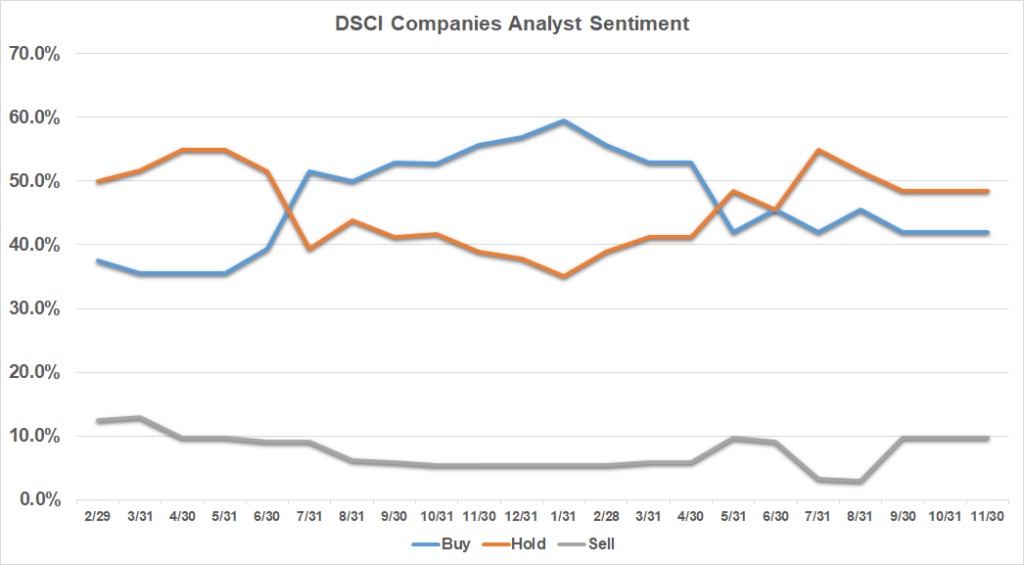
Analyst Sentiment Index
Our Analyst Sentiment Index was unchanged in November from October and remains near the peak level since its March 2020 establishment. During November, the number of sell-side analysts maintaining “buy” and “hold” ratings on industry stocks was 90%. In turn, the percentage of stocks which analysts recommend selling equaled just 10%.
Analysis brought to you by:

Direct Selling Capital Advisors provides monthly market analysis abased on research and the TDSI index. The TDSI is a market capitalization weighted index of all domestic public direct selling companies with a market capitalization of at least $25 million.